![]() Gabe Velázquez
Gabe Velázquez
Online Trading Academy
Each day the global financial markets are impacted by events that cause traders to react in dramatic fashion. These responses, quite often, will have a ripple effect that can stretch across all types of markets and asset classes. In other words, what happens in one market will in turn move another related market. For newer traders, it’s important to understand this relationship. In this post, I’ll go over some of the strongest inverse market correlations and their uses to help traders gain an edge.
However, before we get started there is one major caveat about this topic: correlations usually hold, but there are times when what seemed to be a strong correlation between two markets suddenly change and the edge is lost. This is often a temporary phenomenon, as strong correlations always revert back. An astute trader must be atune to these changes and be flexible enough to make the adjustments necessary to keep his edge.
The first inverse correlation we’ll go over is the one between stocks and bonds. For stocks, we’ll use the ES (S&P 500 mini) against the (US) 30 year treasury bond futures contract to do the analysis. This is a simple risk-on versus risk-off correlation. What is meant by this is that theoretically, stocks are inherently riskier than bonds and therefore when stocks are moving higher investors generally have a bigger appetite for risk and would sell the lower yielding, safer bond market. This change, however when things get rough in the stock market. Investors seek the safe harbor of treasuries, and in order to raise the cash necessary to purchase these fixed yielding instruments they sell their stock holdings.
The charts below illustrate these inverse correlations:
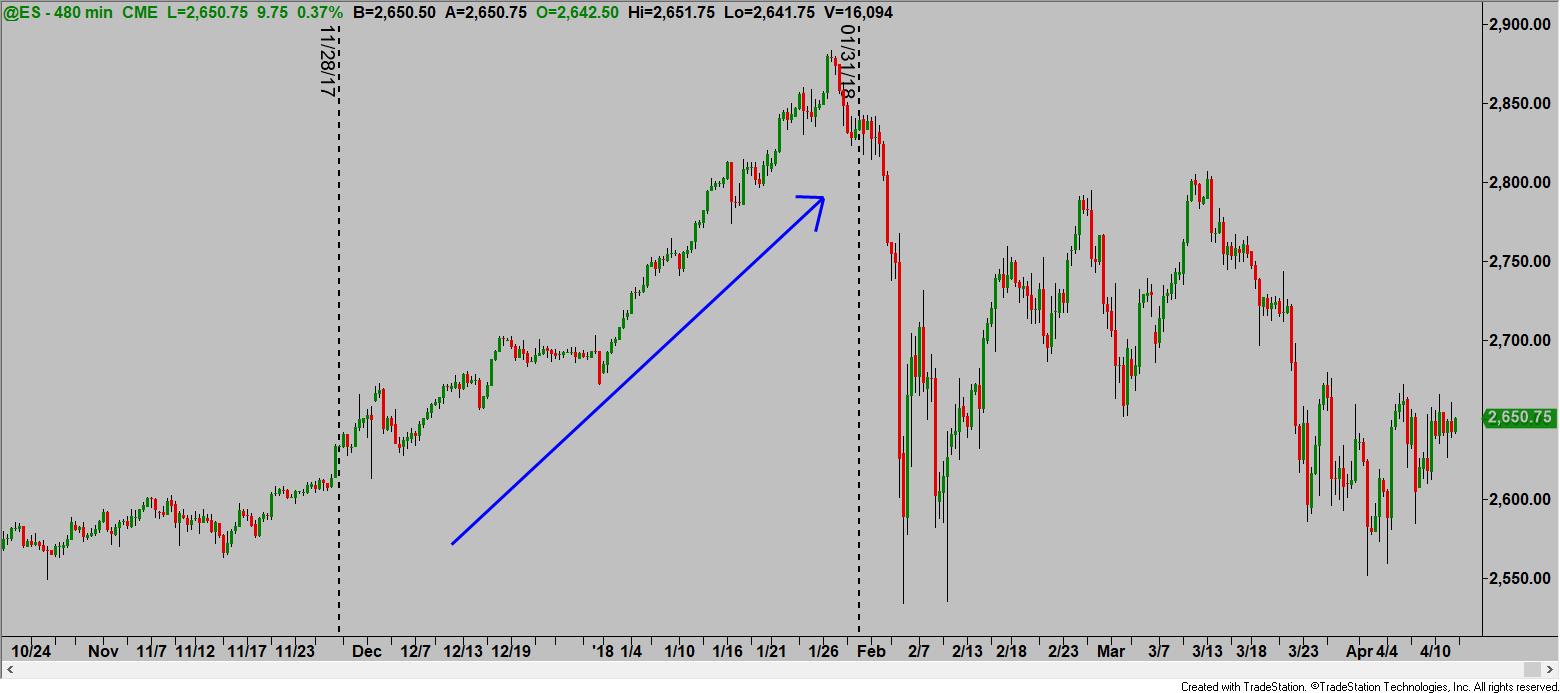
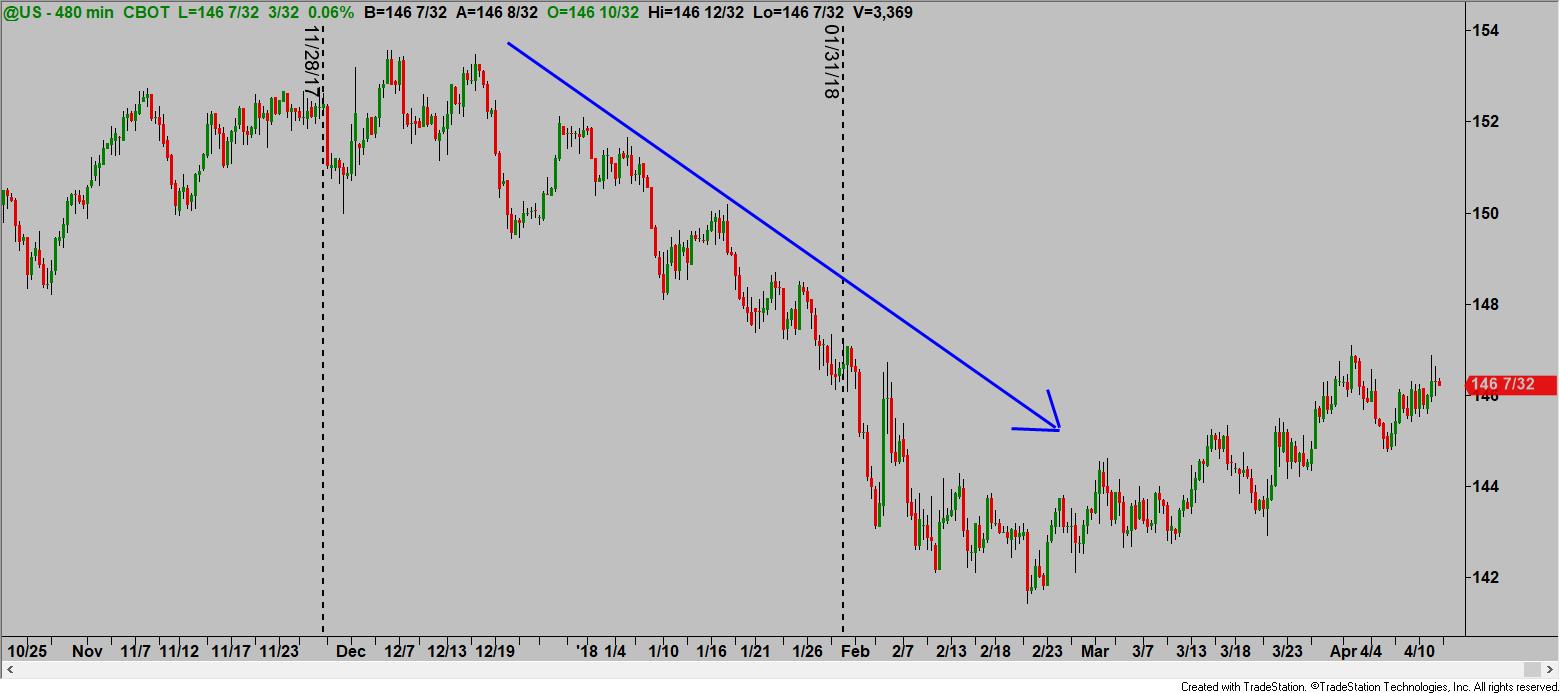
We can see that major inverse moves happened pretty regularly in these two asset classes. The key for traders is to find both markets entering opposing levels simultaneously, thus increasing the probabilities of timing the turning points. This correlation is important for traders who engage the markets on an intermediate-term time frame as it can be a major odds enhancers. Identifying the quality supply and demand levels is the most important element of this equation.
The last inverse correlation we’ll look at is that of the US Dollar index against the Euro Currency. This is a very strong inverse correlation because of how the Dollar Index is comprised, and the way the currency futures contracts are traded.
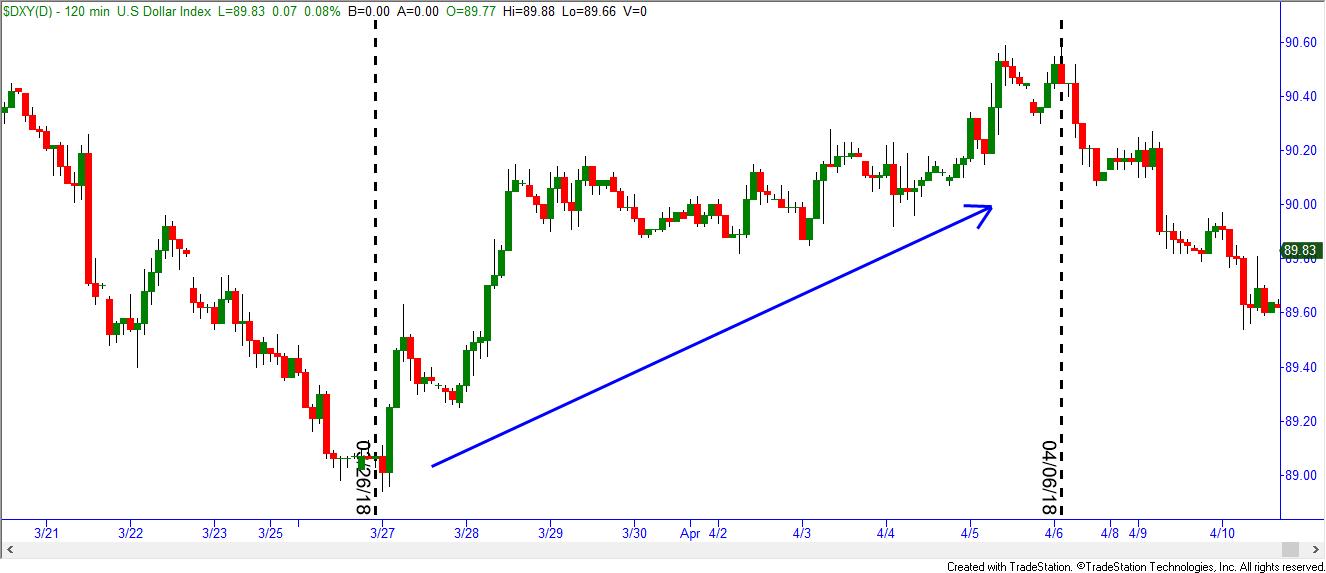
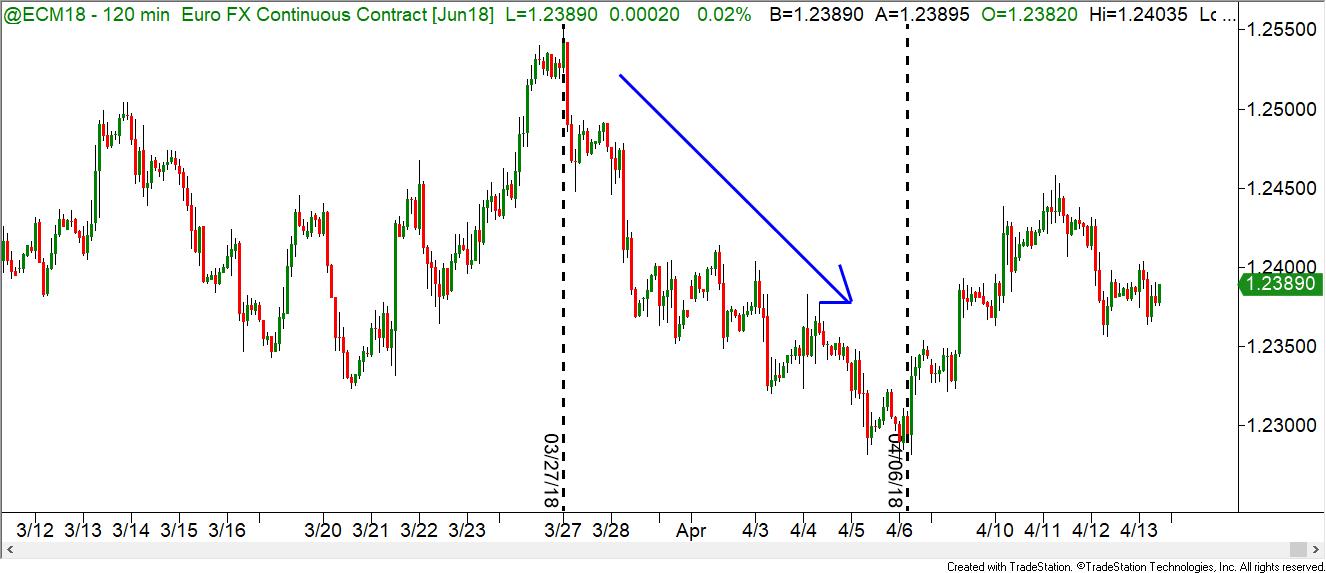
First, the Dollar index is a basket of currencies traded against the US Dollar. The biggest component of this index is the Euro currency constituting over 57% of the index. In addition, currencies futures are only the major global currencies relative to the US dollar. Because of this, the moves in the Euro currency greatly impact the Dollar index. Similar to the Stock-Bond inverse correlation, we can see on the charts below that all the major moves happened on the same day.
For traders trying to gain an edge, learning how different markets impact each other is a must. Not knowing how the US Dollar can change the trajectory of commodities such as oil, copper or gold is a big disadvantage, especially when you’re competing with large banks and institutions who wouldn’t think of putting their traders on the front lines if they didn’t understand how these markets impact one another.
If you want to have a chance to compete successfully, you need to start thinking and acting like them, and part of this, is gaining an understanding of the interrelationships between markets. My hope is that at least this is a good starting point.
Until next time, hope everyone has a great week.
This content is intended to provide educational information only. This information should not be construed as individual or customized legal, tax, financial or investment services. As each individual's situation is unique, a qualified professional should be consulted before making legal, tax, financial and investment decisions. The educational information provided in this article does not comprise any course or a part of any course that may be used as an educational credit for any certification purpose and will not prepare any User to be accredited for any licenses in any industry and will not prepare any User to get a job. Reproduced by permission from OTAcademy.com click here for Terms of Use: https://www.otacademy.com/about/terms
Editors’ Picks

EUR/USD hits two-day highs near 1.1820
EUR/USD picks up pace and reaches two-day tops around 1.1820 at the end of the week. The pair’s move higher comes on the back of renewed weakness in the US Dollar amid growing talk that the Fed could deliver an interest rate cut as early as March. On the docket, the flash US Consumer Sentiment improves to 57.3 in February.

GBP/USD reclaims 1.3600 and above
GBP/USD reverses two straight days of losses, surpassing the key 1.3600 yardstick on Friday. Cable’s rebound comes as the Greenback slips away from two-week highs in response to some profit-taking mood and speculation of Fed rate cuts. In addition, hawkish comments from the BoE’s Pill are also collaborating with the quid’s improvement.

USD/JPY drops back below 157.00, as focus shifts to Japan snap election
USD/JPY is back in the red below 157.00 in the Asian session on Friday. The Japanese Yen recovers ground against the US Dollar amid some profit-taking ahead of Japan's snap general election on Sunday. The preliminary reading of the Michigan Consumer Sentiment Index report for February will be released later on Friday.
Editors’ Picks

EUR/USD: US Dollar to remain pressured until uncertainty fog dissipates Premium
The EUR/USD pair lost additional ground in the first week of February, settling at around 1.1820. The reversal lost momentum after the pair peaked at 1.2082 in January, its highest since mid-2021.

Gold: Volatility persists in commodity space Premium
After losing more than 8% to end the previous week, Gold (XAU/USD) remained under heavy selling pressure on Monday and dropped toward $4,400. Although XAU/USD staged a decisive rebound afterward, it failed to stabilize above $5,000.

GBP/USD: Pound Sterling tests key support ahead of a big week Premium
The Pound Sterling (GBP) changed course against the US Dollar (USD), with GBP/USD giving up nearly 200 pips in a dramatic correction.

Bitcoin: The worst may be behind us
Bitcoin (BTC) price recovers slightly, trading at $65,000 at the time of writing on Friday, after reaching a low of $60,000 during the early Asian trading session. The Crypto King remained under pressure so far this week, posting three consecutive weeks of losses exceeding 30%.

Three scenarios for Japanese Yen ahead of snap election Premium
The latest polls point to a dominant win for the ruling bloc at the upcoming Japanese snap election. The larger Sanae Takaichi’s mandate, the more investors fear faster implementation of tax cuts and spending plans.
RECOMMENDED LESSONS
Making money in forex is easy if you know how the bankers trade!
I’m often mystified in my educational forex articles why so many traders struggle to make consistent money out of forex trading. The answer has more to do with what they don’t know than what they do know. After working in investment banks for 20 years many of which were as a Chief trader its second knowledge how to extract cash out of the market.
5 Forex News Events You Need To Know
In the fast moving world of currency markets where huge moves can seemingly come from nowhere, it is extremely important for new traders to learn about the various economic indicators and forex news events and releases that shape the markets. Indeed, quickly getting a handle on which data to look out for, what it means, and how to trade it can see new traders quickly become far more profitable and sets up the road to long term success.
Top 10 Chart Patterns Every Trader Should Know
Chart patterns are one of the most effective trading tools for a trader. They are pure price-action, and form on the basis of underlying buying and selling pressure. Chart patterns have a proven track-record, and traders use them to identify continuation or reversal signals, to open positions and identify price targets.
7 Ways to Avoid Forex Scams
The forex industry is recently seeing more and more scams. Here are 7 ways to avoid losing your money in such scams: Forex scams are becoming frequent. Michael Greenberg reports on luxurious expenses, including a submarine bought from the money taken from forex traders. Here’s another report of a forex fraud. So, how can we avoid falling in such forex scams?
What Are the 10 Fatal Mistakes Traders Make
Trading is exciting. Trading is hard. Trading is extremely hard. Some say that it takes more than 10,000 hours to master. Others believe that trading is the way to quick riches. They might be both wrong. What is important to know that no matter how experienced you are, mistakes will be part of the trading process.
The challenge: Timing the market and trader psychology
Successful trading often comes down to timing – entering and exiting trades at the right moments. Yet timing the market is notoriously difficult, largely because human psychology can derail even the best plans. Two powerful emotions in particular – fear and greed – tend to drive trading decisions off course.