How To Use Forex Correlations
Understanding the inter-connectedness of various global markets is key to success in Forex trading. Inter-market correlations exist between different sectors such as equities and fixed income, commodities and equities and currencies and fixed income to name a few, but there are also very clear correlations present within the currency market themselves. Learning to identify and correctly take advantage of these correlations can increase the probability of being successful in trading and good awareness of these important correlations can make the difference between a winning and losing trade.
Correlations are assigned a numerical value between -100 and + 100 where 100 = a strong positive correlation ( they move in the same direction) and -100 = a strong negative correlation ( they move in different directions). Values around 0 such as -30 or + 40 indicate no real relationship between the two currency pairs and as such they are weakly correlated. Correlations above +70 and below -70 are found to be significant in terms of establishing the presence of a clear correlation.
Using a Forex correlations dashboard such as the one on Myfxbook.com is a great way to keep abreast of the various Forex correlations as shown below.
_20150918080907.png)
For example, over the last month GBPJPY AND GBPCAD have displayed an 89.1% correlation showing that the two pairs are strongly correlated, as shown in the chart below.
correlations.
_20150918081110.png)
Knowing that these two pairs are tending to move in a very correlated manner over the last month we could wait until we have a clear directional setup in one pair and look to trade the other pair in the same direction also, profiting from the similar directional move.
Identifying a strong correlation can also allow us to confirm our setups by identifying similar directional setups n both pairs.
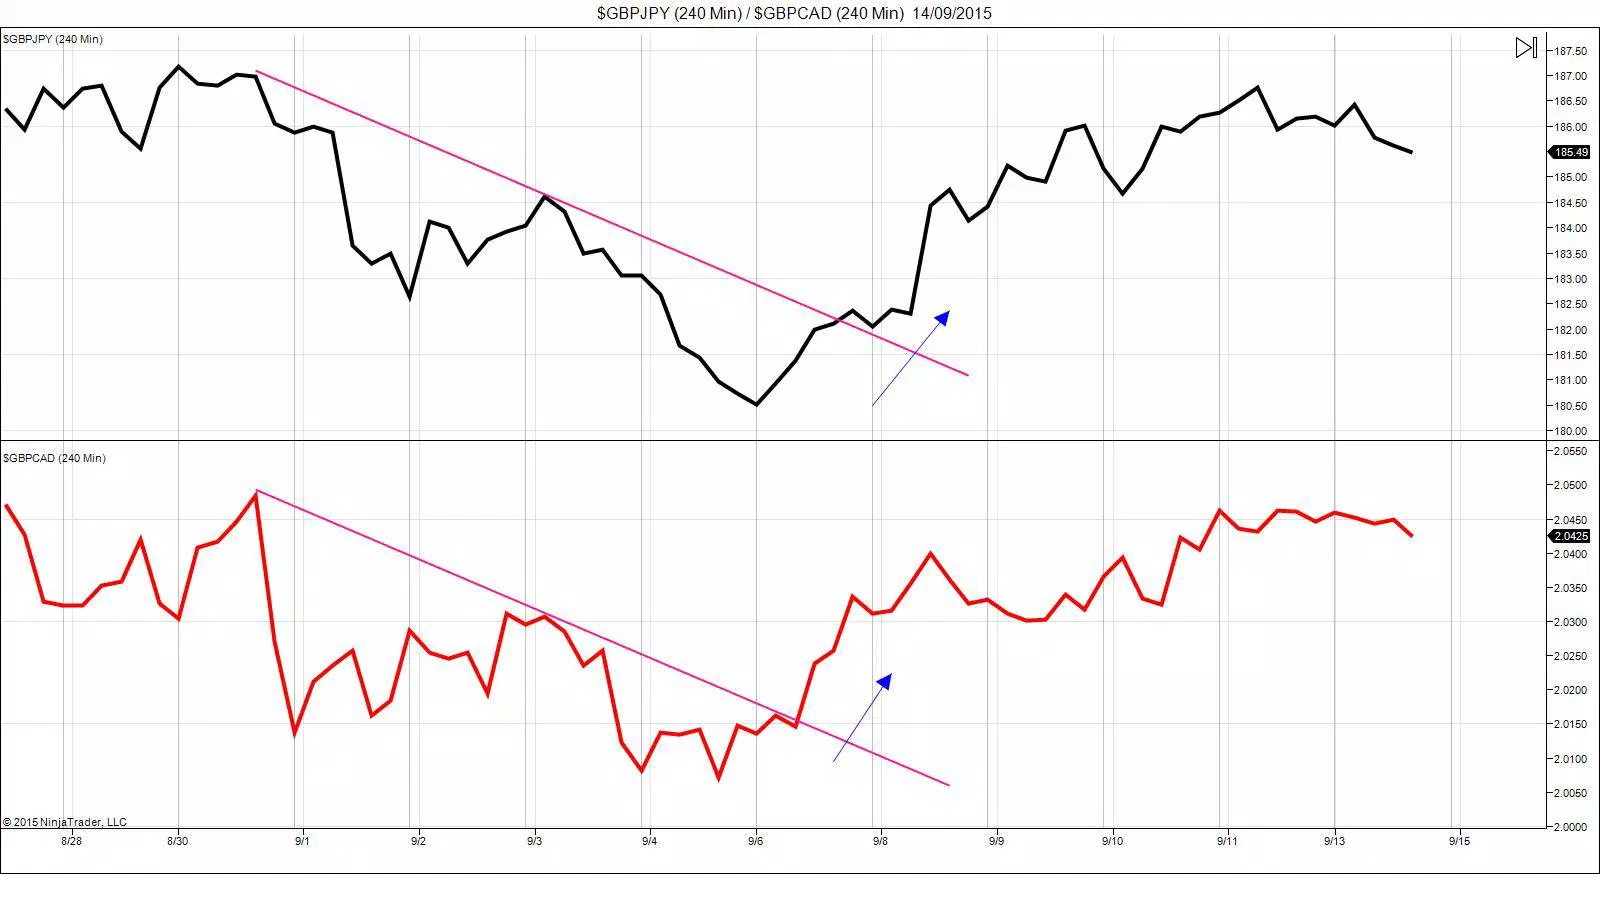
In the chart above we can see that both pairs broke out of a bearish trend line at roughly the same time which is a clear indication of bullishness. If one pair was breaking out of a trend line but the other wasn’t this would raise a question mark over the strength of the signal (potential false breakout) and so where we have strongly positively correlated pairs, identifying similar setups allows us to confirm the strength of the move and increase the chances of success in trading the subsequent move.
Whilst we can clearly profit from correlations in the market place, correlations can also help us to protect against losses.
Using GBPJPY and GBPCAD as the example we can see that as they are so strongly correlated our trade is really a position based on GBP and so we can look to monitor the correlations of our trades to ensure we don’t take on unnecessary exposure to one currency. It may be appropriate to have two GBP based trades on at one time but we wouldn’t want five trades on as that would leave us wide open to taking a large loss on an adverse move in GBP. However, strong positive correlations don’t just occur among pairs sharing a base currency. There are a wide number of drivers behind correlations in the Forex markets such as currencies; relationship with the US Dollar, relationship with risk appetite and relationship with commodity flows, to name but a few, so it is important to always check the correlations of trades in your portfolio to make sure you don’t become over-exposed holding a basket of trades all with strong positive correlations.
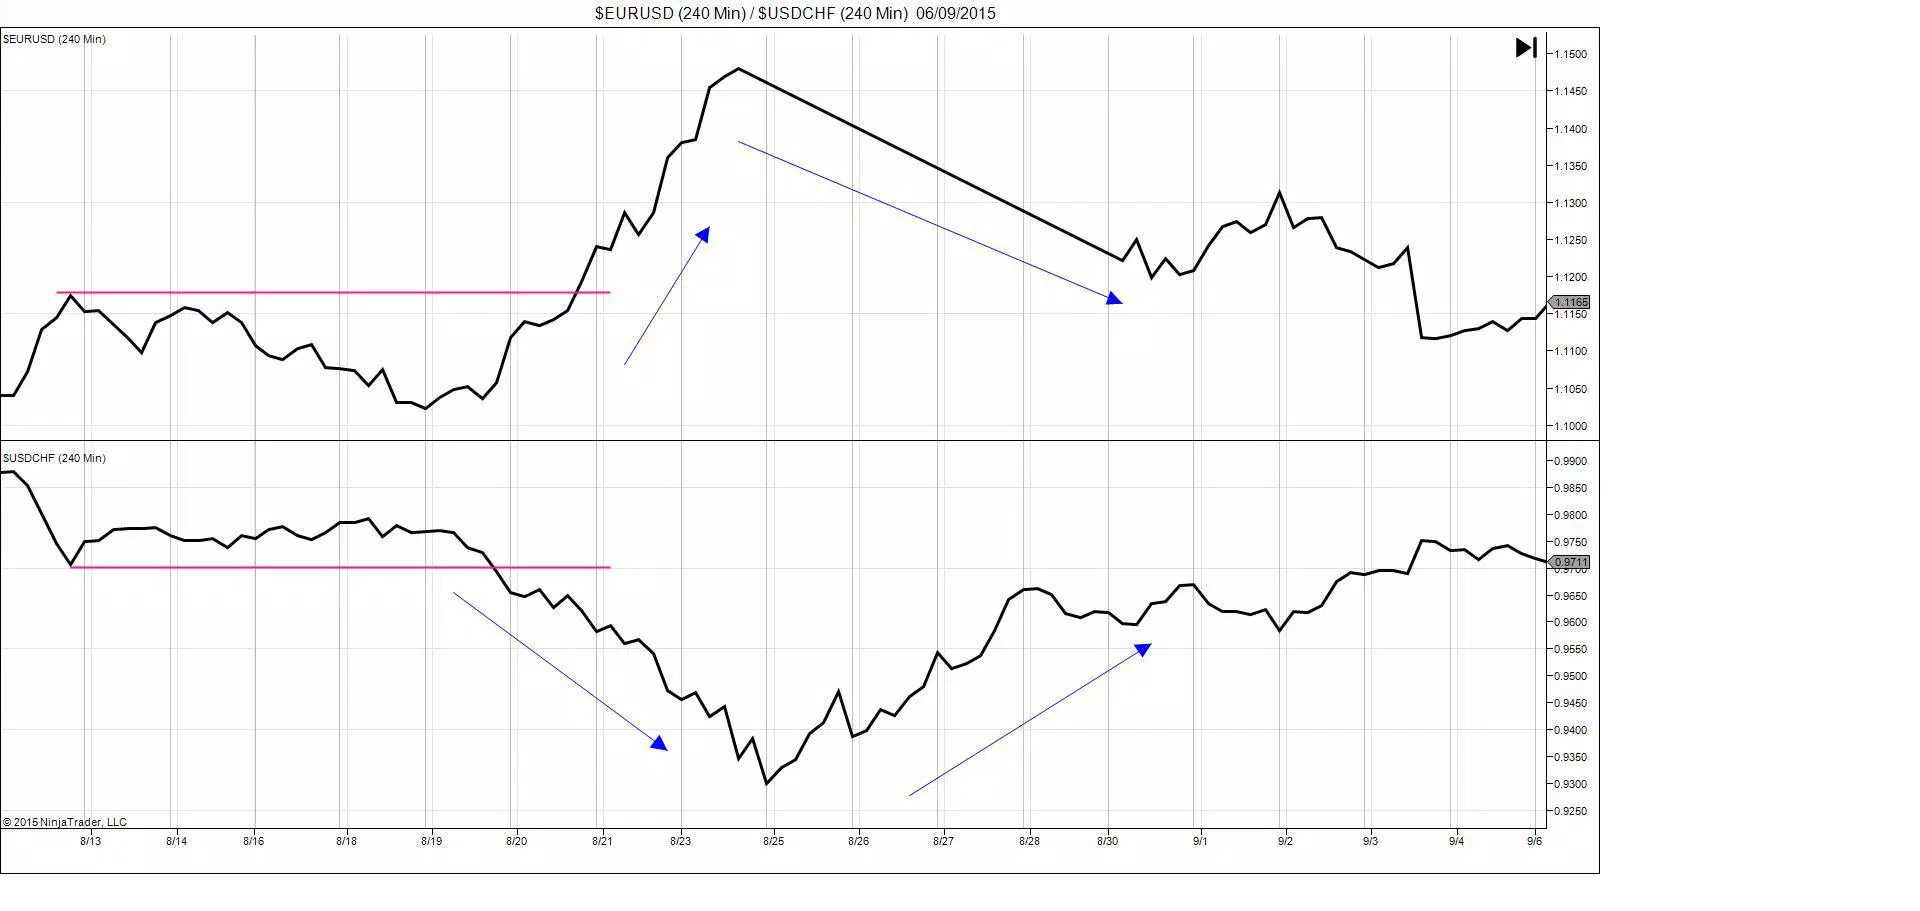
The chart above shows EURUSD & USDCHF, two currency pairs which are traditionally strongly negatively correlated. Let’s think about a scenario where we can use this to our advantage.
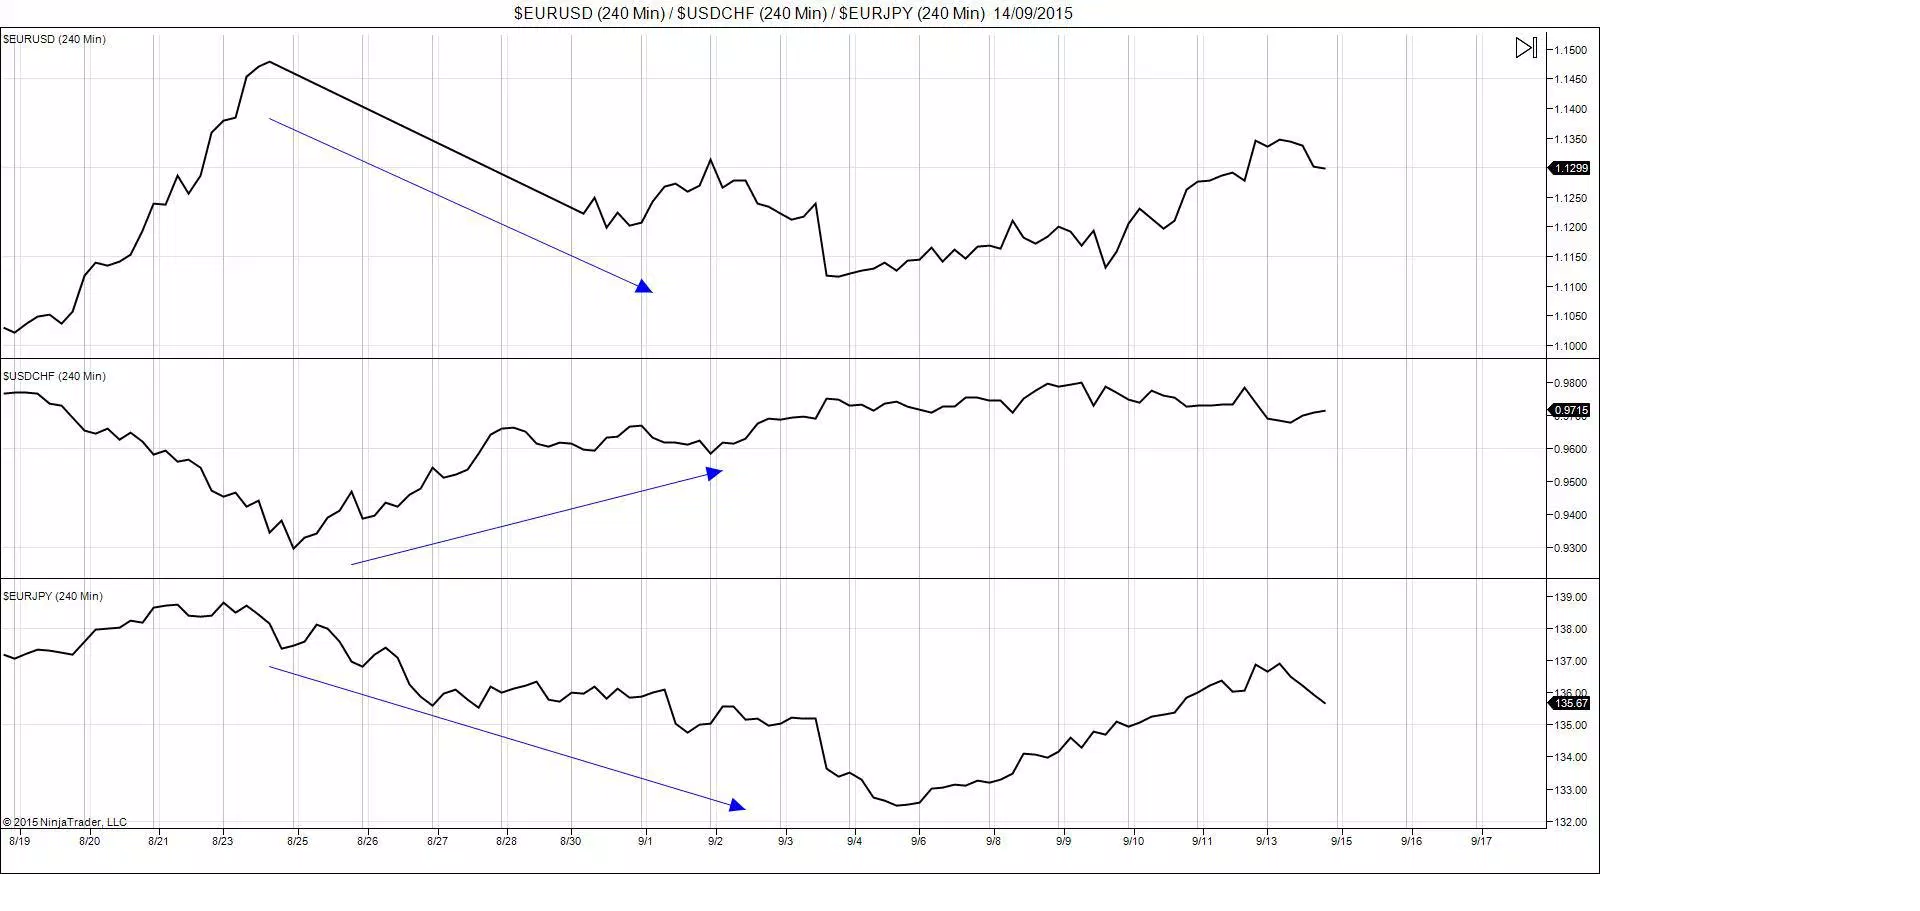
In the chart above we can see that if we were short EURUSD & EURJPY in the last week of August, we could have used a short USDCHF to hedge some of our risk on those trades expecting that if we had been wrong and EURJPY & EURUSD had in fact moved higher, USDCHF would have moved lower as per the strong negative correlation we identified earlier and thus would mitigate part of our loss so we didn’t take a full hit.
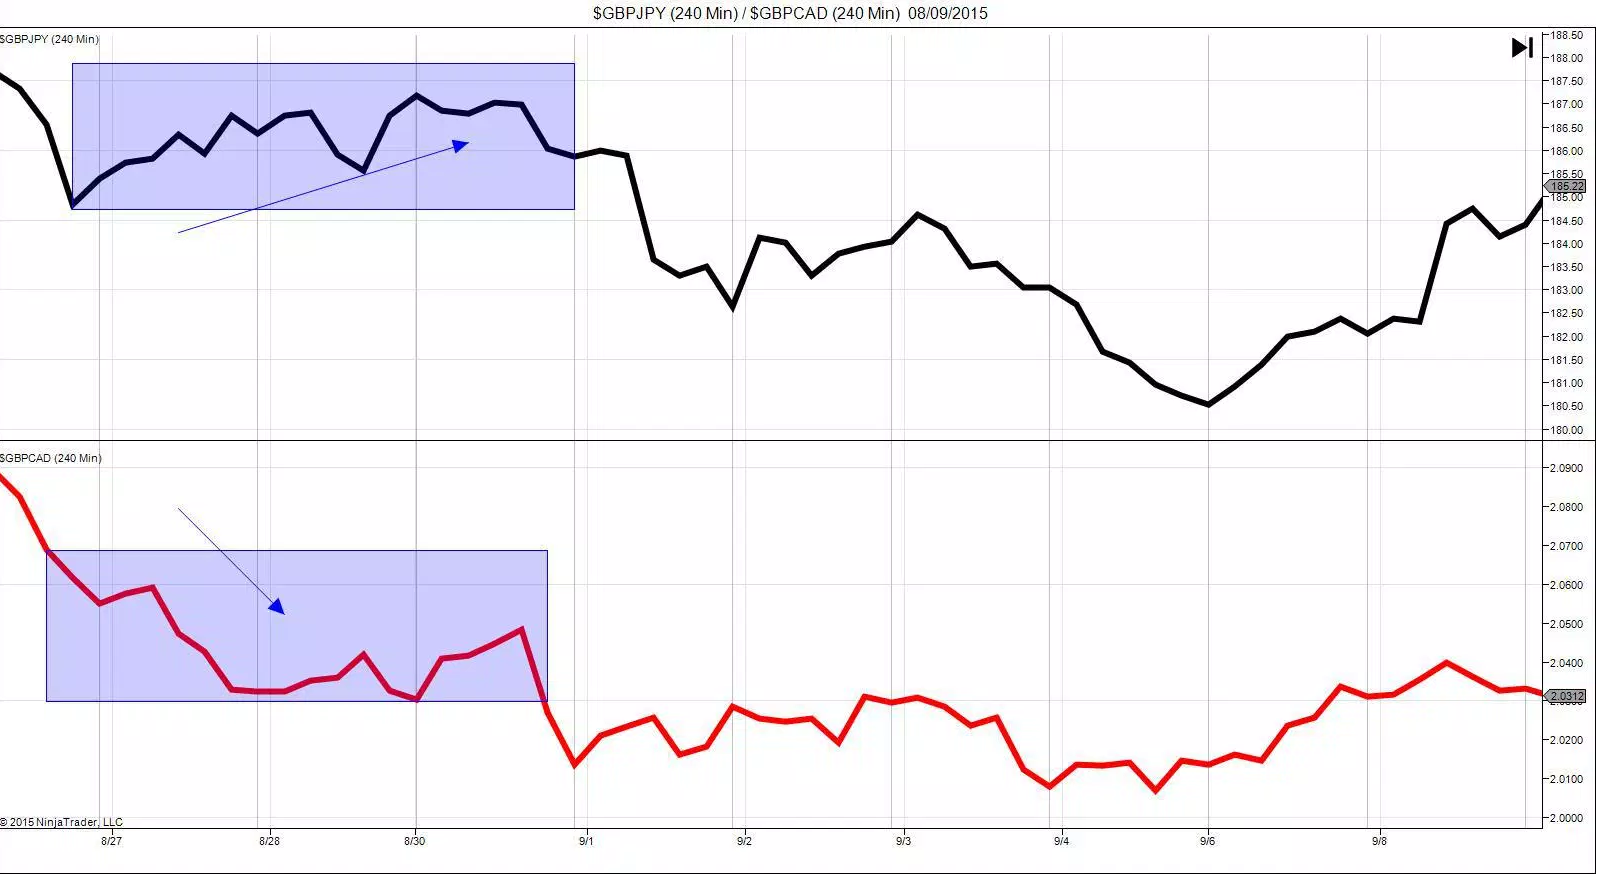
As you can see, there are many ways to use correlations in Forex to assist you in trading whether in targeting higher profits or looking to protect against and limit losses. One important point to note is that correlations are changeable, they are not fixed and so two currency pairs that share a strong positive correlation one month, may indeed lose that correlation the next so it is important to constantly monitor correlations.
In the chart below we can see a period of “de-correlation” between GBPJPY & GBPCAD where GBPJPY trades higher and GBPCAD trades lower before they return to sharing a strong positive correlation.
Correlations are also different on different time frames and so whilst two currency pairs may share a certain correlation on the 60 minnute charts they may share an entirely different correlation on the weekly timeframe and so again it is important to always monitor correlations specific to your time frame
Forex correlations can be an incredibly useful tool for traders and is certainly an interesting subject, if you want to keep up-to-date on the key fundamental issues shaping these correlations make sure to check out of Forex Morning Report where we highlight the market drivers affecting currencies on a daily basis.
What Are Correlations?
A correlation is a measure of the strength of the relationship between two variables, in currency trading correlations measure the strength of the relationship between two currency pairs.Correlations are assigned a numerical value between -100 and + 100 where 100 = a strong positive correlation ( they move in the same direction) and -100 = a strong negative correlation ( they move in different directions). Values around 0 such as -30 or + 40 indicate no real relationship between the two currency pairs and as such they are weakly correlated. Correlations above +70 and below -70 are found to be significant in terms of establishing the presence of a clear correlation.
Using a Forex correlations dashboard such as the one on Myfxbook.com is a great way to keep abreast of the various Forex correlations as shown below.
How Can We Use Correlations
Understanding and learning to use correlations can create a wealth of opportunities for traders. Where we identify a clear trade setup or clear directional bias in one currency pair, we can then create further opportunities by looking to the currency pairs that display strong correlations with our base pair and trading in the anticipated direction suggested by the correlation.For example, over the last month GBPJPY AND GBPCAD have displayed an 89.1% correlation showing that the two pairs are strongly correlated, as shown in the chart below.
correlations.
Knowing that these two pairs are tending to move in a very correlated manner over the last month we could wait until we have a clear directional setup in one pair and look to trade the other pair in the same direction also, profiting from the similar directional move.
Movement Not Magnitude
Correlations measure relationships in terms of whether the two pairs trade in the same direction, however they do not measure magnitude and so they won’t necessarily move at the same rate. To get an idea of magnitude of moves, look to use classic volatility measures such as ATR or ADX.Identifying a strong correlation can also allow us to confirm our setups by identifying similar directional setups n both pairs.
In the chart above we can see that both pairs broke out of a bearish trend line at roughly the same time which is a clear indication of bullishness. If one pair was breaking out of a trend line but the other wasn’t this would raise a question mark over the strength of the signal (potential false breakout) and so where we have strongly positively correlated pairs, identifying similar setups allows us to confirm the strength of the move and increase the chances of success in trading the subsequent move.
Whilst we can clearly profit from correlations in the market place, correlations can also help us to protect against losses.
Using GBPJPY and GBPCAD as the example we can see that as they are so strongly correlated our trade is really a position based on GBP and so we can look to monitor the correlations of our trades to ensure we don’t take on unnecessary exposure to one currency. It may be appropriate to have two GBP based trades on at one time but we wouldn’t want five trades on as that would leave us wide open to taking a large loss on an adverse move in GBP. However, strong positive correlations don’t just occur among pairs sharing a base currency. There are a wide number of drivers behind correlations in the Forex markets such as currencies; relationship with the US Dollar, relationship with risk appetite and relationship with commodity flows, to name but a few, so it is important to always check the correlations of trades in your portfolio to make sure you don’t become over-exposed holding a basket of trades all with strong positive correlations.
Useful For Hedging
Leading on from the last point, we can also use correlations to hedge our positions. Where we identify strongly positively correlated pairs as trading in the same direction and so offering the opportunity to increase profits on a move, strongly negatively correlated pairs offer the capacity to provide effective hedging.The chart above shows EURUSD & USDCHF, two currency pairs which are traditionally strongly negatively correlated. Let’s think about a scenario where we can use this to our advantage.
In the chart above we can see that if we were short EURUSD & EURJPY in the last week of August, we could have used a short USDCHF to hedge some of our risk on those trades expecting that if we had been wrong and EURJPY & EURUSD had in fact moved higher, USDCHF would have moved lower as per the strong negative correlation we identified earlier and thus would mitigate part of our loss so we didn’t take a full hit.
As you can see, there are many ways to use correlations in Forex to assist you in trading whether in targeting higher profits or looking to protect against and limit losses. One important point to note is that correlations are changeable, they are not fixed and so two currency pairs that share a strong positive correlation one month, may indeed lose that correlation the next so it is important to constantly monitor correlations.
In the chart below we can see a period of “de-correlation” between GBPJPY & GBPCAD where GBPJPY trades higher and GBPCAD trades lower before they return to sharing a strong positive correlation.
Correlations are also different on different time frames and so whilst two currency pairs may share a certain correlation on the 60 minnute charts they may share an entirely different correlation on the weekly timeframe and so again it is important to always monitor correlations specific to your time frame
Forex correlations can be an incredibly useful tool for traders and is certainly an interesting subject, if you want to keep up-to-date on the key fundamental issues shaping these correlations make sure to check out of Forex Morning Report where we highlight the market drivers affecting currencies on a daily basis.
Author

Littlefish FX Analysts
Littlefish FX
Our expert team of analysts, traders and IT developers have developed innovative and cutting-edge Order Flow Systems giving Littlefish FX a bank-level view of the Foreign Exchange Market.
More from Littlefish FX Analysts


