How I use the Tradingview stock screener to find the best stocks to trade [Video]
![How I use the Tradingview stock screener to find the best stocks to trade [Video]](https://editorial.fxstreet.com/images/Markets/Equities/shares-certificate-7851553.jpg)
TradingView Stock Screener
I want to show you how I use the TradingView stock screener to find the best stocks to trade.
TradingView is a software that’s available for free, and they also have a low-cost version and I believe it’s only $14.95.
There are a lot of things that you can do with TradingView, but today we’re going to focus on the stock screener.
So let’s jump onto the computer and I’ll show you how I personally use the stock screener to find the best stocks to trade.
When you go to the TradingView website, this is what it looks like.
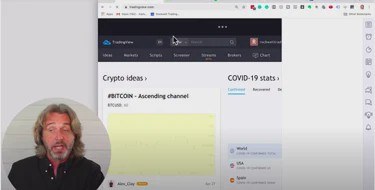
As you can see, there’s no chart.
Full Featured Chart
In order to get to the stock screener, I recommend that you bring up any stock, it doesn’t really matter.
For this example, I’m bringing up Apple (AAPL).
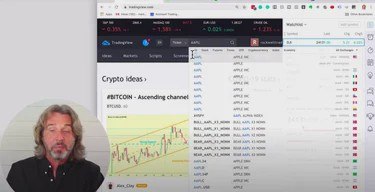
And as soon as you click on Apple, you want to click on “full-featured chart.”
Once you do, you will now see a full-featured chart that looks kind of like this:
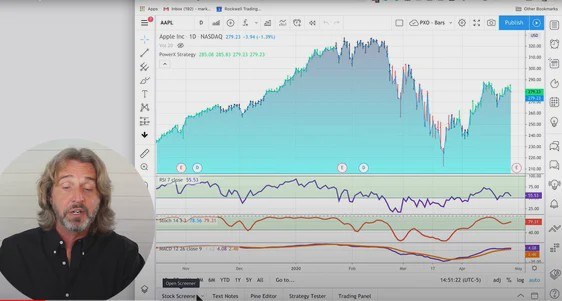
Then at the bottom, you’ll see that there’s a stock screener, text notes and on the right-hand side, you also have quite a few symbols.
Now, let’s talk about the first one here on the upper right. This is where you can have your watchlist of the stocks that you’re watching.
TradingView Watchlist
Now, I like to look at the indices. I like to look at Bitcoin, crude oil, and gold. These are the symbols that I am watching.
Now, here is where the stock screener comes in. The third or fourth button down here on the right-hand side is showing the so-called hotlist.
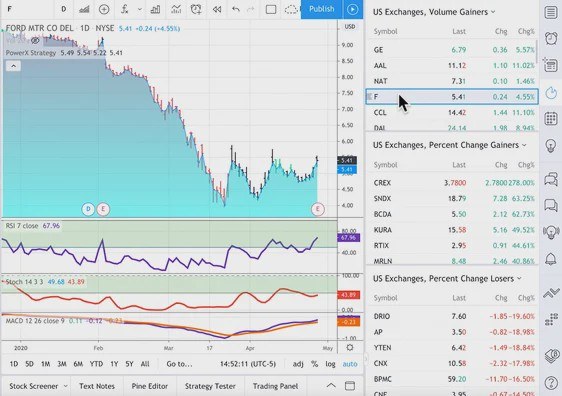
There are three predefined hotlists that come up when you click on this. This is for the US exchanges, the volume gainers.
This where you see the stocks that really have had a lot of volume today. So, for example, GE up 5.6%. Apple up 11%, Ford up 4.4%.
You also see the percentage gainers.
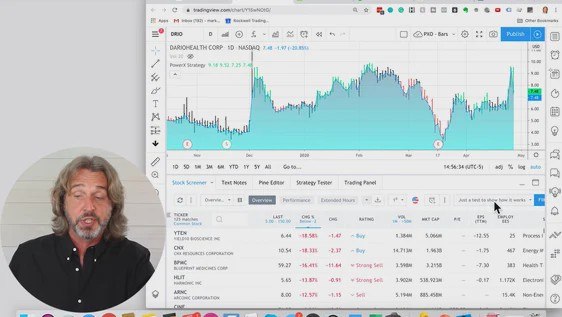
This is where you see stocks like CREX, a penny stock that was trading at $0.80, now trading at $3.80. I didn’t find this particularly useful.
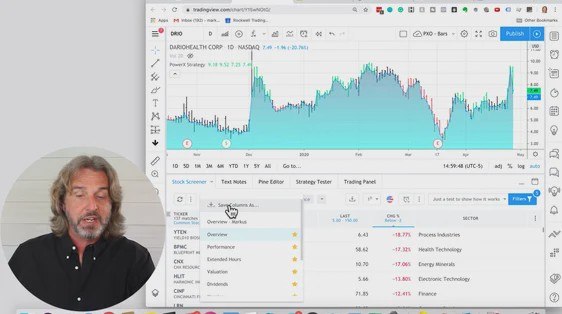
Same for the percentage losers, for example, you have DRIO, DarioHealth, didn’t find this particularly useful.
Define Your Own Scanner
Now I want to show you how to define your own scanner, and also the scanner that I personally like to use the best.
So when you click on the lower left, it brings up the stock screener and you have predefined screeners in there.
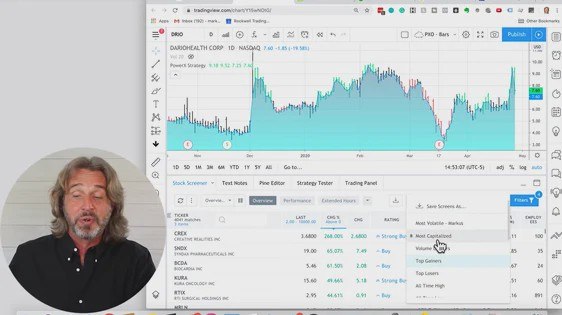
Here we have the volume leaders, as well as the top gainers and the top losers.
I’m going to select the top losers right now, because I want to show you how I configure this list.
As you know, right now, I am using this scanner to find stocks where I can sell put options as the markets are crazy right now.
I mean, today is April 28th and at this time we’re at Day 46 of these crazy markets.
And while the markets have been crashing and now are slowly coming up, selling puts has been really, really great.
So the stock screener that I’m about to set up right now is for exactly that purpose.
But as you follow along, you’ll see that you can use this screener in many, many ways.
So let me show you exactly how to set it up.
How To Set Up The Stock Screener
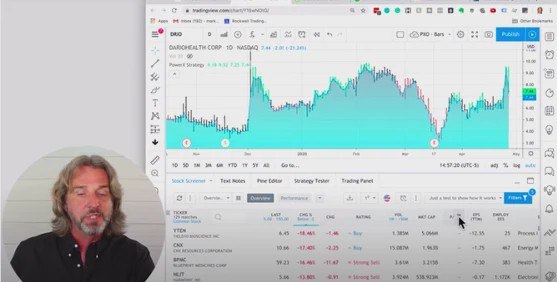
So, again, it doesn’t matter, you just pick any of the predefined lists, I’m picking the top losers list.
Now, this is where I like to go to filters and I like to adjust the filters to meet my criteria. Let me show you one more time how to get there.
You see this big blue button on the upper right here of this list. So when you click on filters, that’s where you can adjust it.
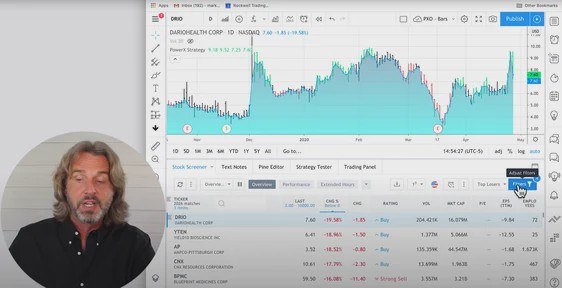
Here is how I like to adjust it.
I want to see a percent change where the stock today is losing more than 2%. So I’m entering a minus two here.
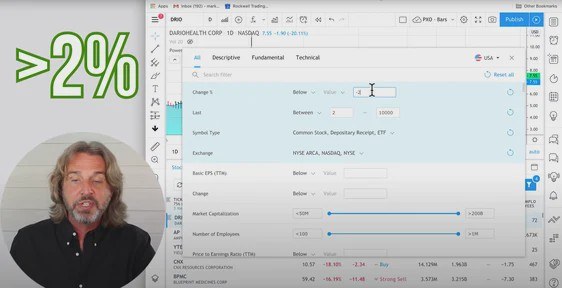
For the last price, I like to look at stocks that are trading between $5 and $150. Yours might be different I’m just showing you how I use this scanner.
Now, in terms of symbol type, this is the third thing out of four that I’m going to change.
Here I’m only looking at common stock.
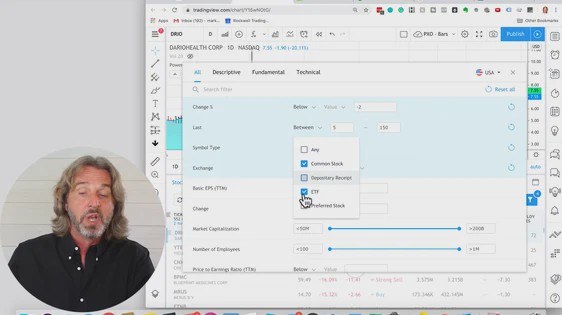
So I’m unselecting depositary received and ETFs. So again, super easy. All I need to do is that I adjust four different settings.
I’ll leave the exchange as is. But the one thing that I’m looking for here right now is the volume filter.
Just to briefly recap what I’m changing:
- The change percent to a negative 2
- The last to between $5 and $150
- The symbol stock to common stock
- And the fourth thing that I’m changing is the volume.
I would like to see stocks that are trading at least a million shares per day up to whatever more than 50 million.
So these are the only four things that I’m changing. And by doing this, you see that right now I have 125 matches.
Now, this is where right now you see top losers has a little asterisk there so I have changed it.
You can now save this screen as whatever you want.
How To Adjust The Columns
Now I want to show you how to adjust the columns here. This is the second thing that I do.
Here you see that we have a lot of columns. We have the ticker, the last price that is traded, the change.
We have the change in dollars, so that’s the change in percent. A rating, the volume, the market cap.
And there are a lot of columns that I personally do not use.
So here’s the really, really cool thing. All you need to do to get rid of a column is right mouse click on it and remove the column.
So I like to keep the ticker and the last price, I would like to know this. And I like the percent change.
I don’t need the change in dollars. But again, for you, it might be different this is why I want to show you how to do this in general.
So I’m removing this column, the change in dollars, and the rating. I do my own rating so I’m removing this.
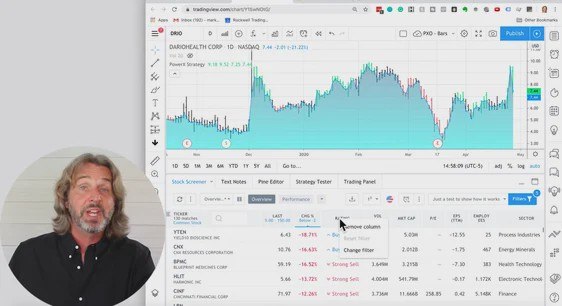
And you’re doing it by right mouse clicking on the column and removing it as shown in the picture above.
I don’t need the volume information because I already know that all of these stocks are trading between 1 million and above, so I can remove this.
I also don’t care about the market cap, the P/E ratio, the EPS or employees so I’m removing them.
Again, you, it can be different for you, so you might care about it or not.
The sector is the last column and I leave this one in.
Now, if you want, you can click on these three dots on the right-hand side and you can add a bunch of columns.
As you can see, there is a lot of information available, so you can add as many columns as you want.
So the only columns that I like to see are the ticker symbol, the last price, the change in percent, and the sector.
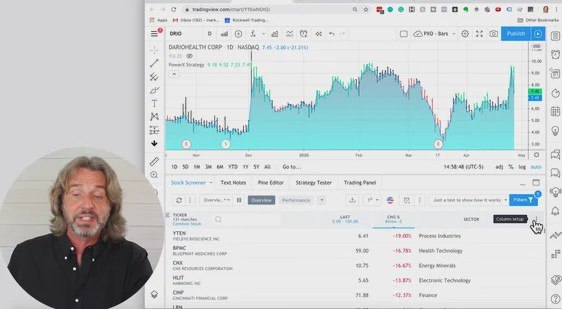
Now also, in the same way as we have saved the filter, we can save the column layout. And the difference is that this is on the left-hand side.
So you see on the left-hand side you have the column sets. Here this is where we selected the filter.
So we can go for volume gainers and it is still using the columns that we just defined.
Or we can go for the top losers or what we have just saved, just a test to show how it works.
Now we can now save our own columns.
The two things that you can save in the TradingView stock screener are your filter and your column layout.
You can now close the screener by clicking on height, and you can bring it back up by clicking on stock screener.
Now you can quickly go through this and look at the stocks and see which ones of these you like.
This was just a very brief intro on how I use the TradingView stock screener to find the best stocks to trade.
Hope that you find it helpful.
Related read: TradingView tutorial for beginners
If you are looking for TradingView tutorial, then this is the one for you. Now, as you know, TradingView is an online charting platform that allows traders to share their ideas and inside with other traders worldwide. It’s also a super powerful tool for technical analysis, testing strategies, and even automated trading systems development. You can even use it on your desktop or mobile device wherever you are. However, it is also easy to get overwhelmed. Keep reading
Author

Markus Heitkoetter
Rockwell Trading
As founder and CEO of Rockwell Trading Services LLC., Markus Heitkoetter has shared his trading methods and ideas with more than 300,000 traders in over 196 countries.


