TradingView tutorial for beginners 2021: Master TradingView in less than 30 minutes

If you are looking for TradingView tutorial, then this is the one for you. Now, as you know, TradingView is an online charting platform that allows traders to share their ideas and inside with other traders worldwide.
It’s also a super powerful tool for technical analysis, testing strategies, and even automated trading systems development. You can even use it on your desktop or mobile device wherever you are. However, it is also easy to get overwhelmed.
Now, in this TradingView tutorial for beginners, I will show you a 10-step, step-by-step approach, on how you can become a TradingView expert in no time. So let’s get started here.
How To Set Up Trading In 10 Steps
Step number 1 is to decide what do you want to display? Do you want to display candles, vases, bars or do you want to have a zone as I use?
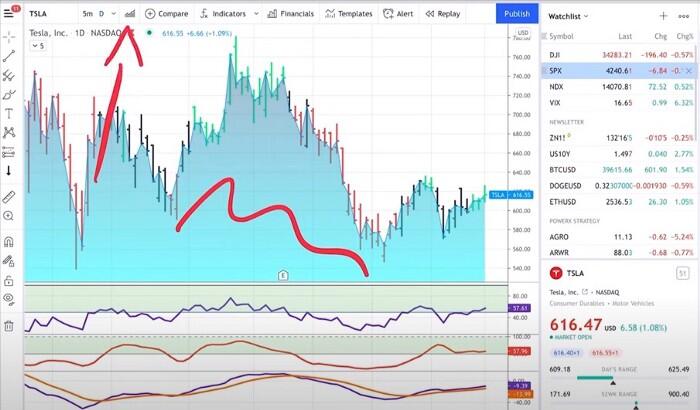
In order to do this, all you need to do is click on the “chart icon” at the top. You can switch from bars to candles if you want to, to hollow candles to heikin ashi, a simple line chart, or what I like to do, an area chart. So as you can see, this is super easy. Alright, you already mastered step number one.
Step number 2. Some of the important settings that I think you should know. So you can either double click on the chart, or you can just click on the symbol, and then click on “settings.”
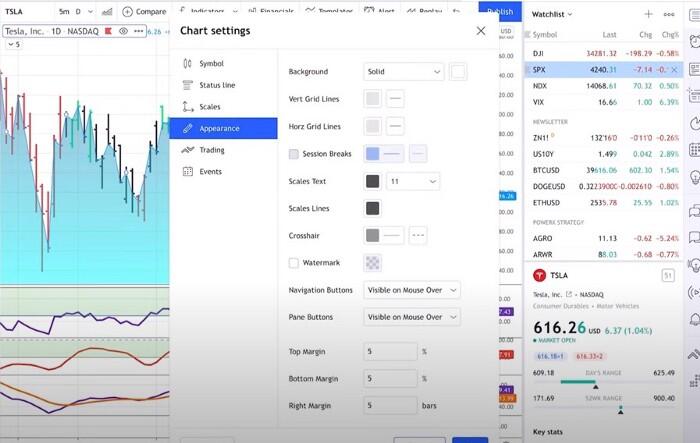
So a few things that I like here. First of all, the “appearance,” if you don’t like the white background and you would like to have a rather dark background, you can change this in the “background” section. I mean, it’s not for me, but some traders like the black background here.
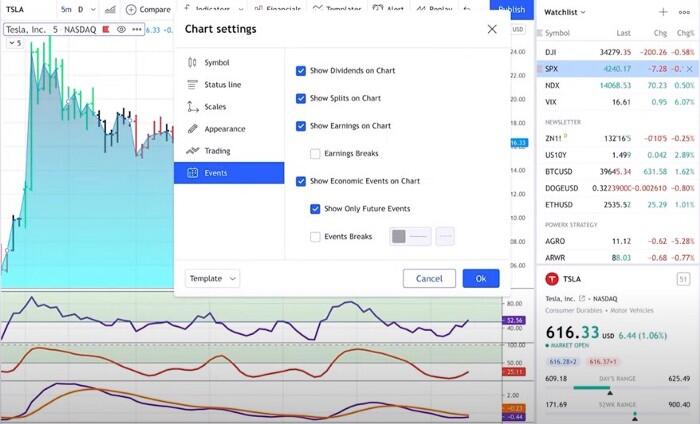
There are two more settings that I think are pretty cool. The first one is that you can show the “Events” if you want to see dividend splits or stock earnings on the chart. I highly recommend that you check all of these boxes.
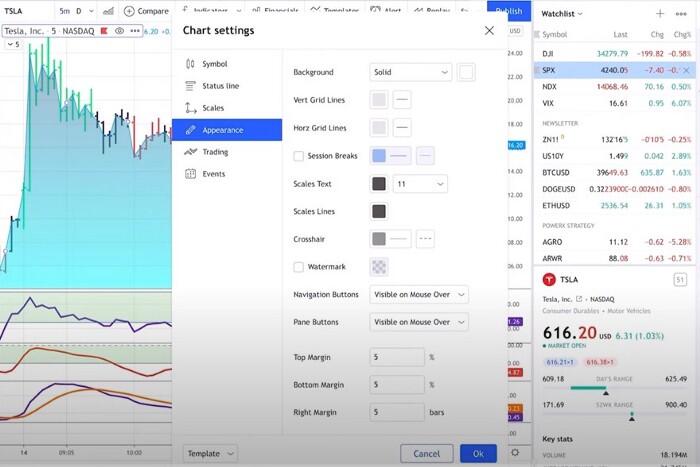
And then there’s one more cool thing under “Appearance.” There, you’ll see that you can mark session breaks. This will be important when you’re not trading on a daily chart when you are taking trading on intraday charts.
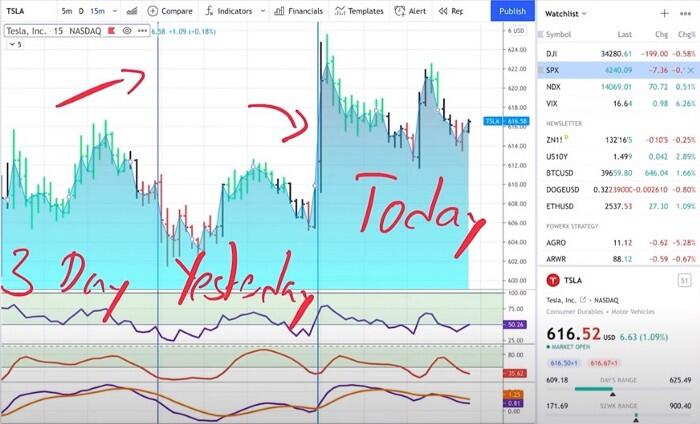
So if you click on “Session Breaks,” enable those, and you switch to a smaller time frame than daily, such as a 15-minute chart, then you will see these horizontal lines and these are the breaks. So you will be able to see which is today’s session, which is yesterday’s trading session, or your session from 3 days ago.
So this is, I think, pretty cool, pretty neat, especially when your day trading so that you see where a session started and ended.
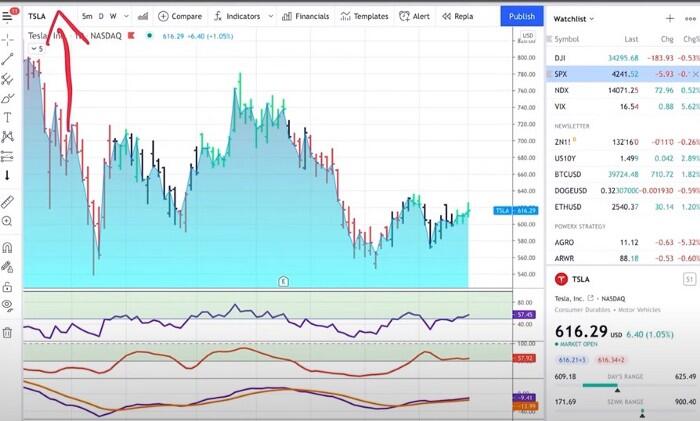
Step number 3. Step 3 is also super easy. It is about the “Cursor Type.”
This is something that you find here in the upper left.
So what I like to use crosshairs.
When using these crosshairs, I find it very easy to see what date I’m on and what price I’m on.
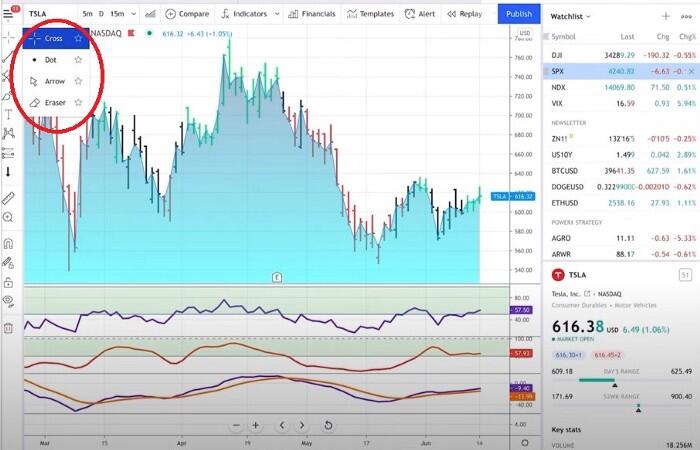
However, this might drive you crazy, and I’ve seen that some traders prefer using here an arrow or a dot so you can very quickly change it to Arrow or I personally prefer the crosshairs.
Step number 4 is about “time frames.”
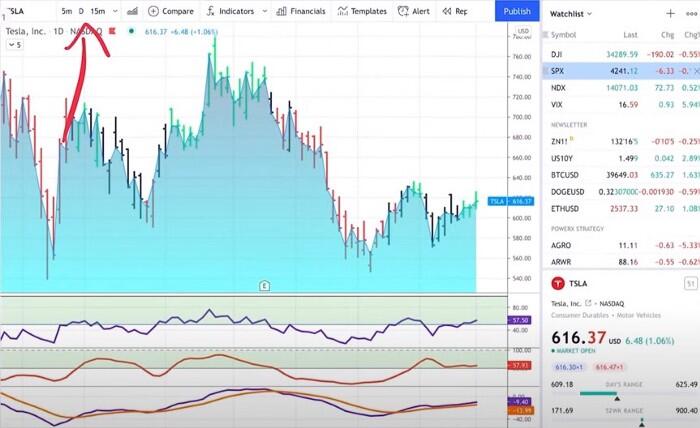
So up at the top, you can select different time frames. So, for example, you can select a five-minute chart, or you can select a daily chart. There’s a lot of time frames that you can choose from, so you should just decide what time frames are most important to you because you can star them as favorites.
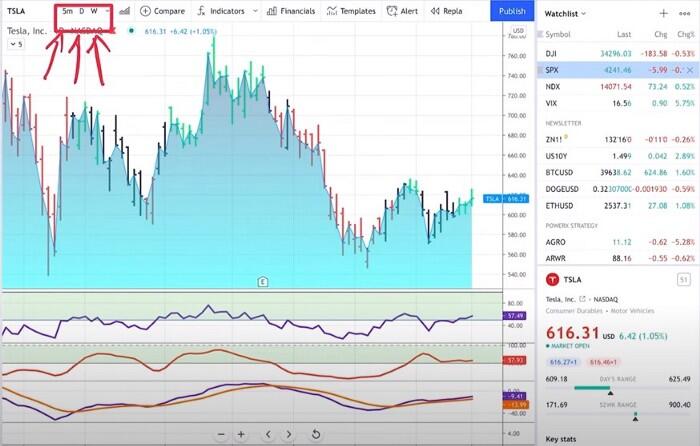
Now, what does this do when you’re starring them as favorites? When you star your favorite time frames, you have super quick access right here at the top.
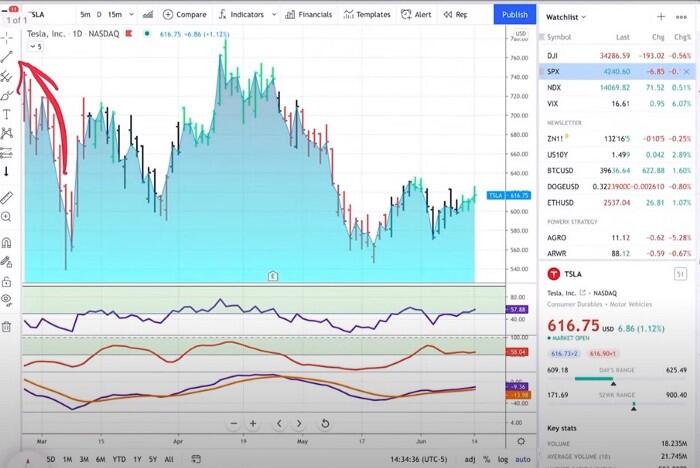
Step number 5 is all about “scrolling.” How do I go back on a chart? Well, if you left-click and hold on to the mouse, then you can just go back in time by scrolling back.
If you use the scroll wheel on your mouse or you use two fingers on your trackpad, you can zoom in and out. So this is also super easy, very intuitive.
Step number 6 is about selecting symbols. Now TradingView is really cool.
So you have that symbol selector in the upper left-hand corner here, but you don’t have to click into this.
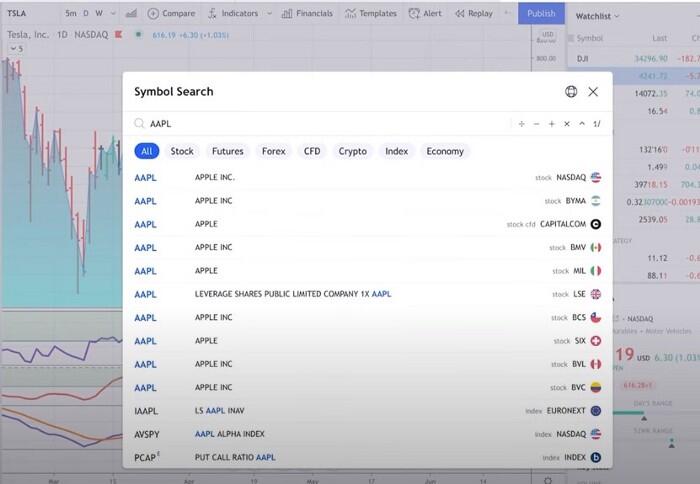
You can just start entering a symbol anywhere on the chart. If you just start typing in AAPL for example, this way you can just click on Apple and it’s right there, or you can simply hit enter.
If you don’t know the symbol name and you just know the company, you can just start typing in the company’s name. Let’s just say you want to look up Biogen Technologies and you do not know the symbol. It has a very powerful symbol search.
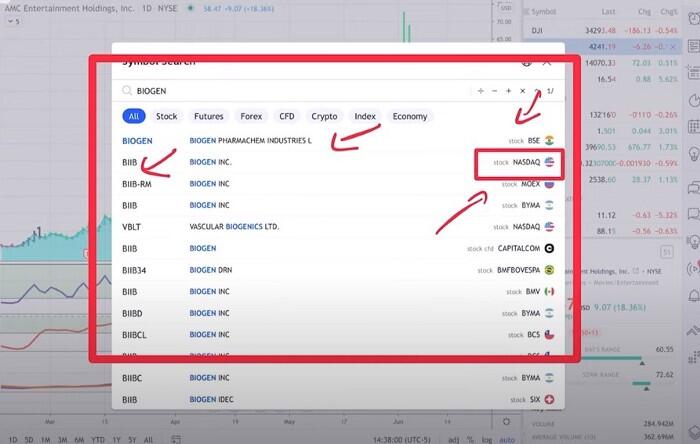
When you enter the symbol, it shows you the BIIB, which is the one here at the Nasdaq. It also shows you a stock that is traded at the Bombay Stock Exchange. But anyhow, this is where you can simply select the one that you want.
So super easy, super simple. You don’t have to go anywhere, and the other thing is that you cannot only look for stocks, but if you are interested in futures you can do this, and you can also look up cryptocurrency, for example.
You can look for whatever cryptocurrency you want. As an example, if you want to see how Dogecoin is doing right now, you simply click on DOGE and the cryptocurrency. so, as you can see, super easy.
I personally like to leave it on “All” because this makes it super easy to find what you need.
Step number 7 is about “Watchlist and the right-hand panel.”
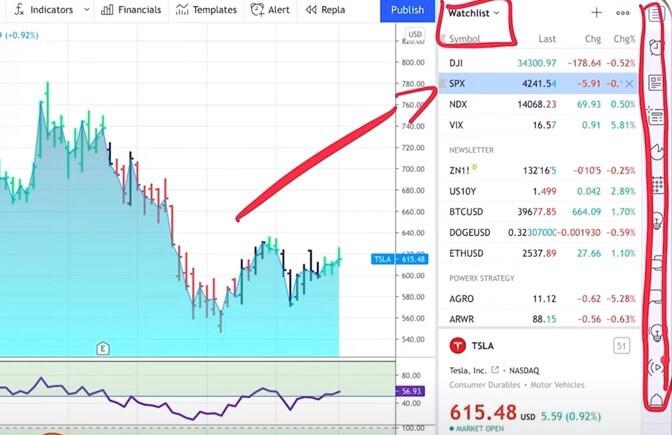
So as you can see on the right-hand side here, you can have a watch list or there’s a bunch of other symbols that are right here. I just want to quickly go through the symbols because some of them might be useful.
The ones that I like to use are, for example, this “hot list.” The hotlist is this symbol right here that looks a little bit like fire. What these hotlists do, is show you the volume gainers for today. So these are the stocks with the highest volume for the day.
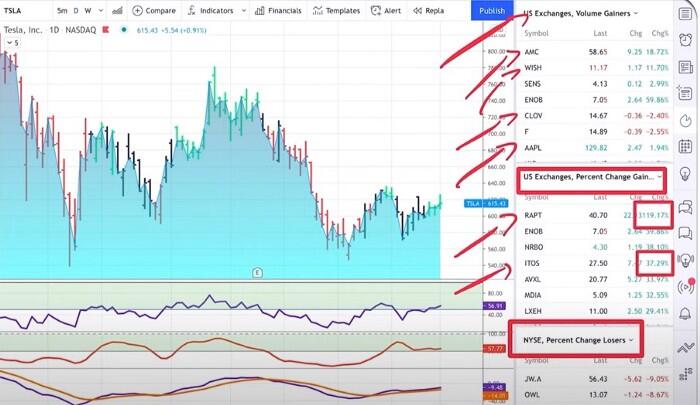
Then you have it here for the percentage gainers. As you see, there is a stock that is up right now, 119 percent, and there’s another stock that is up 37 percent. Then you also have percentage losers below that.
However, the one that I use the most is the “watch list.” And if you’re clicking on the top symbol right here, it is bringing up a watch list. I do have a watch list for the newsletter that I’m doing every day for The PowerX Strategy and also for The Wheel Strategy.
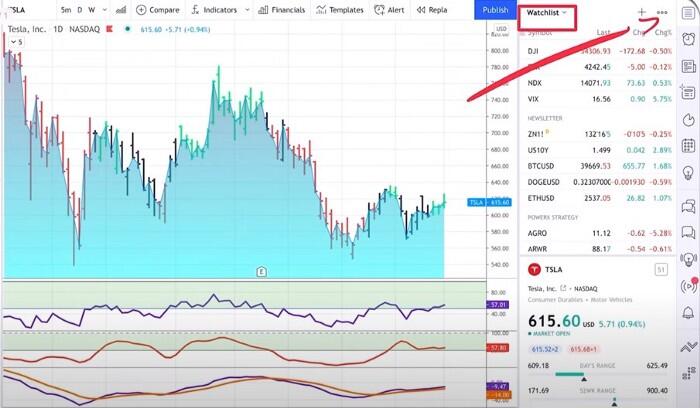
Adding something to the watch list is super easy and super simple.
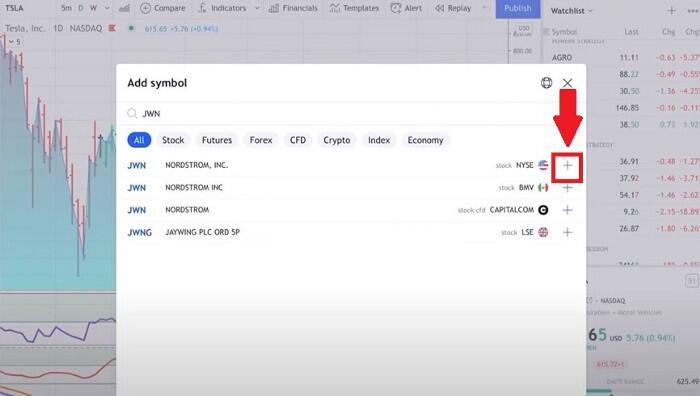
There is a plus in the upper right-hand corner that you can click to enter a symbol. Now, today I entered a trade for JWT, which is Nordström, so I want to make sure that I have this on my watch list. So I’m adding it.
What it does, it adds it automatically at the very, very end of the watch list and here now I can move it manually by dragging and dropping it to The Wheel Strategy watchlist because this has been a trade according to The Wheel strategy.
So let me do this really quick. All I need to do is and click on it, hold it, and then I can move it up right here. So as you can see, super easy, super simple. If you want, you can have certain advanced views. You can import and export the list. For me, that’s all I need to do here with the watch list.
I highly recommend that you have the watch list because that makes it very easy to check your positions for today, for example, to see how my PowerX positions are doing here today.
Step number 8 of 10 on how you become a pro, is about “drawing tools.”
The drawing tools are here on the left-hand side, and these drawing tools are super powerful. And I want to show you the ones that I like the most.
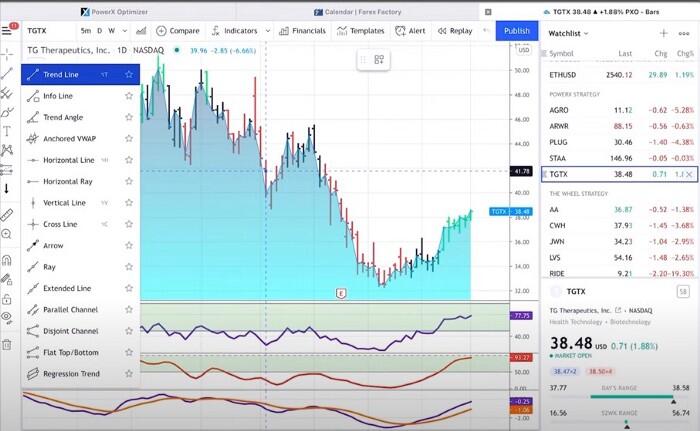
You can explore all of the drawing tools, but the ones that I like the most are trend lines and support and resistance lines.
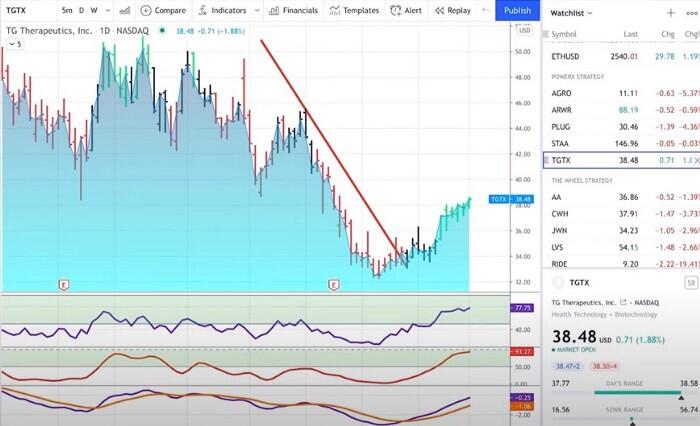
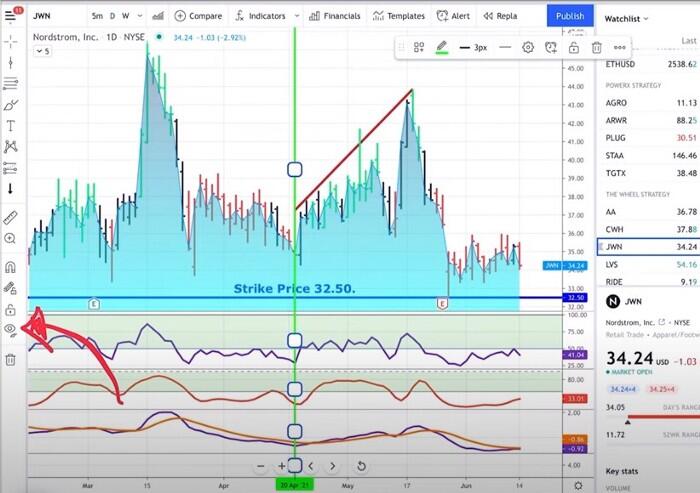
So let me just show you, you can, for example, select a trend line here and then very easy and very quickly draw a trend line wherever you think the trend is.
Pretty cool. Now, let me just show you something really, really cool that applies to all drawing tools.
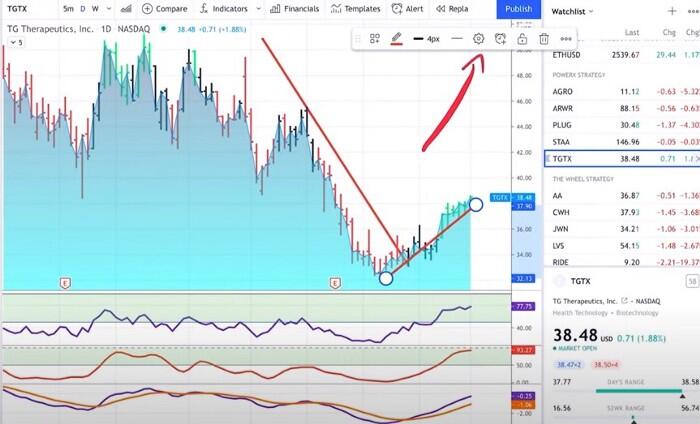
If you’re clicking on the settings right here, whenever you have a drawing tool in use, there’s a little settings button coming up. When you do this, you can customize the drawing tool here. Do you want the line to be red or blue?
You can also define how big this line is supposed to be. Now, I always like to have really big and bold trend lines here so that I can easily see them.
Now, once you have customized it, it’ll remember it forever. I want to show you the second trend line that I like to see, which is a horizontal line.
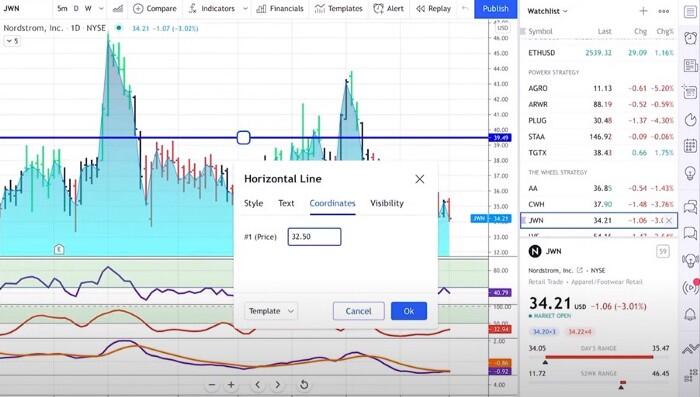
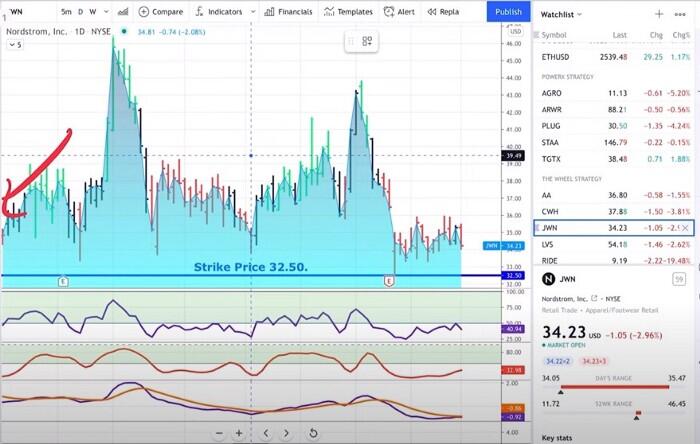
So I like to really plot horizontal lines here on my chart. This really gives me support and resistance. Now, you can try to really hit exactly where you want to plot it or even cooler. You can just double-click on it or go to the properties and type in the coordinates where you want to have it.
For example, for JWN this morning, I sold a put with a strike price of 32.50. So I enter 32.50 and the trend line automatically jumps down to this point.
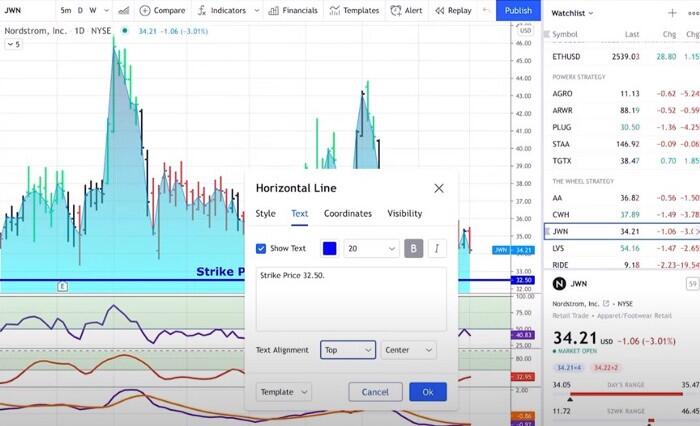
Now, I also like to have a text on my trend line here, so that I know what I did. This is where I simply say that I sold the strike price of 32.50. All of this is super customizable.
So you can have the text alignment at the bottom or you could say you want to have this in the center, in the middle, or on top. These are the main lines that I use.
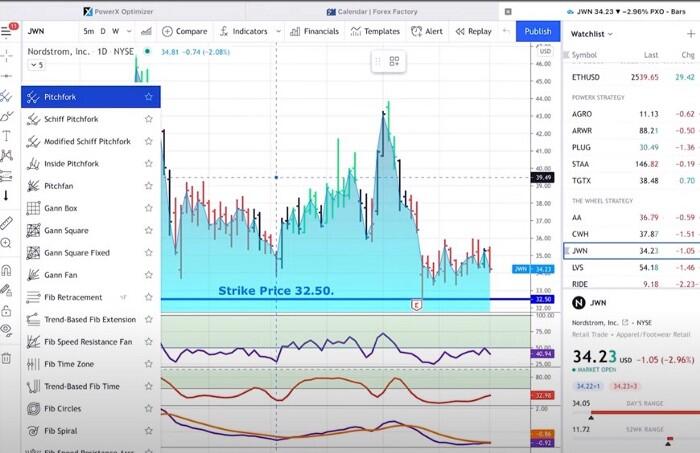
There’s, of course, you can use here Pitchfork’s Gann boxes, pitch fans, Fibonacci Retracements, so if you like the idea of Fibonacci Retracements, you can draw those on the chart anywhere you want. I’m not the biggest fan. I don’t know exactly how to use them and that is OK.
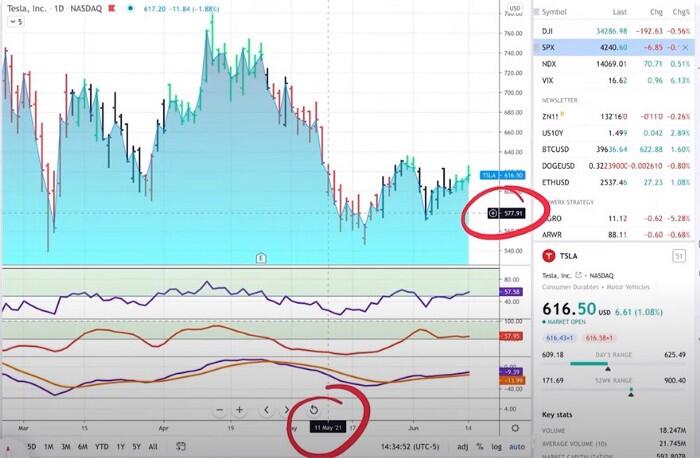
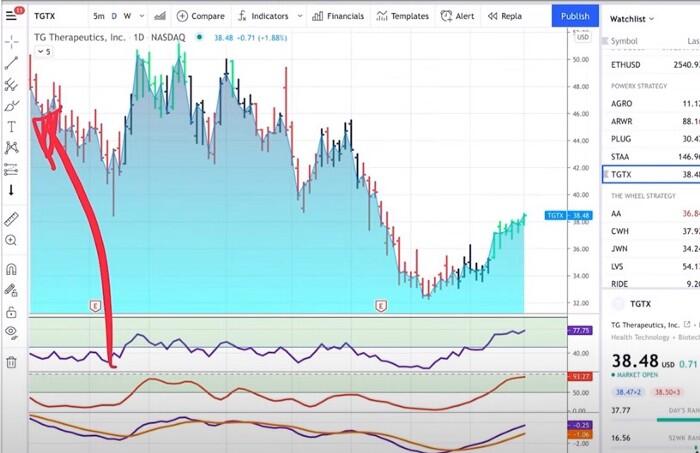
But as you can see, there are lots and lots and lots of tools that are available. Now one of the tools that I really like is this ruler here.
So this ruler actually shows you how big of a drop a stock has made. Let me show you how to use it. When you’re clicking on the ruler, all you need to do is define a starting point, and then you find an endpoint.
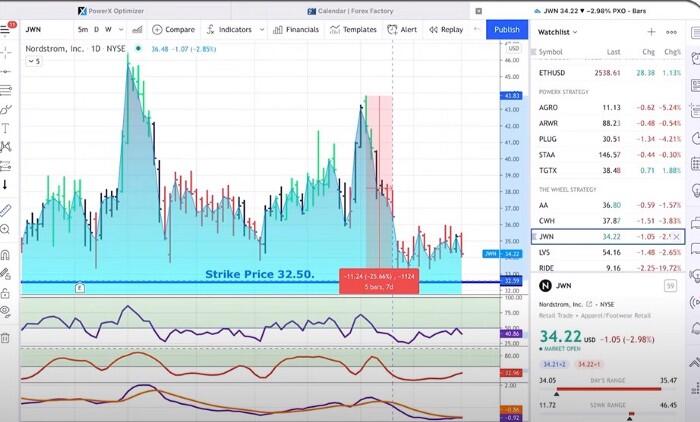
For example, this one here has been a drop of 25 percent and it lasted five bars and five bars in this case would be 7 calendar days. So this is something that I’ll use often to see how much do the stock price rise, or how much did it go down.
So that’s a tool that I really like to use. Now, let me just show you one last thing. If you have drawn a lot of trend lines, and now my chart is all cluttered.
You will see that on the left-hand side, there’s a little eye. What this does, is it hides all of this stuff that you draw on the chart. So when you click it, all of the drawings will be hidden.
Now, with this eye, when you’re clicking it, then as you can see now it’s active. When you click it again, it all comes back. The final thing regarding drawing tools, if, for example, you don’t want to see those in the smaller time frame, you can say that this trend line, for example, only applies to a daily chart.
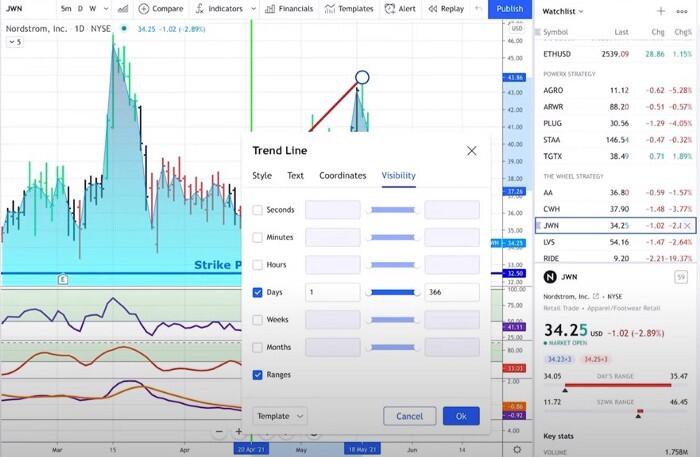
So, therefore, I don’t want to see it on a second chart, a minute chart, an hours chart, a weekly chart, a monthly chart, or on ranges. So you can only say that this way you will only see it on a daily chart. So that is pretty cool if you’re toggling between different time frames here.
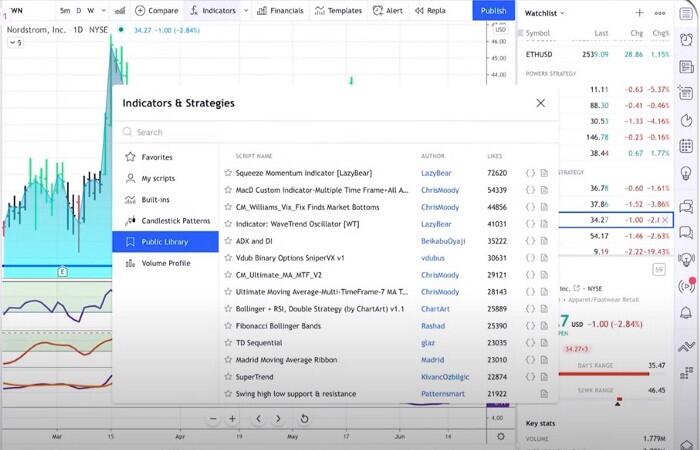
Step number 9 is all about indicators. Now, I love using “indicators.”
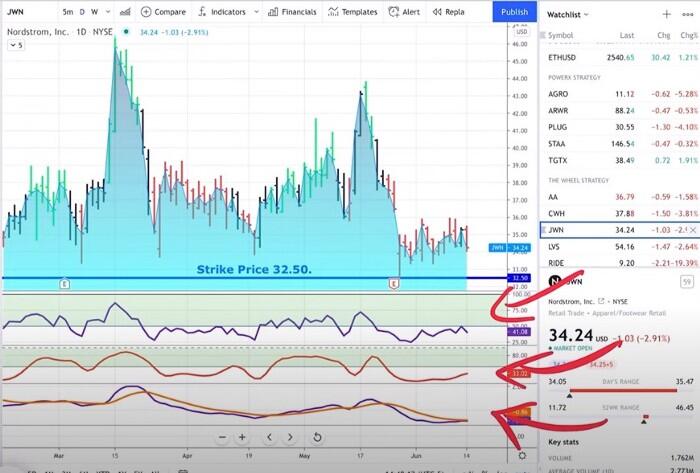
As you can see at the bottom here, I have three different indicators. It is the RSI, Stochastics, and MACD.
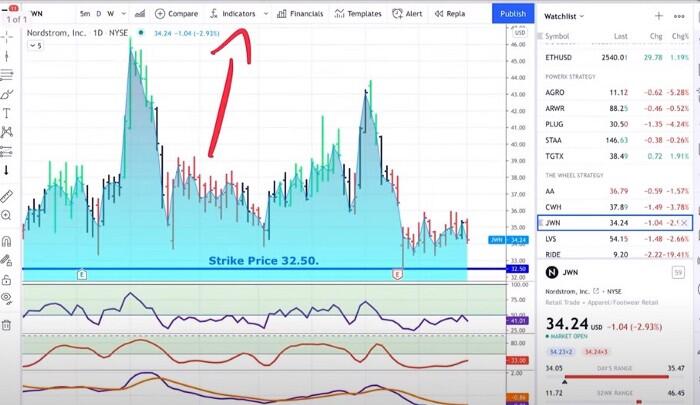
So I’ll point you there in the right direction if you want to bring up any indicators and if you like indicators as I do, you see that there is actually this little F X and it says “indicators” and you can simply click on this.
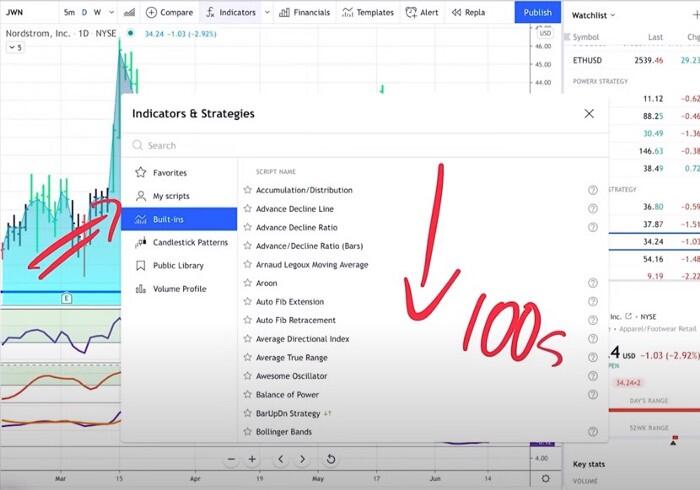
When you do, you will see that, first of all, there’s a ton of indicators built-in. These are hundreds of indicators that are built-in, and you can very simply look for the indicators that you want to bring up.
For example, let’s say you want to bring up the Bollinger Bands. Just type in “Bollinger Bands” I’m adding them to the chart now very easily by clicking it.
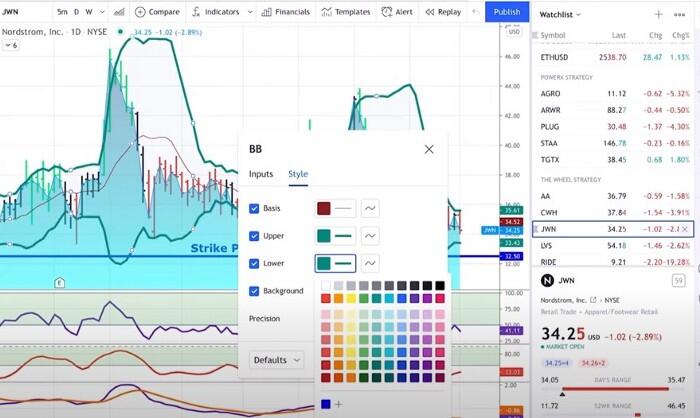
Also, you can adjust the ball into bands with the settings. So instead of using a time frame length of 20, you can use 12 and 2 for example, and you can adjust the style in the same way as you saw it previously. You can adjust the basis, or make the bands thicker or slimmer.
You can very easily customize it, as you can see fit. Now, also, it’s super easy for others to build indicators and to share them with you.
You will see if you click on indicators that there is a public library of a bunch of indicators that others build for you. All of these are they are sorted by likes so you can like an indicator.
So again, you have the standard indicators and then you have indicators that are built by other users, and you can very easily customize these indicators.
Step number 10 is another function that I use a lot, and these are “alerts” so you can set an alert for any symbol you want. This is very powerful.
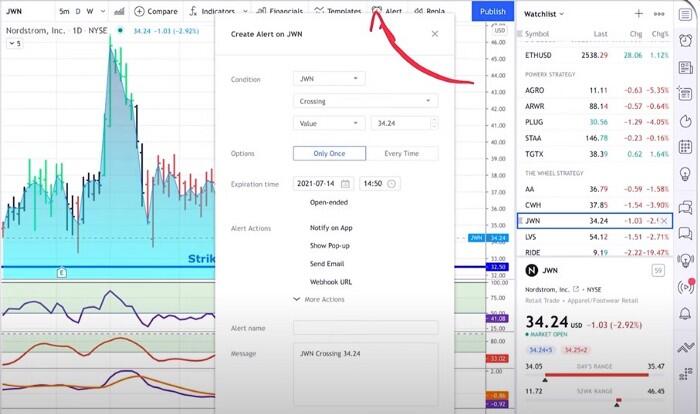
All you need to do is you click “ALERTS” at the top right. this is where you decide what conditions a stock, for this example we’re looking at Nordström JWN, crossing a certain value.
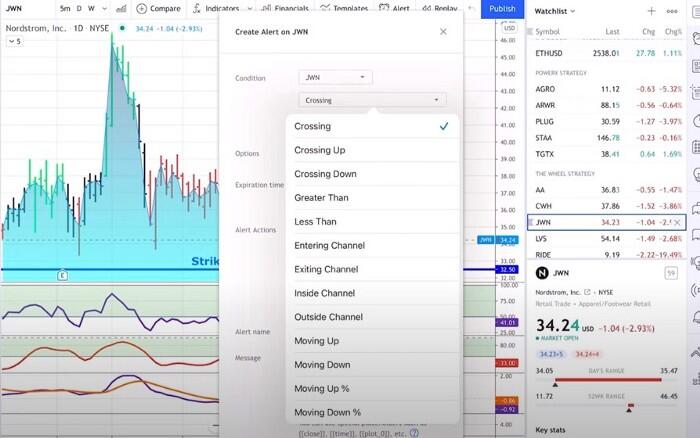
You can, for example, select between crossing, crossing up, crossing down, rated and entering a channel, exiting a channel, is inside a channel, or outside of a channel. So you see there’s a lot of possibilities here.
Instead of just going for a value, you can also go for an indicator. So, for example, if it crosses above a 5-day moving average, or if it closes outside the Bollinger Bands, then you want to have an alarm.
Now, for me personally, this is super powerful, especially for The PowerX Strategy. This is where PowerX Optimizer, the tool that I use tells you when you should enter, so I always say when it is crossing a certain value.
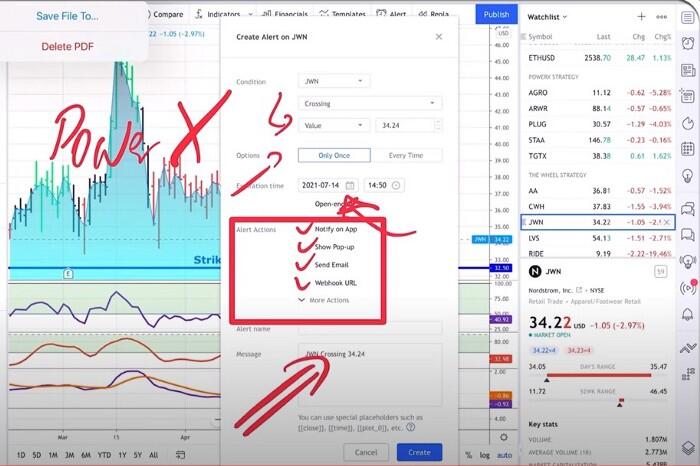
Now you can say should it just beep only once the first time it does it or should do it all the time? I only do it once, and for the expiration date, I usually set it by the end of the day because I’m not interested if it doesn’t tomorrow or the day after. So all I like to do here is to basically do it for today.
You see that there are alerts, actions you can notify on the app, show pop-up, send an email, do some sort of webhook URL, which I do not know what that is and it doesn’t really matter, and you can type in any message you want.
So for example, you could say when “crossing above 34.24,” OK, and then you could say “buy call option” and you can set the alert.
So super easy. Super simple. This is in a nutshell. Now you are a pro when it comes to using TradingView because honestly, this is all you need to play around with it. You will see its super-powerful software. If you’re new to this, I hope it helps.
Author

Markus Heitkoetter
Rockwell Trading
As founder and CEO of Rockwell Trading Services LLC., Markus Heitkoetter has shared his trading methods and ideas with more than 300,000 traders in over 196 countries.


