Here’s how the pop ‘n’ stop trading strategy works in Forex

Breakouts can generate high returns in Forex trading. It's no secret. Common as they are in the Forex market, though, they're difficult to forecast. Bull and bear traps frequently place traders on the wrong side of the market, leading to frustration and loss. Fortunately, techniques designed to help filter these breakout moves are available.
Breakouts
Currency markets consolidate and trend. Some analysts claim trends form between 20 to 30% of the time, with the remainder producing consolidations. To knowledge, no one has demonstrated the validity of this percentage.
When traders refer to trends, they're describing a directional trend, one of rising or falling price movement. Trading ranges, however, form when peaks/troughs group at equivalent price levels. The configuration can form at the beginning, mid-way through and at the end of trends. A trading range is also referred to as a congestion area or neutral zone. Trends and consolidations are also fractal in nature. Intraday price movement behaves similar to longer-term action, and vice versa.
Used as a basis to assess breakouts, several Forex chart patterns exist. These are generally labelled as continuation and reversal formations.
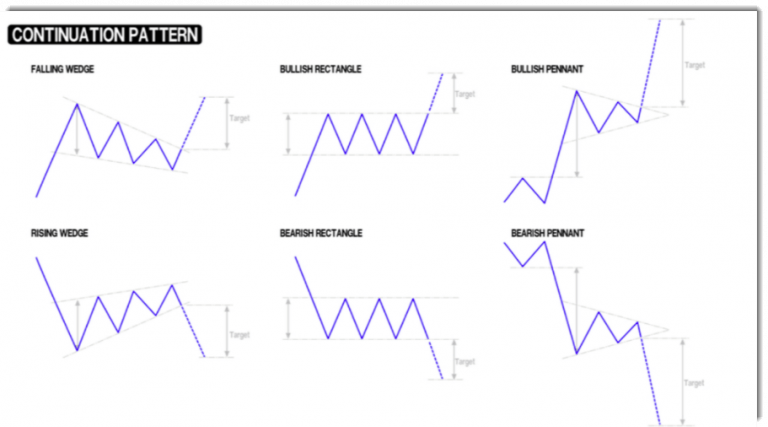
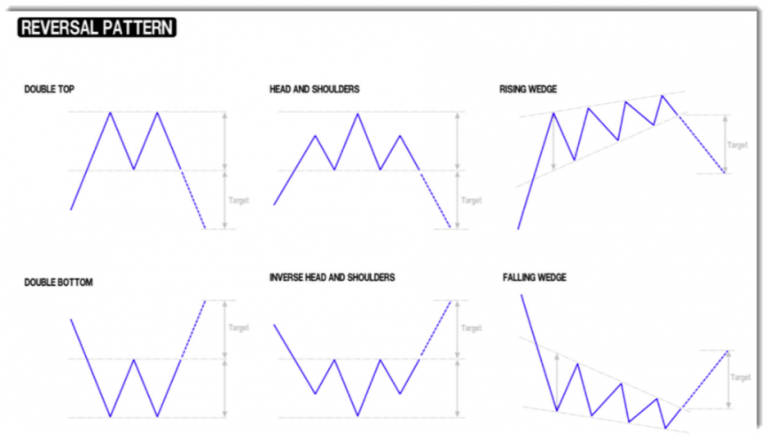
Double tops and bottom patterns are common in the Forex market. So are channels, either ascending channels, descending channels or horizontal channels. Other popular consolidation patterns are rising and falling wedges, bullish and bearish pennants as well as head and shoulder's (H&S) top and bottom configurations.
Range Trading
Although many within the field of technical analysis suggest range trading as a strategy, it's often difficult to pull off in live markets. It's tough to recognise a range until sufficient time passes, increasing the odds a breakout may occur. Additionally, fakeouts, or bull/bear traps, are common within ranging environments. These often whipsaw traders out of positions. This applies to short-term day trading, scalping, swing trading and position trading. As a result, most traders tend to avoid engaging within a congestion zone, and focus on the inevitable breakout and beginning of a trend. This is not to say successful range trading cannot be achieved. It can. Often though, it is within larger consolidations (rather than narrow trading ranges) that offer greater trading opportunity and more appealing risk/reward to the opposing range limit.
Breakout Trading
Breakout trading is lucrative, if on the right side of the market. A number of filters (breakout strategies) are in place to confirm the validity of a breakout. The close filter is popular – it involves waiting for a price close outside of the trading range. Some traders prefer a time filter. Rather than looking at price action, this method looks at time since penetration. Volume is another way to confirm a breakout, though difficult in the spot Forex market as its decentralised. In this case you'd have to rely on broker volume. Other traders look at closing prices beyond a moving average. Another method is the Pop and Stop trading strategy.
The Pop ‘n' Stop Trade
Price ‘pops' beyond a trading range limit – in the case of a Pop ‘n' Stop trade, a resistance level – and pauses, ‘stops', before resuming in the direction of the initial breakout.
At the point price movement pauses, traders seek candlestick signals that suggest continued direction. Most Forex traders rely on Japanese bullish candlestick signals, positioning buy-stop orders 1-2 points above the candlestick signals while positioning protective stop-loss orders beneath the formation. Of course, though, stop-loss order placement is trader dependent.
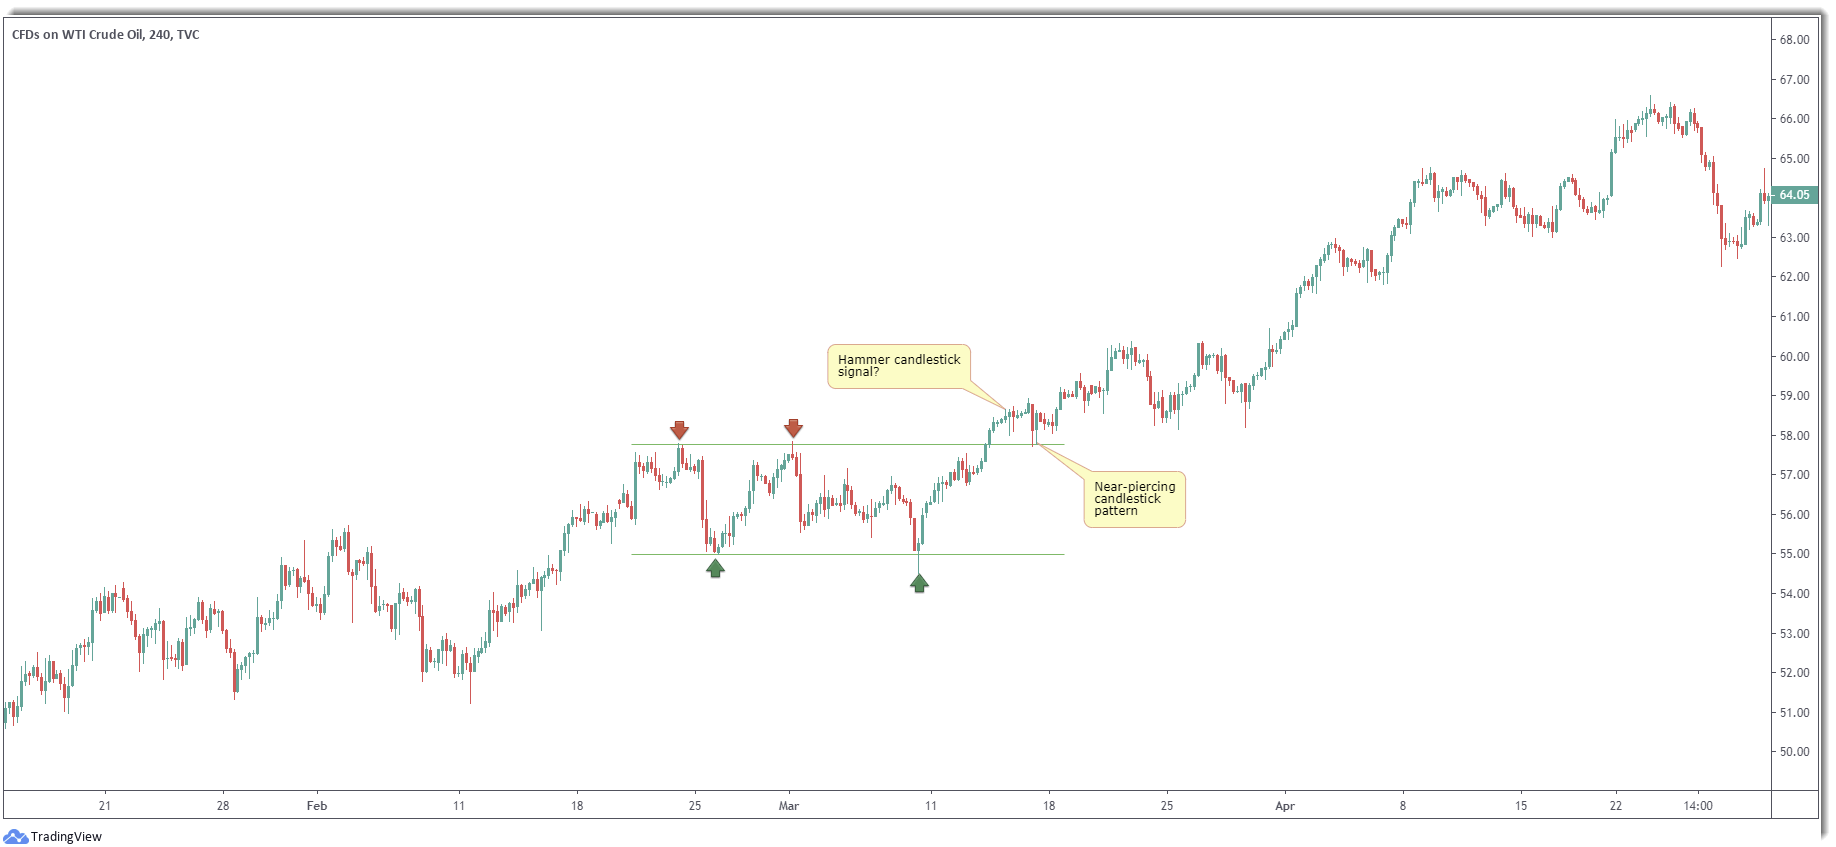
Figure 1.A illustrates a common horizontal trading channel on the H4 WTI Crude Oil price chart – peaks and troughs are almost at the same point. Once price closes outside of the congestion area, the ‘pop', movement pauses, the 'stop'. Shortly after the breakout, price chalked up a hammer candlestick pattern. While this pattern must form at troughs to be considered a bullish signal (some may feel it's simply a hanging man candlestick pattern [bearish]), many will note the fact back-to-back buying tails printed might be sufficient enough to glean interest. Price then chalked up a retracement and shaped a piercing candlestick pattern. For it to be a true piercing pattern, the second candle would have to open beneath the prior close. but considering the signal retested the top edge of the range, resistance-turned support, this may have been sufficient for most traders. The point here is you're looking for signs of bullish intent at the pause/stop. Entry above the candlestick patterns through a buy-stop order is, as underlined above, a common entry point, with protective stop-loss orders sited beneath the candle pattern's framework. Some, however, may choose more of a conservative route. Beneath the upper limit of the breached range, as price does not always retest the upper boundary as support prior to resuming upside, is popular.
The Drop ‘n' Stop Trade
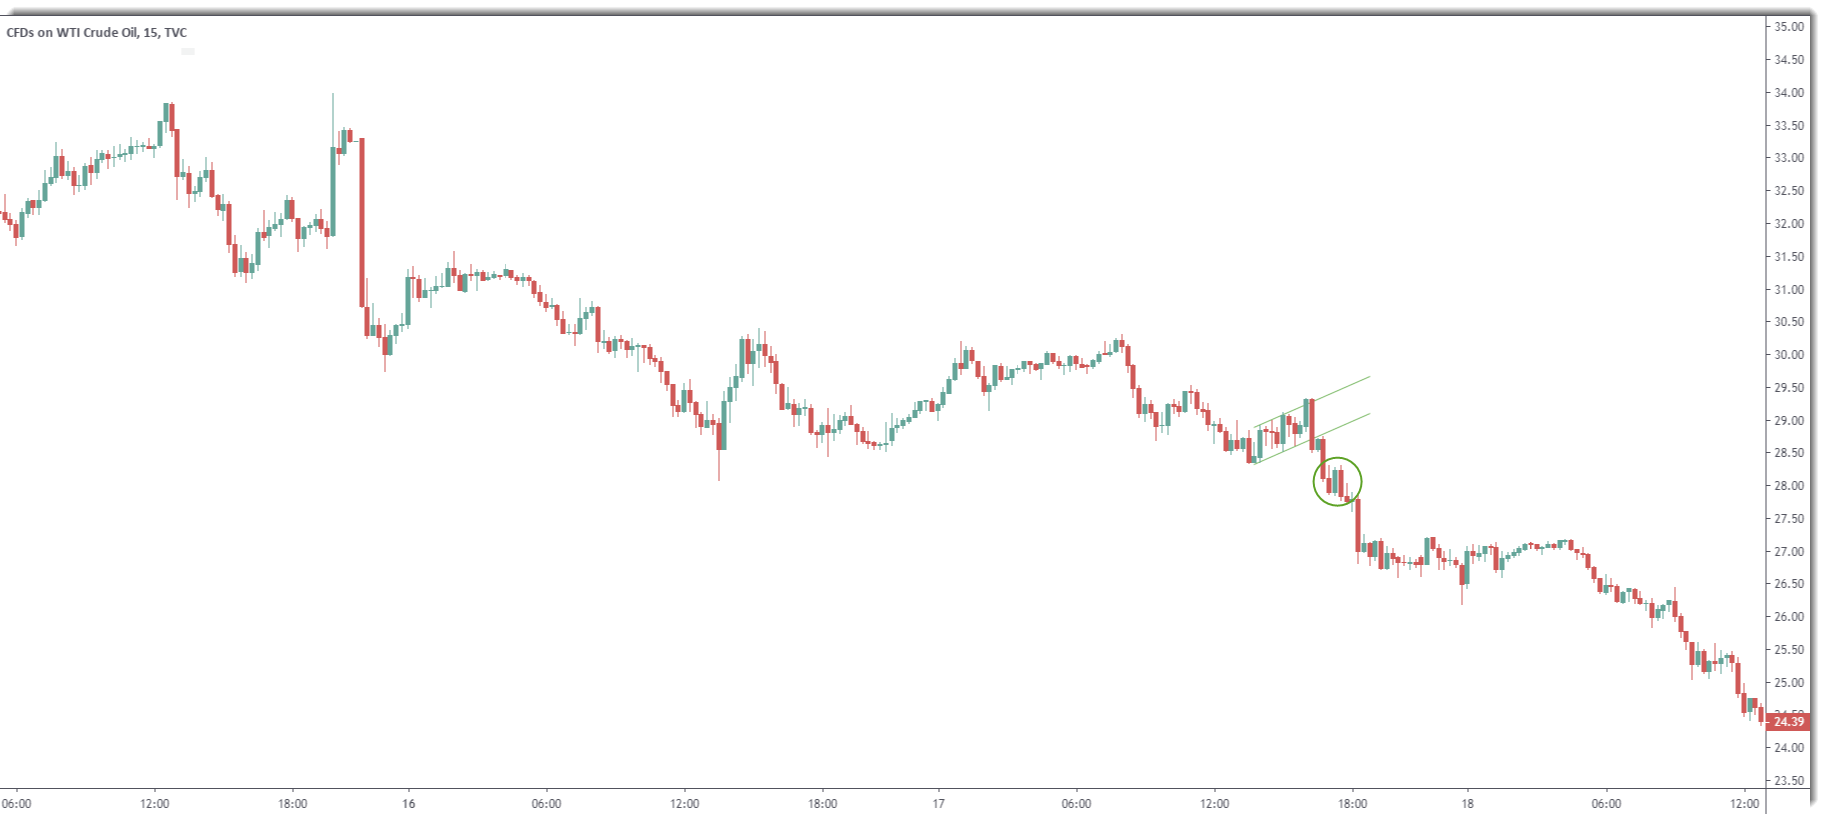
The opposite of the Pop ‘n' Stop is the Drop ‘n' Stop Trade, employed to take advantage of breakouts to the downside. Both strategies are common within liquid trading sessions, such as London and the US (New York), particularly the overlap. Like the Pop ‘n' Stop, a Drop ‘n' Stop occurs when a currency pair declines from a consolidation and pauses before moving in a clear direction. Figure 1.B, the M15 price chart of WTI Crude Oil, reveals an example of an intraday M15 bearish flag pattern, a tight range generally viewed by many as a continuation signal. Following the breakout to the downside, a brief pause is immediately observed with another shortly after that. It is here traders seek entry, in this case by way of a bearish outside formation whereby the high/lows of the second candle engulfs that of the initial upside attempt (green circle). Entry on a sell-stop order was quickly filled; traders who plotted protective stop-loss levels according to the bearish pattern (a few points above the high of the structure) achieved lucrative risk/reward. Even those who positioned protective stop-loss orders above the bearish flag pattern's upper limit still realised an attractive risk/reward ratio.
Back Testing – Experimentation
Pop ‘n' Stop is a simple and effective breakout forex strategy (trading system), provided risk management and money-management principles are adhered to. Experimenting which approach fits your trading style is important; this is achieved through a back-testing trading platform, and demo trading account. It's an essential step before integrating any trading strategy into the live market. Although rejection bars/candles are favoured concerning entry at the stop, traders are free to experiment. Some prefer using Bollinger Bands and waiting for a close outside of the upper limit following the Pop ‘n' Stop. This includes a volatility factor. Others favour trendline breakouts, round numbers and Fibonacci pivots as additional confirmation. Another consideration is trading volume. Breakouts are generally more successful during London and US sessions, with the Asian segment typically pencilling in congestion areas. Do also take into account congestion areas form in a number of different chart patterns, not just the traditional horizontal channel, as demonstrated in figure 1.A. Traders are urged to research which consolidation pattern fits their trading style. For example, some prefer bullish and bearish flag patterns, as in figure 1.B, due to their simplistic nature; others favour head and shoulder's patterns – probably the most famous technical chart formation to grace the charts.
Author

FP Markets Team
FP Markets