Forex strategy: How to use fibonacci retracement and extension

Fibonacci numbers, when applied in technical analysis through Fibonacci retracement and Fibonacci extension, are one of the most prolific techniques traders use to qualify or disqualify forex trades. In this article, we’ll look at how both retracement and extension work, and how you can use them in your own trading.
Fibonacci retracement
Fibonacci retracement is typically used to enter trades. By analysing the highs and lows of previous market moves, traders can predict how far a price might retrace the given move.
The idea is that during a new trend direction, a price will retrace back to a previous price level before resuming in the direction of its trend.
Fibonacci retracement has potential levels where a price can reverse from. The retracement levels are 23.6%, 38.2%, 61.8%, and 78.6%. Although not officially a Fibonacci ratio, 50% is also used. These percentages indicate how much of a prior move the price has retraced.
Using Fibonacci retracements - During an uptrend
To measure the Fibonacci retracement during an uptrend:
- Find a Swing Low point
- Find a Swing High point
Use the Fibonacci tool to draw the retracement from the Swing Low to the Swing High.
For example, this is the 4-hour chart for EUR/USD on April 12.
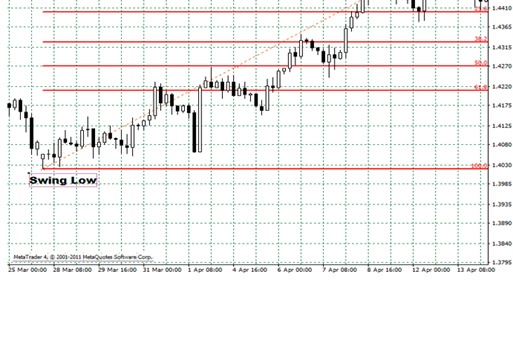
In the chart above, the Fibonacci retracement levels are plotted using the Swing Low at 1.4020 on March 27 and the Swing High at 1.4520 on April 12. The retracement levels are 1.4402 (23.6%), 1.4329 (38.2%), 1.4270 (50%), and 1.4211 (61.8%).
In the example above, the EUR/USD enjoyed a bullish trend before it began to retrace and move lower after reaching the high at 1.4520. With retracement during an uptrend, the expectation is that if EUR/USD retraces from this recent high at 1.4520, it will find support at one of the Fibonacci retracement levels where it will reverse up from.
Let’s look at what happened after the Swing High occurred on April 12. The following chart shows what happened to the EUR/USD chart up to April 19.
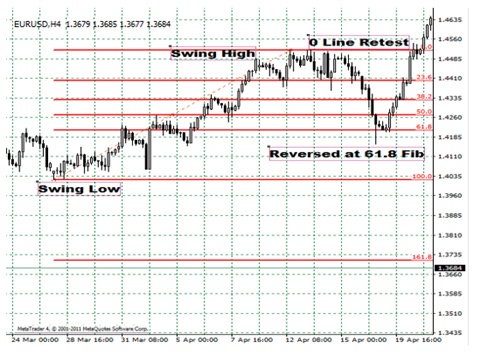
The price broke through the 23.6% level and carried on to the 38.2% and 50% levels. The price even got to the 61.8% level although it did not quite manage to break it. The price found support at 61.8% and buying at this Fibonacci level would have been a profitable long-term trade.
Takeaway: Retracements can be used to identify potential support levels. During an uptrend, the general rule is to buy on a retracement at a Fibonacci support level.
During a downtrend
Continuing with the above example, on April 21, the EUR/USD continued past its former Swing High and reached a new high at 1.4648. However, the same day the EUR/USD had a big move up, the USD/CHF had a big move down.
To measure the Fibonacci retracement during a downtrend, you do the opposite of what you do during an uptrend.
- find a Swing High point
- find a Swing Low point
- draw the retracement from the Swing High to the Swing Low
The following is a 4-hour chart of USD/CHF on April 21 showing the Fibonacci retracement during a downtrend.
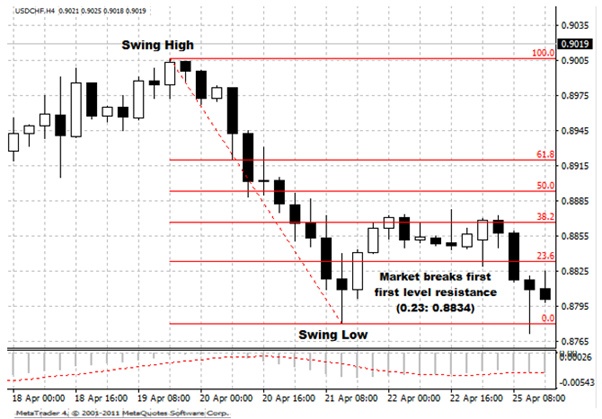
The Swing High is at 0.9008 on April 19 and the Swing Low is at 0.8780 on April 21. The retracement levels are 0.8834 (23.6%), 0.8866 (38.2%), 0.8894 (50%), and 0.8920 (61.8%).
The expectation during a downtrend is that if the price retraces from its Swing Low, it could possibly encounter resistance at one of the Fibonacci levels as traders are waiting to sell at these levels.
In the above example, the price broke through the 23.6% level with a bullish candlestick and even managed to get to the 38.2% level, although barely. If a trader had some orders at either of the two levels, they may have made some pips on the trade.
Takeaway: Retracements can be used to identify potential resistance levels. During a downtrend, the general rule is to sell on a retracement at a Fibonacci resistance level.
Fibonacci extension
While Fibonacci retracement identifies levels that prices will retrace to, Fibonacci extension projects the direction of the move a price is likely to make in future. Traders typically use Fibonacci extensions to project good take-profit levels. Common Fibonacci extension levels are 61.8%, 100%, 161.8%, 200%, and 261.8%
In the previous example of the EUR/USD, the price passed the previous Swing High and made a new high at 1.4648. But what if the new Swing High gives way? Where to take profit becomes the big question.
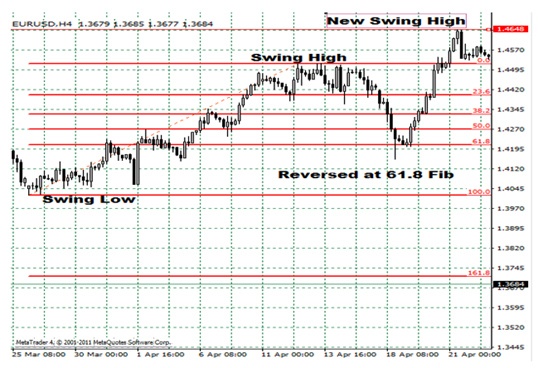
If we use the Fibonacci extension tool, we can see the levels that would have been good to take a profit. Using the EUR/USD example, we measure from the Low Swing to the High Swing then also to the retracement level.
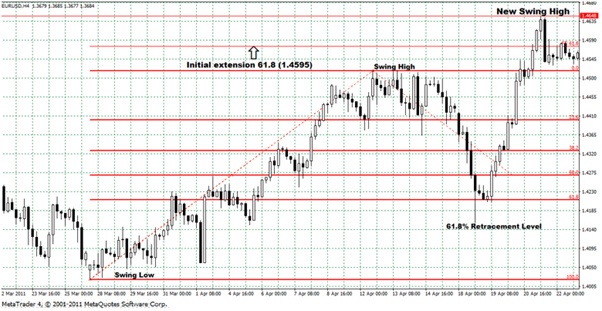
The extension tool creates a Fibonacci projection in the direction of the swing, marking potential take-profit levels. In the example above, we can see that although the market made a brief high at 1.4648, it turned out that the initial extension level at 61.8% would have been the best level to take profit.
Getting started with Fibonacci retracement and extension
The Fibonacci tool is just a tool and using it won’t magically make you a good trader if you aren’t already one. You have to know how to use retracement and extension levels in combination with other tools to help you make good trades.
In addition to the knowledge you also need to remember that:
The Fibonacci tool works best with obvious price moves. Don’t force trends where there are none and if you have to ask if there’s a trend, there probably isn’t.
Retracement and extension levels signal areas where a price can potentially find support and resistance but they shouldn’t be relied on exclusively.
Your choice of trading platform matters. For example, the MT4 trading platform is considered by many as the best trading platform for forex because it was specifically built for forex traders. The right platform will simplify your ability to use retracement and extension levels.
Once you start combining Fibonacci levels, price action analysis, and other indicators with discipline and practice, you may start creating some profitable trading opportunities.
Author

FP Markets Team
FP Markets


