Every technical trader heard of the Fibonacci numbers. In a way, it is impossible not to. The most famous trading theories use these ratios.
Before the personal computer (PC), technical traders tracked the movement of a security on a piece of paper. Even then, the Fibonacci levels played an important role.
Today, any trading platform offers a special Fibonacci tool. There are multiple, separate Fibonacci tools to use, like Fibonacci retracement, expansion, arcs, fan, time zones, and so on.
In fact, for trading purposes, it depends very much what your technical setup is. Some may use the Fibonacci retracement only, others will base their entries on the time zones, and so on.

No matter the trading theory, the Fibonacci sequence is the same. Out of the tools mentioned above, the Fibonacci retracement and Fibonacci expansion levels are the most popular ones.
Traders use technical analysis tools to find out places to buy or sell a currency pair. The more visible the setup is, the more likely traders will use it again. Either on a different currency pair or on a different time frame.
However, diversification matters too. For example, if you open a chart and draw ten different Fibonacci retracement tools on the screen, the result is worthless.
The idea is to combine the strength of the Fibonacci ratios with other technical analysis tools. Or, with other trading theories. Or, both! The more reasons or arguments for a trade.
The Most Important Fibonacci Levels
It all starts with the golden ratio. That's the 61.8% retracement level. Any move, swing or dip, will see some "unusual" activity around the 61.8% level.
Just look at any currency pair you want. Pick one from the Forex dashboard. Next, drag the Fibonacci retracement. Finally, find the 61.8% level.
If the market can retrace to it, it will have a hard time to break it from the first time. Everyone using Fibonacci's focuses on the 61.8% level.
Elliott Waves traders use the golden ratio to hunt the most powerful wave in an impulsive move. The 3rd wave.
For this, they wait for a five-wave structure to complete. Furthermore, they wait for a pullback in the 61.8% area and then enter a trade.

As a target, they use the Fibonacci extension of 161.8% of the previous five-wave structure. Again,without Fibonacci levels, technical analysis would not exist.
In the chart above, because of it refers to current levels, the USDJPY bounced right from the 61.8% area. Again, bulls respected the golden ratio.
The first assumption is that the 3rd wave in an impulsive move will follow. Because traders don't know for a fact if the 2nd wave ended here, they look for the possibility of the 2nd wave to form a running correction.
Only when the price moves much higher and the structure unveils, they'll know the correct count. Yet, the golden ratio gave a nice bounce for the short to medium-term traders.Besides the golden ratio and its derived levels, other levels have important meanings in different trading theories:
-
6%, 38.2%, 123.6%, 138.2%, 161.8% and 261.8% in Elliott Waves Theory;
-
2% and 78.6% in harmonic trading.
How to Draw the Fibonacci Retracement Tool
One of the major problems traders face is not knowing how to drag the Fibonacci retracement tool. This matters, because:
Important: The main use of a Fibonacci level is to find important support and resistance levels.
The key comes from the technical approach used. Look at the previous chart. The Fibonacci tool isn't dragged from top to bottom. Yet, the 61.8% area proves to be correct. How come?
The answer comes from the Elliott Waves Theory rules: drag the Fibonacci tool from the start of a move until its end.
However, there's a catch. The end of a wave is not always its lowest or highest point. Hence, the derived Fibonacci levels differ.
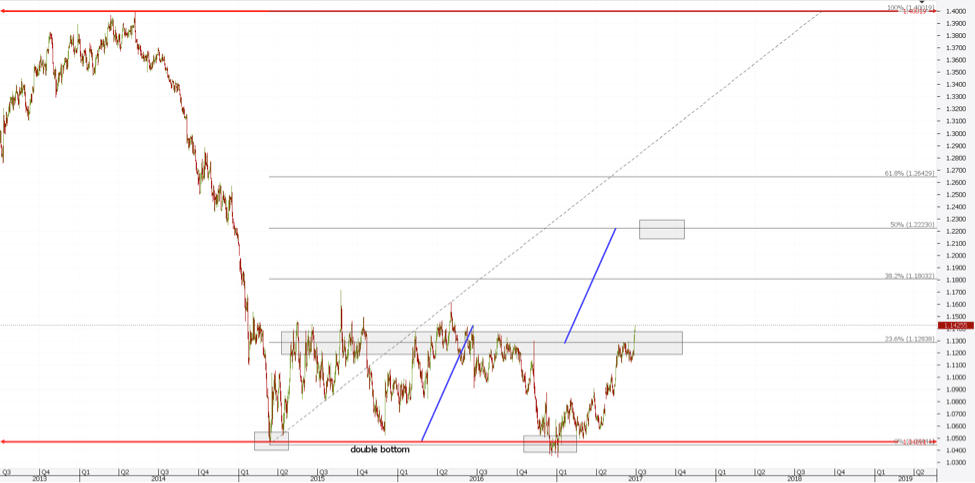
A similar example comes from the EURUSD daily chart. Note that this chart is zoomed out, so the actual time frame is even bigger.
The drop you see on the left side of it started from the 1.40 level. The ECB (European Central Bank) just announced it will cut rates to fight inflation.
As such, Euro bears sold the common currency in a frenzy. For whatever the reason, after an almost four-thousand pip fall, the pair bounced.
How do we know the bounce is for real? It reached the 23.6% level. And, it was rejected.
This validates the way to drag the Fibonacci tool. However, after the first rejection, the price tried again for the 23.6% level.
As a rule of thumb, the more it tests it, the bigger the chances it will break it.
Side Note: Don't use any level more than two times for a trade in the same direction.
Next, traders focus on finding other clues to help with the new direction. In this case, the EURUSD formed a possible double bottom and now broke the 23.6% retracement level.
Look for Confluence Areas
In the previous chart, the double bottom's measured move points to the 50% retracement level. Obviously, until then, the 38.2% may act the same way the 23.6% did.
A confluence area has two meanings. One is to look for different Fibonacci levels to form around the same place. Everyone knows that.
However, another one is to look for different currency pair to point to the same scenario/direction. In doing that, traders favour alternation between the confirmation factors.

Above is the AUDUSD daily chart. The moment Governor Stevens said the Aussie dollar is overvalued against its American counterpart, the AUDUSD pair collapsed.
Using the same logic like in the EURUSD case, the pair found a bottom and jumped to the 23.6% level. Moreover, in doing that, it formed a head and shoulders pattern.
That's the alternation in patterns: double bottom in the first case, head and shoulders in the second one. It is like the market screams in your face the two pairs want to move to the next Fibonacci level.
Conclusion
The examples used here have the purpose of showing a few ways to use the Fibonacci tools. Because the retracement tool is the one used in most trading theories and concepts, we focused on it.
However, especially in the Elliott Waves Theory, things go from simple to complicated in a blink of an eye. Complex retracement and expansion levels confirm a pattern or not.
They only come to confirm the importance of the Fibonacci sequence in technical analysis.
This material is written for educational purposes only. By no means do any of its contents recommend, advocate or urge the buying, selling or holding of any financial instrument whatsoever. Trading and Investing involves high levels of risk. The author expresses personal opinions and will not assume any responsibility whatsoever for the actions of the reader. The author may or may not have positions in Financial Instruments discussed in this newsletter. Future results can be dramatically different from the opinions expressed herein. Past performance does not guarantee future results.
Editors’ Picks

EUR/USD hits two-day highs near 1.1820
EUR/USD picks up pace and reaches two-day tops around 1.1820 at the end of the week. The pair’s move higher comes on the back of renewed weakness in the US Dollar amid growing talk that the Fed could deliver an interest rate cut as early as March. On the docket, the flash US Consumer Sentiment improves to 57.3 in February.

GBP/USD reclaims 1.3600 and above
GBP/USD reverses two straight days of losses, surpassing the key 1.3600 yardstick on Friday. Cable’s rebound comes as the Greenback slips away from two-week highs in response to some profit-taking mood and speculation of Fed rate cuts. In addition, hawkish comments from the BoE’s Pill are also collaborating with the quid’s improvement.

USD/JPY drops back below 157.00, as focus shifts to Japan snap election
USD/JPY is back in the red below 157.00 in the Asian session on Friday. The Japanese Yen recovers ground against the US Dollar amid some profit-taking ahead of Japan's snap general election on Sunday. The preliminary reading of the Michigan Consumer Sentiment Index report for February will be released later on Friday.
Editors’ Picks

EUR/USD: US Dollar to remain pressured until uncertainty fog dissipates Premium
The EUR/USD pair lost additional ground in the first week of February, settling at around 1.1820. The reversal lost momentum after the pair peaked at 1.2082 in January, its highest since mid-2021.

Gold: Volatility persists in commodity space Premium
After losing more than 8% to end the previous week, Gold (XAU/USD) remained under heavy selling pressure on Monday and dropped toward $4,400. Although XAU/USD staged a decisive rebound afterward, it failed to stabilize above $5,000.

GBP/USD: Pound Sterling tests key support ahead of a big week Premium
The Pound Sterling (GBP) changed course against the US Dollar (USD), with GBP/USD giving up nearly 200 pips in a dramatic correction.

Bitcoin: The worst may be behind us
Bitcoin (BTC) price recovers slightly, trading at $65,000 at the time of writing on Friday, after reaching a low of $60,000 during the early Asian trading session. The Crypto King remained under pressure so far this week, posting three consecutive weeks of losses exceeding 30%.

Three scenarios for Japanese Yen ahead of snap election Premium
The latest polls point to a dominant win for the ruling bloc at the upcoming Japanese snap election. The larger Sanae Takaichi’s mandate, the more investors fear faster implementation of tax cuts and spending plans.
RECOMMENDED LESSONS
Making money in forex is easy if you know how the bankers trade!
I’m often mystified in my educational forex articles why so many traders struggle to make consistent money out of forex trading. The answer has more to do with what they don’t know than what they do know. After working in investment banks for 20 years many of which were as a Chief trader its second knowledge how to extract cash out of the market.
5 Forex News Events You Need To Know
In the fast moving world of currency markets where huge moves can seemingly come from nowhere, it is extremely important for new traders to learn about the various economic indicators and forex news events and releases that shape the markets. Indeed, quickly getting a handle on which data to look out for, what it means, and how to trade it can see new traders quickly become far more profitable and sets up the road to long term success.
Top 10 Chart Patterns Every Trader Should Know
Chart patterns are one of the most effective trading tools for a trader. They are pure price-action, and form on the basis of underlying buying and selling pressure. Chart patterns have a proven track-record, and traders use them to identify continuation or reversal signals, to open positions and identify price targets.
7 Ways to Avoid Forex Scams
The forex industry is recently seeing more and more scams. Here are 7 ways to avoid losing your money in such scams: Forex scams are becoming frequent. Michael Greenberg reports on luxurious expenses, including a submarine bought from the money taken from forex traders. Here’s another report of a forex fraud. So, how can we avoid falling in such forex scams?
What Are the 10 Fatal Mistakes Traders Make
Trading is exciting. Trading is hard. Trading is extremely hard. Some say that it takes more than 10,000 hours to master. Others believe that trading is the way to quick riches. They might be both wrong. What is important to know that no matter how experienced you are, mistakes will be part of the trading process.
The challenge: Timing the market and trader psychology
Successful trading often comes down to timing – entering and exiting trades at the right moments. Yet timing the market is notoriously difficult, largely because human psychology can derail even the best plans. Two powerful emotions in particular – fear and greed – tend to drive trading decisions off course.