Elliott wave analysis can help you see countertrends – Pattern in focus: The Zigzag

This simple, corrective Elliott price pattern helps you anticipate reversals instead of getting run over by them
Often, as traders and investors we start off with an open mind about playing the field, so to speak. We watch the news, listen to friends and colleagues – and we try to apply what’s known as “fundamental” market analysis to make our trading decisions.
Soon, though, we start to realize that the “bullet-proof” logic of “fundamental” analysis is not Kevlar, but a piece of cardboard. We see markets fall after good news; rally after bad; and go sideways, defying both bulls and bears.
That’s when we realize that trading is not as easy as it seems.
At that point, serious traders start to turn to technical market analysis. It doesn't look at the news, or events, or politics, or what the Fed Chairman had for breakfast. It doesn't even look at the name besides the ticker symbol. It looks at the price charts, at the market itself, to determine internal strength, momentum – and, ultimately, the trend.
One of the leading technical models today is Elliott wave analysis, which teaches that market prices are not random, but patterned. These patterns are constantly unfolding in all liquid markets, on all time frames -- bullish, bearish, lasting over the next few minutes or the next few months.
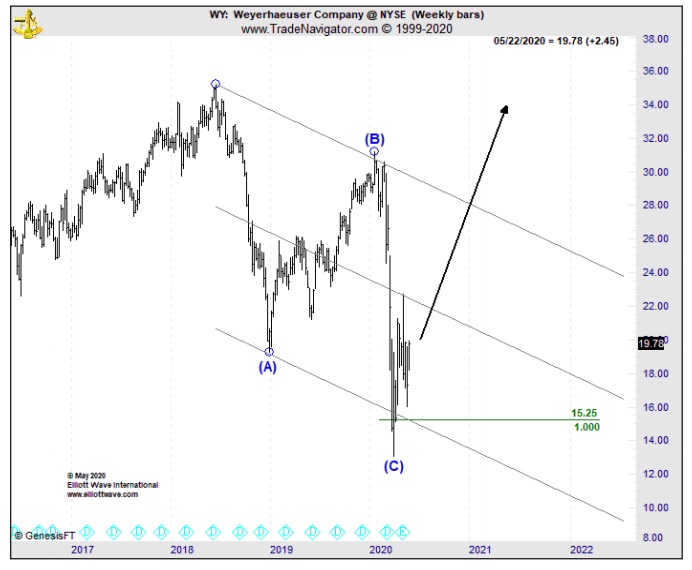
Take, for instance, this chart below of a venerable Big Board stock, global timberland producer and real estate investment trust, Weyerhaeuser Company (ticker symbol WY) -- in May 2020, at the start of the pandemic.
If you'd been tied to the name Weyerhaeuser or the news surrounding its name at that time, you'd would've likely done one of two things: Shorted the stock or made a hard pass talk to the hand.
Remember, this was May 2020. The world was two months into the worst pandemics in centuries. The global economy had come to a crashing halt, and the future of real estate seemed doomed.
In fact, the mainstream consensus about companies associated with the constructing, buying, and selling of property was terminal. On May 1, 2020, Motley Fool described a single-day bloodbath in Weyerhaeuser and wrote:
"WY plunged 15% in a matter of seconds... Any company's cutting its dividend is unwelcome, but a REIT's doing so is particularly bad since the REIT structure was created specifically to pass income on to shareholders."
But on May 26, 2020, Elliott Wave International’s Trader's Classroom editor Jeffrey Kennedy showed subscribers this bullish chart of Weyerhaeuser:
Why was Trader's Classroom turning bullish when the rest of the world all but wrote WY off?
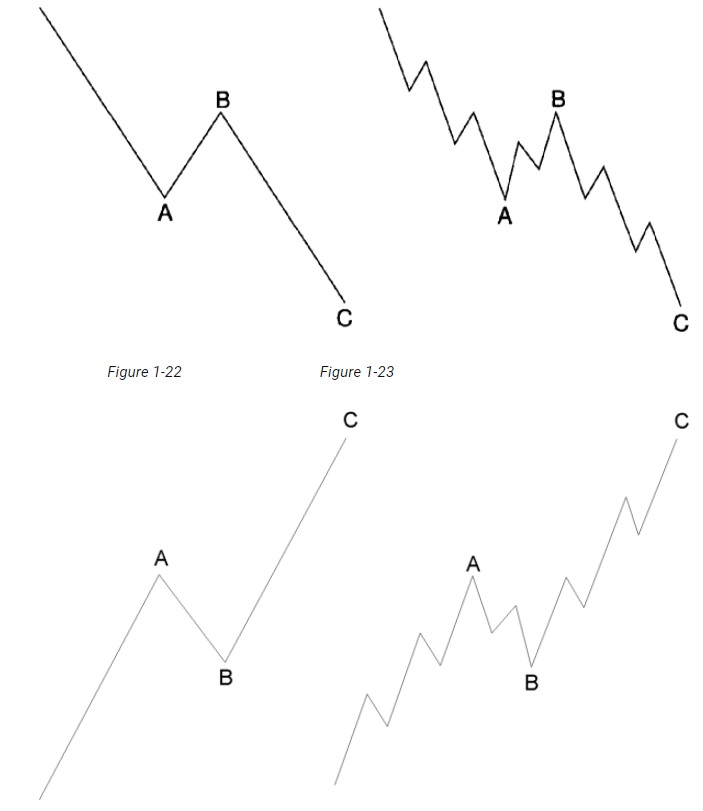
Because the decline in WY had a signature look of one key Elliott wave pattern: a zigzag. Here, the Elliott Wave Principle -- Key to Market Behavior offers this definition and idealized diagram:
"A single zigzag is a simple three-wave pattern labeled A-B-C. The subwave sequence is 5-3-5, and the top of wave B is noticeably lower than the start of wave A."
Zigzags are corrections -- i.e., countertrend moves, and signify a temporary break in the larger trend. The significance of WY's completion of this countertrend move was clear: The stock was headed for a powerful rebound.
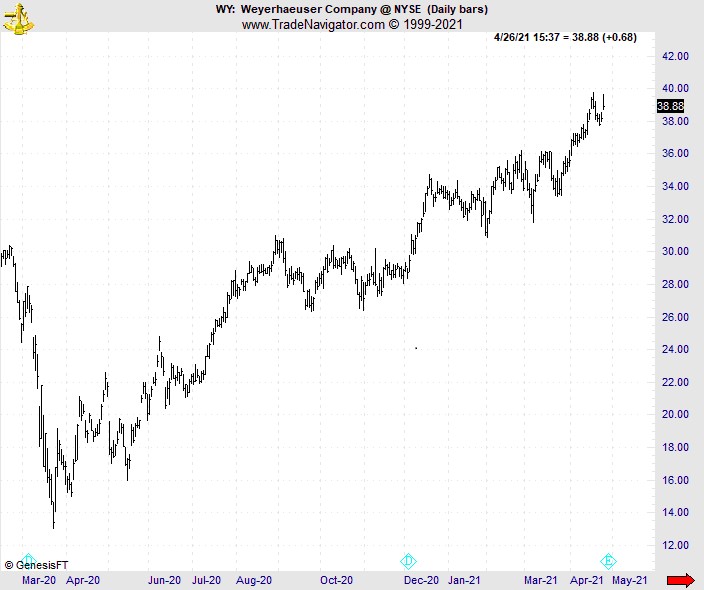
The next chart captures what followed: WY indeed caught a powerful upwind and rode the current to its highest price level in its 121-year history, a comeback that shocked much of the mainstream financial world and those traders betrothed to a narrow view of market behavior.
In the end, Elliott wave analysis proves that finding opportunity in financial markets is truly unlimited.
It starts with learning the five core Elliott wave patterns. Once you identify a pattern using the Wave Principle, you can then confidently anticipate the direction prices will most likely move next.
Check more of our analysis for currencies and cryptos in members-only area.Visit EW-Forecast for details!
Author

Elliott Wave International Analysts Team
Elliott Wave International
EWI is the world's largest market forecasting firm. Its staff of full-time analysts led by Chartered Market Technician Robert Prechter provides 24-hour-a-day market analysis to institutional and private investors around the world.


