Now Drawdowns are not what traders want to hear or even think about. But it’s a very important one and it’s what you should think about before starting to trade. What can go wrong? What kind of pain will you have to endure? Can you make it through that?
To make this more concrete let’s look at a specific example. The Natural Gas Future is one of the favorite markets of Ambush Traders. And so for a good reason. Its performance has been very stable over the years and drawdowns tend to get recovered quickly.
But even trading Natural Gas there are times when it can get bumpy trading Ambush. And as we just experienced one of these periods at the end of 2016, I thought this might be a good time to have a look at some statistics regarding Drawdowns.
Let’s start with the equity curve. First of all, the results here assume we’re trading one contract all the time, pay $5 commissions per round-turn and get 1/2 tick slippage on any non-limit order.
On the chart every new equity high is marked red and as you can see we just made new all time equity highs in NG. Another thing to notice is that new highs happen quite often compared to other strategies. During 2016 we had a huge draw-up period making lots of new equity highs.
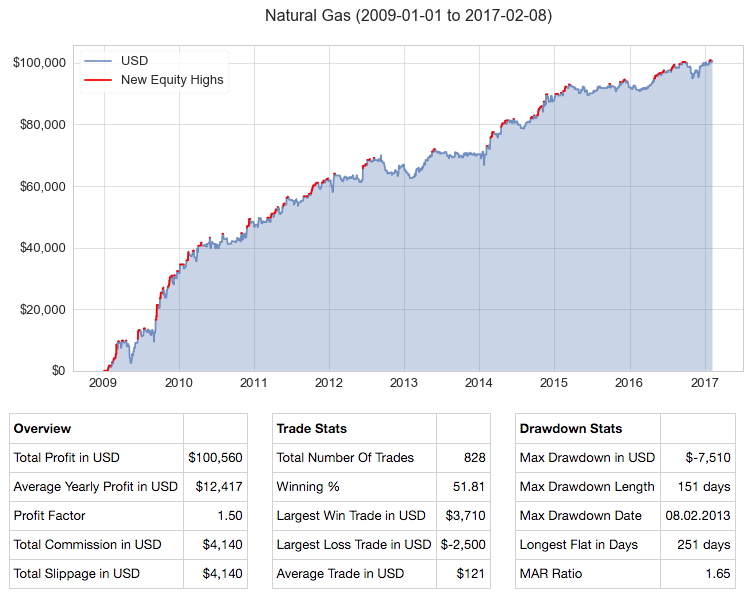
One of the most useful metrics to measure the impact of drawdowns is the MAR Ratio. It takes the average yearly profit (usually compounded in %, in our case, it’s not compounded as we’re always trading 1 contract) and divides it by the maximum drawdown. Which means, the higher the number, the better. If it’s above 1 that’s a good sign, and anything above 1.5 is really good. In our case, we got a MAR Ratio of 1.65, so the average yearly profit ($12.5k) is 1.65 times the maximum drawdown (-$7.5k). Which means to make those $12.5k on average a year, you’d have to endure a drawdown of about -$7.5k sometime in between. Sounds like a very good deal, doesn’t it? If it doesn’t then trading maybe isn’t the right business for you. No pain, no gain.
Now let’s have a more detailed look at the drawdowns:
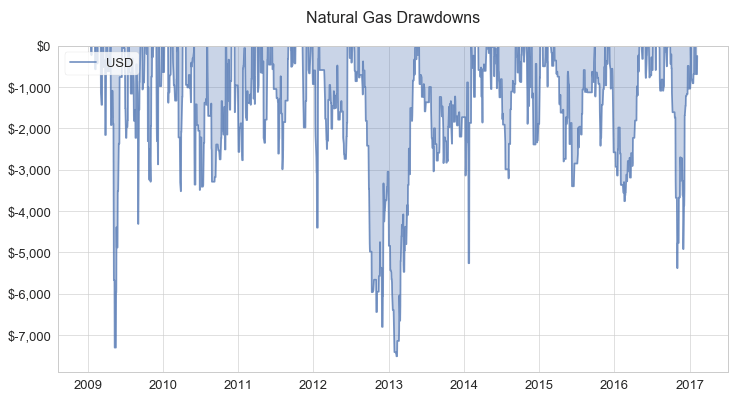
This gives you a pretty good idea what you’ll have to make it through on a regular basis (up to -$3k drawdowns), sometimes (up to -$5k drawdowns) and the two worst cases that don’t happen often but you better are aware that they could (up to -$7.5k drawdowns).
So what happened at the end of 2016 was ugly, but not that unusual. Also, notice how quickly these drawdowns tend to recover (with the exception of 2013).
Again this is not what most traders want to think about. It’s so much more fun to think about the $12k profits a year per contract! But the day will come when you’ll be much better off to have thought this through. To be prepared when the shit hits the fan, and it will sooner or later. Then this kind of knowledge is what helps you to now throw in the towel at exactly the wrong time, to keep on trading, keep on pushing through and to make it to the next equity highs!
How to reduce drawdowns? The wrong path would be to try and somehow filter out these losing periods. That’s going to work in the backtest, but not in real trading. The best way to reduce drawdowns is to diversify. Trade more than one market. Trade more than one system. That’s what will make that MAR ratio go above 2 and higher.
Happy Trading!
CFTC RULE 4.41 - HYPOTHETICAL OR SIMULATED PERFORMANCE RESULTS HAVE CERTAIN LIMITATIONS. UNLIKE AN ACTUAL PERFORMANCE RECORD, SIMULATED RESULTS DO NOT REPRESENT ACTUAL TRADING. ALSO, SINCE THE TRADES HAVE NOT BEEN EXECUTED, THE RESULTS MAY HAVE UNDER-OR-OVER COMPENSATED FOR THE IMPACT, IF ANY, OF CERTAIN MARKET FACTORS, SUCH AS LACK OF LIQUIDITY. SIMULATED TRADING PROGRAMS IN GENERAL ARE ALSO SUBJECT TO THE FACT THAT THEY ARE DESIGNED WITH THE BENEFIT OF HINDSIGHT. NO REPRESENTATION IS BEING MADE THAT ANY ACCOUNT WILL OR IS LIKELY TO ACHIEVE PROFIT OR LOSSES SIMILAR TO THOSE SHOWN.
Editors’ Picks

EUR/USD hits two-day highs near 1.1820
EUR/USD picks up pace and reaches two-day tops around 1.1820 at the end of the week. The pair’s move higher comes on the back of renewed weakness in the US Dollar amid growing talk that the Fed could deliver an interest rate cut as early as March. On the docket, the flash US Consumer Sentiment improves to 57.3 in February.

GBP/USD reclaims 1.3600 and above
GBP/USD reverses two straight days of losses, surpassing the key 1.3600 yardstick on Friday. Cable’s rebound comes as the Greenback slips away from two-week highs in response to some profit-taking mood and speculation of Fed rate cuts. In addition, hawkish comments from the BoE’s Pill are also collaborating with the quid’s improvement.

USD/JPY drops back below 157.00, as focus shifts to Japan snap election
USD/JPY is back in the red below 157.00 in the Asian session on Friday. The Japanese Yen recovers ground against the US Dollar amid some profit-taking ahead of Japan's snap general election on Sunday. The preliminary reading of the Michigan Consumer Sentiment Index report for February will be released later on Friday.
Editors’ Picks

EUR/USD: US Dollar to remain pressured until uncertainty fog dissipates Premium
The EUR/USD pair lost additional ground in the first week of February, settling at around 1.1820. The reversal lost momentum after the pair peaked at 1.2082 in January, its highest since mid-2021.

Gold: Volatility persists in commodity space Premium
After losing more than 8% to end the previous week, Gold (XAU/USD) remained under heavy selling pressure on Monday and dropped toward $4,400. Although XAU/USD staged a decisive rebound afterward, it failed to stabilize above $5,000.

GBP/USD: Pound Sterling tests key support ahead of a big week Premium
The Pound Sterling (GBP) changed course against the US Dollar (USD), with GBP/USD giving up nearly 200 pips in a dramatic correction.

Bitcoin: The worst may be behind us
Bitcoin (BTC) price recovers slightly, trading at $65,000 at the time of writing on Friday, after reaching a low of $60,000 during the early Asian trading session. The Crypto King remained under pressure so far this week, posting three consecutive weeks of losses exceeding 30%.

Three scenarios for Japanese Yen ahead of snap election Premium
The latest polls point to a dominant win for the ruling bloc at the upcoming Japanese snap election. The larger Sanae Takaichi’s mandate, the more investors fear faster implementation of tax cuts and spending plans.
RECOMMENDED LESSONS
Making money in forex is easy if you know how the bankers trade!
I’m often mystified in my educational forex articles why so many traders struggle to make consistent money out of forex trading. The answer has more to do with what they don’t know than what they do know. After working in investment banks for 20 years many of which were as a Chief trader its second knowledge how to extract cash out of the market.
5 Forex News Events You Need To Know
In the fast moving world of currency markets where huge moves can seemingly come from nowhere, it is extremely important for new traders to learn about the various economic indicators and forex news events and releases that shape the markets. Indeed, quickly getting a handle on which data to look out for, what it means, and how to trade it can see new traders quickly become far more profitable and sets up the road to long term success.
Top 10 Chart Patterns Every Trader Should Know
Chart patterns are one of the most effective trading tools for a trader. They are pure price-action, and form on the basis of underlying buying and selling pressure. Chart patterns have a proven track-record, and traders use them to identify continuation or reversal signals, to open positions and identify price targets.
7 Ways to Avoid Forex Scams
The forex industry is recently seeing more and more scams. Here are 7 ways to avoid losing your money in such scams: Forex scams are becoming frequent. Michael Greenberg reports on luxurious expenses, including a submarine bought from the money taken from forex traders. Here’s another report of a forex fraud. So, how can we avoid falling in such forex scams?
What Are the 10 Fatal Mistakes Traders Make
Trading is exciting. Trading is hard. Trading is extremely hard. Some say that it takes more than 10,000 hours to master. Others believe that trading is the way to quick riches. They might be both wrong. What is important to know that no matter how experienced you are, mistakes will be part of the trading process.
The challenge: Timing the market and trader psychology
Successful trading often comes down to timing – entering and exiting trades at the right moments. Yet timing the market is notoriously difficult, largely because human psychology can derail even the best plans. Two powerful emotions in particular – fear and greed – tend to drive trading decisions off course.