CFTC Weekly Positions Report: Reading through the published data

Understanding what the “market positioning” in financial market is crucial for any trader who wishes to take advantage of temporary dislocations of asset prices (i.e., buy low/sell high). We can think of financial markets as a manmade jungles, filled with overwhelming data flow, where algorithms and sophisticated traders lurk in the dark, ready to hunt. If we don’t want to become a prey, we should use whatever we have in our disposal to navigate safely and survive.
Our biggest problem is to understand how the market is positioned, what forces drive the price action of the different assets, and how to use that knowledge to initiate successful trades. It is hard to assess the market positioning due to the lack of transparency in the different markets. Unlike the equity market (and some of the commodity market), which is mostly traded and cleared through exchanges, the Foreign Exchange market is mostly traded OTC (Over-the-Counter). A 3.2 trillion USD turnover is not visible for us to analyze.
With that said, we can still have a small peek into the market positioning, using the CFTC (US Commodity Futures Trading Committee) data. Every trade that goes through the US exchanges (whether it is Equity, Commodity, Bond or Currency) must be reported, and every firm on the exchange is being categorized based on its type (Bank, Asset Manager, Insurance Company or Non-Commercial).
Our main interest is to understand what the “Net Speculative position” is. Why do we want to know that?
As speculative traders are the ones that dominate the short-term dynamic of the market (fast moving, quickly adapting to the market, and mostly following medium-term trends). The Commercial type accounts (Banks, Insurance companies and Asset Managers) will be slow to react, investing for the long term and not change their portfolio quickly. For that reason we will look at the difference between the Non-Commercial position and the Commercial position. The difference between these positon, in most cases, is high correlated to the trend of the underlying asset. Two caveats that we need to note:
- This data is published on Friday afternoon (NY time), based on the end-of-day of the previous Tuesday, meaning that the data is subject to 3-days lag.
- The data represents only a small fraction of the entire market (meaning, that we assume it is a proxy to the true position).
Let’s look at two examples of the relation between the CFTC positioning and the underlying price action
The below chart shows the JPY CFTC net position, alongside the JPY-USD spot price.
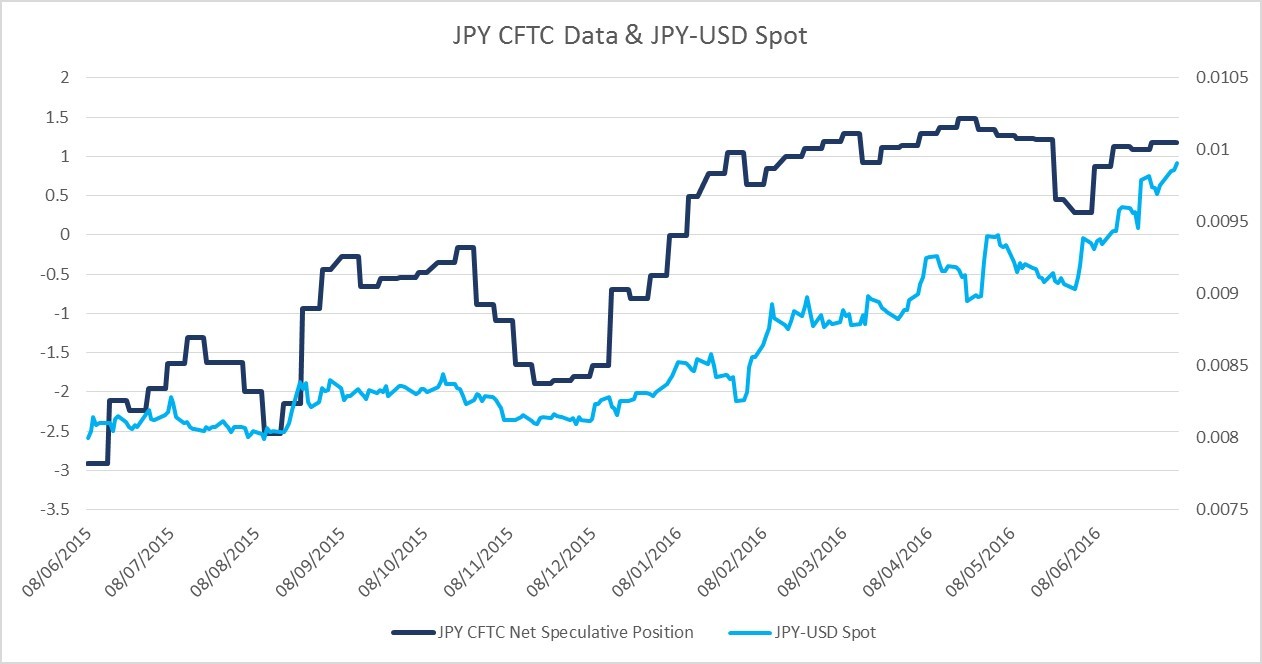
We can clearly see a strong correlation between the trends in positioning and spot price. Obviously they will not go in lock-steps, but the positioning index will, in most cases, indicate about the trend in spot.
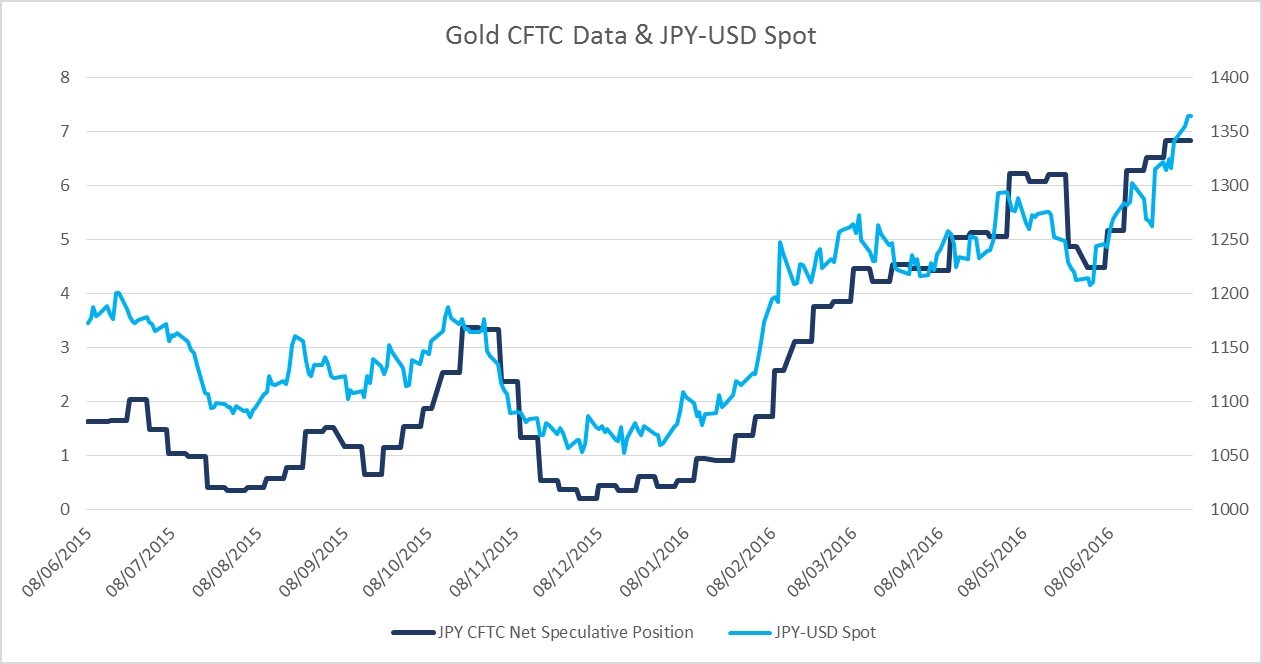
Looking at the correlation between Gold CFTC data and Gold spot price reveals extremely high correlation between the Net Speculative position and the Gold Spot price. This leads us to believe that the recent move in Gold (and Silver) was driven by fast-money type accounts, and not long-term investors.
Understanding the positioning and the flows can help traders establish medium-long term positions, either in options on in spot.
EZTRADER Market Analysis Team will publish a weekly report about the CFTC positions, alongside insights regarding the different currencies, commodities, equities, and will try to shed some light about the market sentiment using cutting edge quantitative methods and indicators.
Author

EzTrader Market Analysis Team
EzTrader
EZTRADER is a Binary Option Platform that offers a wide range of binary options on different asset classes. EZTRADER is regulated by most European regulators (including the UK FCA, and Germany BaFin)


