The Breakout Method
One of the most popular trading strategies commonly used by all variety of traders is the “breakout trading” method. Many automated systems and indeed successful hedge fund strategies are based on this simple approach.
Perhaps the most attractive aspect of this trading method is that it can be used with consistent success on any time-frame and can largely be applied to all market conditions. So let’s break down exactly what the breakout method is and discuss how you can build this popular trading style into your trading arsenal.
The method itself is very simple and requires only that traders observe a specific price reaction at specific levels. Traders look to define a trading range as identified by a reference low and high point and then simply enter a trade as price breaks through either of these levels.
Now obviously, as with all trading strategies, it is a little more difficult in practice than in theory and really one of the keys to success in using this method is how you define the trading range and the reference high and low point.
There are many ways to define trading ranges from simple time based ranges (e.g the high and low of the last 20 day or the last 30 minutes) through to looking to identify consecutive breaks of highs and lows.
Let’s take a look at some examples to better explain what we mean when we talk about trading ranges.
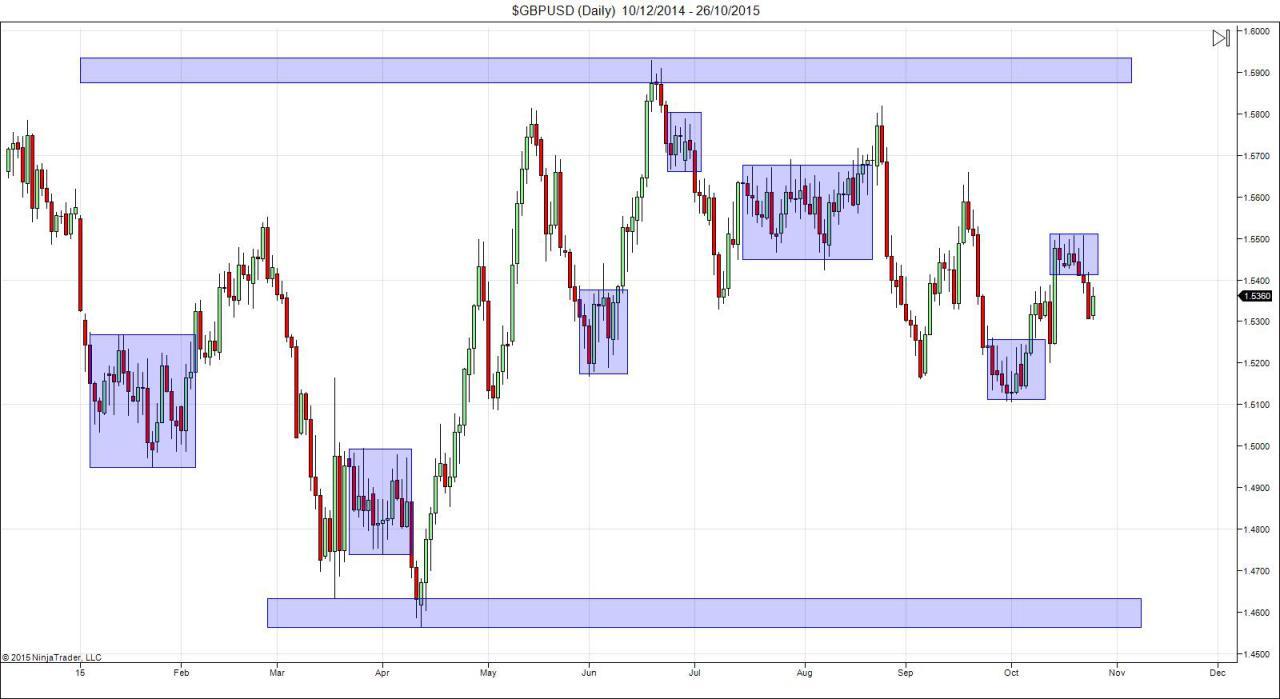
In the example above of GBPUSD over 2015 so far we can see highlighted at the top of the chart the 2015 range high and highlighted along the bottom of the chart the 2015 range low. So in terms of a yearly range, those levels mark the GBPUSD 2015 range.
However, within the overall range that price has been contained within we can also identify several smaller ranges that would have been important on the lower timeframes, contained price for day, sometimes weeks at a time.
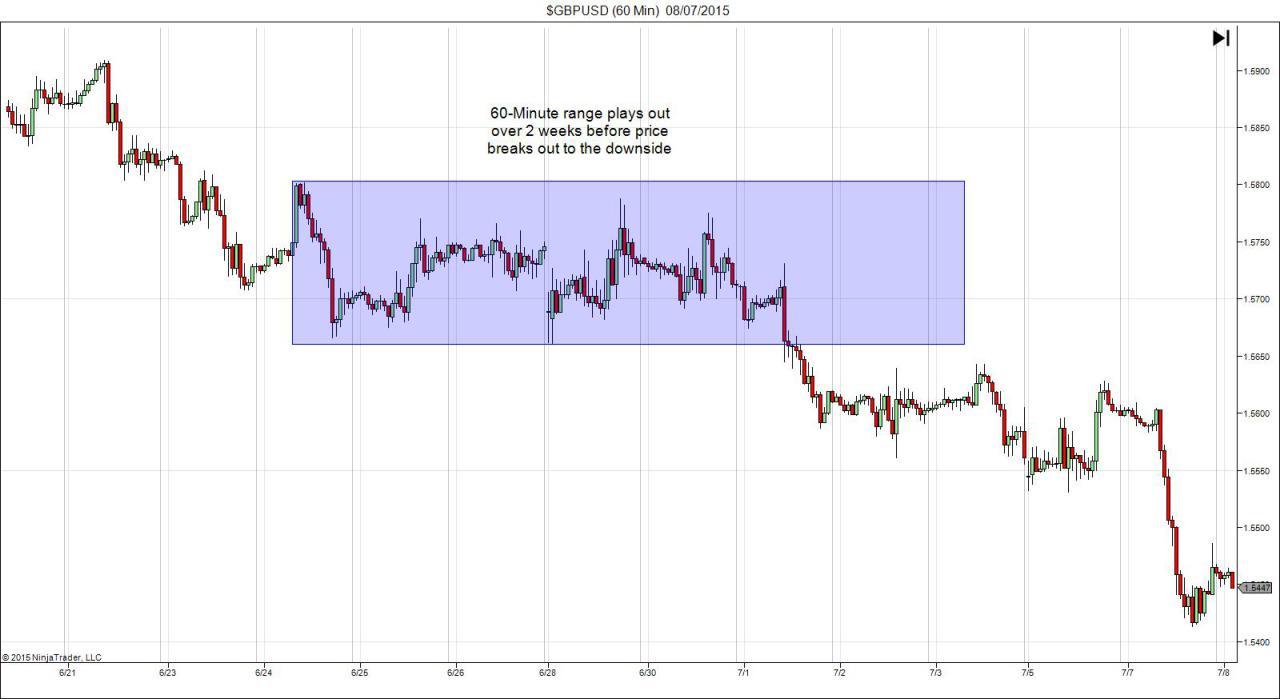
The image below shows the range that forms just under the 2015 range high, as shown on a 60-minute chart.
A common method for breakout trading is to identify ranges on the lower timeframes using recent highs and lows on the 15 minute chart and trading the subsequent breakouts.
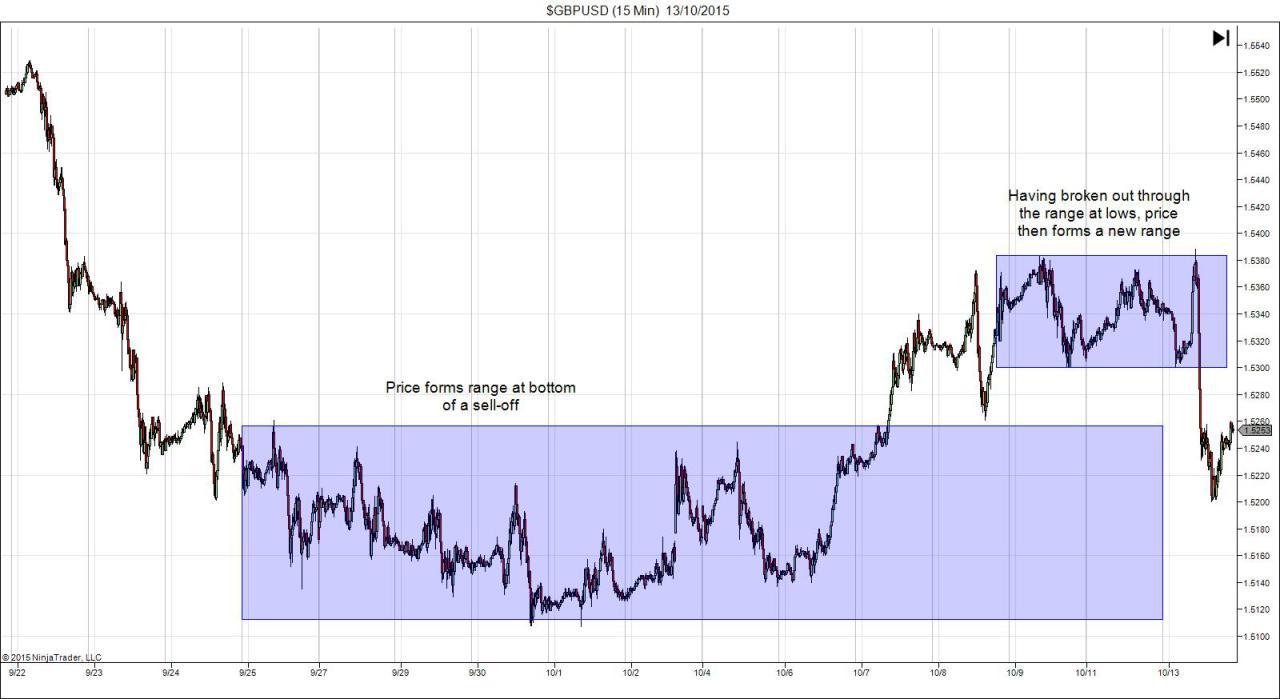
In the image above you can see how following a sell-off, GBPUSD forms a range at lows and then once it breaks out through the range high, price forms another range.
There is actually important information contained in this picture, though you might not realise it yet. You see, what this picture actually demonstrates is an example of the typical price action dynamic we see whereby the market tends to move in short impulsive bursts followed by periods of consolidation. Understanding this market flow is key to success in trading break-outs. Whilst you can certainly be fairly successful just through getting good at identifying the ranges themselves, learning to understand the rhythm of the market and the context of these ranges can amplify your success.
So how then do we actually trade the breakout? Well although there are many different strategies employed in this style of trading, in its simplest form the strategy is as follows.
Enter a trade as price breaks through the range, place stop just behind the opposite side of the range, and target 2 times the width of the range.
Let’s look at an example to make this clear.
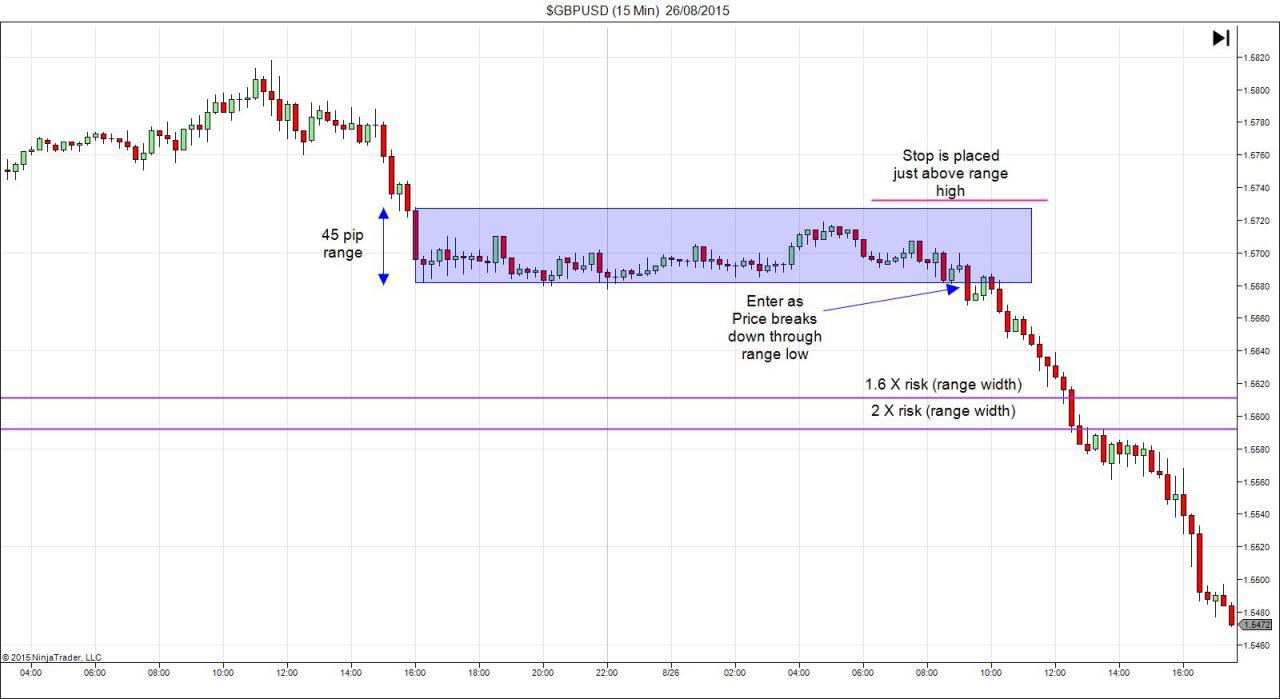
In the example above we see price sell-off and then for a consolidation range. We then see price break-down through the range low at which point we enter short. We place our stop just above the range high and our target is marked as twice the width of the range.
So you can see the method is very simple and straightforward to follow. You might wish to alter this method slightly. For example, you could think that when price hits the 2 times range target you will trail your stops to lock in profits but allow the trade the chance to run on further. Perhaps you could bank half your position and leave a runner
Entry Options
An important consideration, and one that really comes down to your own personal risk preference, is whether you enter the trade simply as price is breaking out, mid-candle, or wait for a candle close to confirm.
So which is best?
Well they both have pros and cons. Obviously, entering as price breaks out is slightly more aggressive and leaves you open to trading “false breaks” whereby price breaks out only to reverse back within the range. However, entering in this manner also guarantees you more profits if you are correct in your assessment of the breakout allowing you to catch the full tun.
Alternatively, waiting for the candle to close outside of the range gives slightly more confirmation that a proper break-out is likely to happen and helping to avoid many false breaks. However, the issue here is that as breakouts tend to be explosive, waiting for the candle to close might mean that you miss the majority of the move and end up entering as price is quite extended, creating higher risk of price reversing and also requiring a larger stop. Again, how you choose to execute this trade will require you to do your homework and pick the method that suits you best, but there are many successful break-out traders using each method.
This market forecast is for general information only. It is not an investment advice or a solution to buy or sell securities.
Authors' opinions do not represent the ones of Orbex and its associates. Terms and Conditions and the Privacy Policy apply.
Trading foreign exchange on margin carries a high level of risk, and may not be suitable for all investors. Before deciding to trade foreign exchange, you should carefully consider your investment objectives, level of experience, and risk appetite. There is a possibility that you may sustain a loss of some or all of your investment and therefore you should not invest money that you cannot afford to lose. You should be aware of all the risks associated with foreign exchange trading, and seek advice from an independent financial advisor if you have any doubts.
Editors’ Picks

EUR/USD hits two-day highs near 1.1820
EUR/USD picks up pace and reaches two-day tops around 1.1820 at the end of the week. The pair’s move higher comes on the back of renewed weakness in the US Dollar amid growing talk that the Fed could deliver an interest rate cut as early as March. On the docket, the flash US Consumer Sentiment improves to 57.3 in February.

GBP/USD reclaims 1.3600 and above
GBP/USD reverses two straight days of losses, surpassing the key 1.3600 yardstick on Friday. Cable’s rebound comes as the Greenback slips away from two-week highs in response to some profit-taking mood and speculation of Fed rate cuts. In addition, hawkish comments from the BoE’s Pill are also collaborating with the quid’s improvement.

USD/JPY drops back below 157.00, as focus shifts to Japan snap election
USD/JPY is back in the red below 157.00 in the Asian session on Friday. The Japanese Yen recovers ground against the US Dollar amid some profit-taking ahead of Japan's snap general election on Sunday. The preliminary reading of the Michigan Consumer Sentiment Index report for February will be released later on Friday.
Editors’ Picks

EUR/USD: US Dollar to remain pressured until uncertainty fog dissipates Premium
The EUR/USD pair lost additional ground in the first week of February, settling at around 1.1820. The reversal lost momentum after the pair peaked at 1.2082 in January, its highest since mid-2021.

Gold: Volatility persists in commodity space Premium
After losing more than 8% to end the previous week, Gold (XAU/USD) remained under heavy selling pressure on Monday and dropped toward $4,400. Although XAU/USD staged a decisive rebound afterward, it failed to stabilize above $5,000.

GBP/USD: Pound Sterling tests key support ahead of a big week Premium
The Pound Sterling (GBP) changed course against the US Dollar (USD), with GBP/USD giving up nearly 200 pips in a dramatic correction.

Bitcoin: The worst may be behind us
Bitcoin (BTC) price recovers slightly, trading at $65,000 at the time of writing on Friday, after reaching a low of $60,000 during the early Asian trading session. The Crypto King remained under pressure so far this week, posting three consecutive weeks of losses exceeding 30%.

Three scenarios for Japanese Yen ahead of snap election Premium
The latest polls point to a dominant win for the ruling bloc at the upcoming Japanese snap election. The larger Sanae Takaichi’s mandate, the more investors fear faster implementation of tax cuts and spending plans.
RECOMMENDED LESSONS
Making money in forex is easy if you know how the bankers trade!
I’m often mystified in my educational forex articles why so many traders struggle to make consistent money out of forex trading. The answer has more to do with what they don’t know than what they do know. After working in investment banks for 20 years many of which were as a Chief trader its second knowledge how to extract cash out of the market.
5 Forex News Events You Need To Know
In the fast moving world of currency markets where huge moves can seemingly come from nowhere, it is extremely important for new traders to learn about the various economic indicators and forex news events and releases that shape the markets. Indeed, quickly getting a handle on which data to look out for, what it means, and how to trade it can see new traders quickly become far more profitable and sets up the road to long term success.
Top 10 Chart Patterns Every Trader Should Know
Chart patterns are one of the most effective trading tools for a trader. They are pure price-action, and form on the basis of underlying buying and selling pressure. Chart patterns have a proven track-record, and traders use them to identify continuation or reversal signals, to open positions and identify price targets.
7 Ways to Avoid Forex Scams
The forex industry is recently seeing more and more scams. Here are 7 ways to avoid losing your money in such scams: Forex scams are becoming frequent. Michael Greenberg reports on luxurious expenses, including a submarine bought from the money taken from forex traders. Here’s another report of a forex fraud. So, how can we avoid falling in such forex scams?
What Are the 10 Fatal Mistakes Traders Make
Trading is exciting. Trading is hard. Trading is extremely hard. Some say that it takes more than 10,000 hours to master. Others believe that trading is the way to quick riches. They might be both wrong. What is important to know that no matter how experienced you are, mistakes will be part of the trading process.
The challenge: Timing the market and trader psychology
Successful trading often comes down to timing – entering and exiting trades at the right moments. Yet timing the market is notoriously difficult, largely because human psychology can derail even the best plans. Two powerful emotions in particular – fear and greed – tend to drive trading decisions off course.