On March 16, I forecasted that Bitcoin would likely revisit the $73,600 level. It hit $72,600 just before a sudden downturn triggered by geopolitical events. As the world watches the unfolding tensions in the Middle East, Bitcoin's market reaction has been sharply bearish, with prices tumbling from a high of $74,000 to just below $61,000. This drop raises the pivotal question: is the cryptocurrency market heading for a bullish recovery or steering into a deeper bearish phase? This blog delves into the complexities of the current Bitcoin landscape, guided by the structured Trading Genius Formula inspired by W.D. Gann. I am going to show you how to apply the Overbalance of Time and Price using the Natural Law of Action and Reaction to forecast and discern what might be on the horizon.
The seven dimensions of market analysis
Our comprehensive framework—The 7th Dimension Analysis—draws on mathematical principles and market dynamics to analyze the market structure, cycle, and market reversal. Let's explore each dimension to understand how you can discern the trend profit from the market.
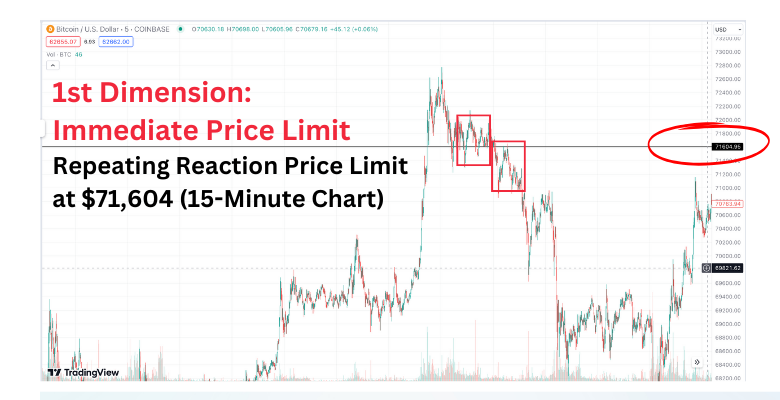
1. Immediate Price Limits (1st Dimension)
Setting a repeating reaction price limit at $71,604 on a 15-minute chart offers a precise threshold for short-term trading decisions.
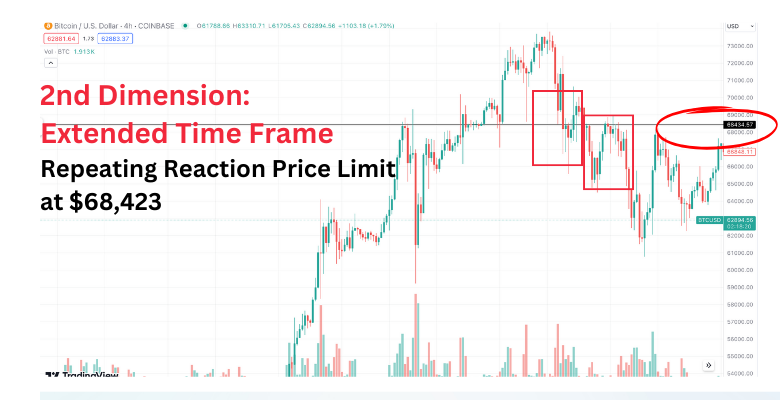
2. Extended Time Frame Analysis (2nd Dimension)
A repeating reaction price limit at $68,423 on a 4-hour chart establishes a broader perspective and helps gauge longer-term market sentiment.
3. News: Theme vs. Price (3rd Dimension)
A slew of news and distractions constantly emerge on Bitcoin and cryptocurrency. Events such as BTC halving or macroeconomic updates can drive significant price shifts. Due to this noise, it's even harder to know the right time to enter or exit the market.
My Pro-Tip: Never speculate on the news. Let the news circulate and check against the news timestamp to determine whether it causes a market reversal and whether it is the ‘Profitable NOISE’ price mover during the current cycle.
4. Reaction Time Limits (4th Dimension)
According to Gann, "The TIME FACTOR is the most important. When TIME is up, time or space movements will reverse."
He also noted: "Remember that the 'overbalancing' of TIME is the most important indication of a change in trend."
This builds on the first and second dimensions. The market operates on various dimensions, and here, we focus on the repeating time vibratory number. During the repeated reaction time limit, when the market drops to a new low and rebounds to a lower high, you should add the vibratory time number. If the price holds, that means the time is up, and it provides a good entry or exit point based on the first or second dimensions.
5. Volume-Supported Trendlines (5th Dimension)
Trendlines often break down, right? My Traction Trendline incorporates trading volume to identify support and resistance levels when the market truly gains traction.
6. & 7. Astrological Timing & Pricing (6th and 7th Dimensions) - PROOF Below
This final dimension integrates astrological forecasts with pricing. Read the PROOF from my forecast in our trading room:
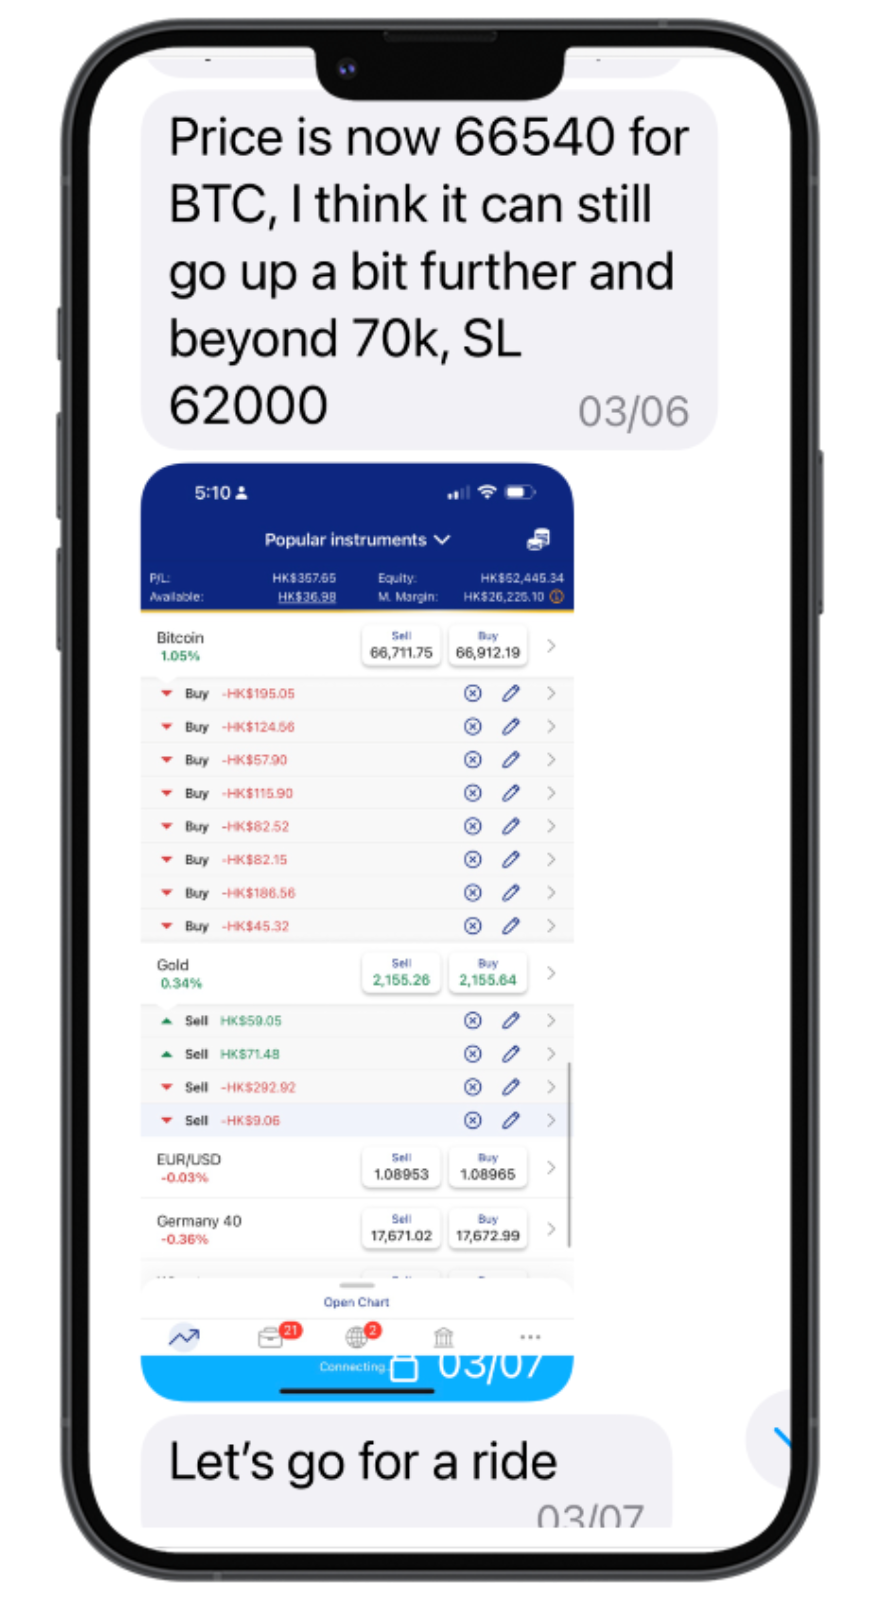
Mar 6: The price of BTC is at 66,450, and the stop loss at $62,000 is expected to move beyond the $70K level.
Mar 12: See how the dark energy pushes the market and prevents it from touching the price at the $62,000 level.
Mar 16: The market will likely revisit $73,600, so I revised my target from $80,000 to $73,600.
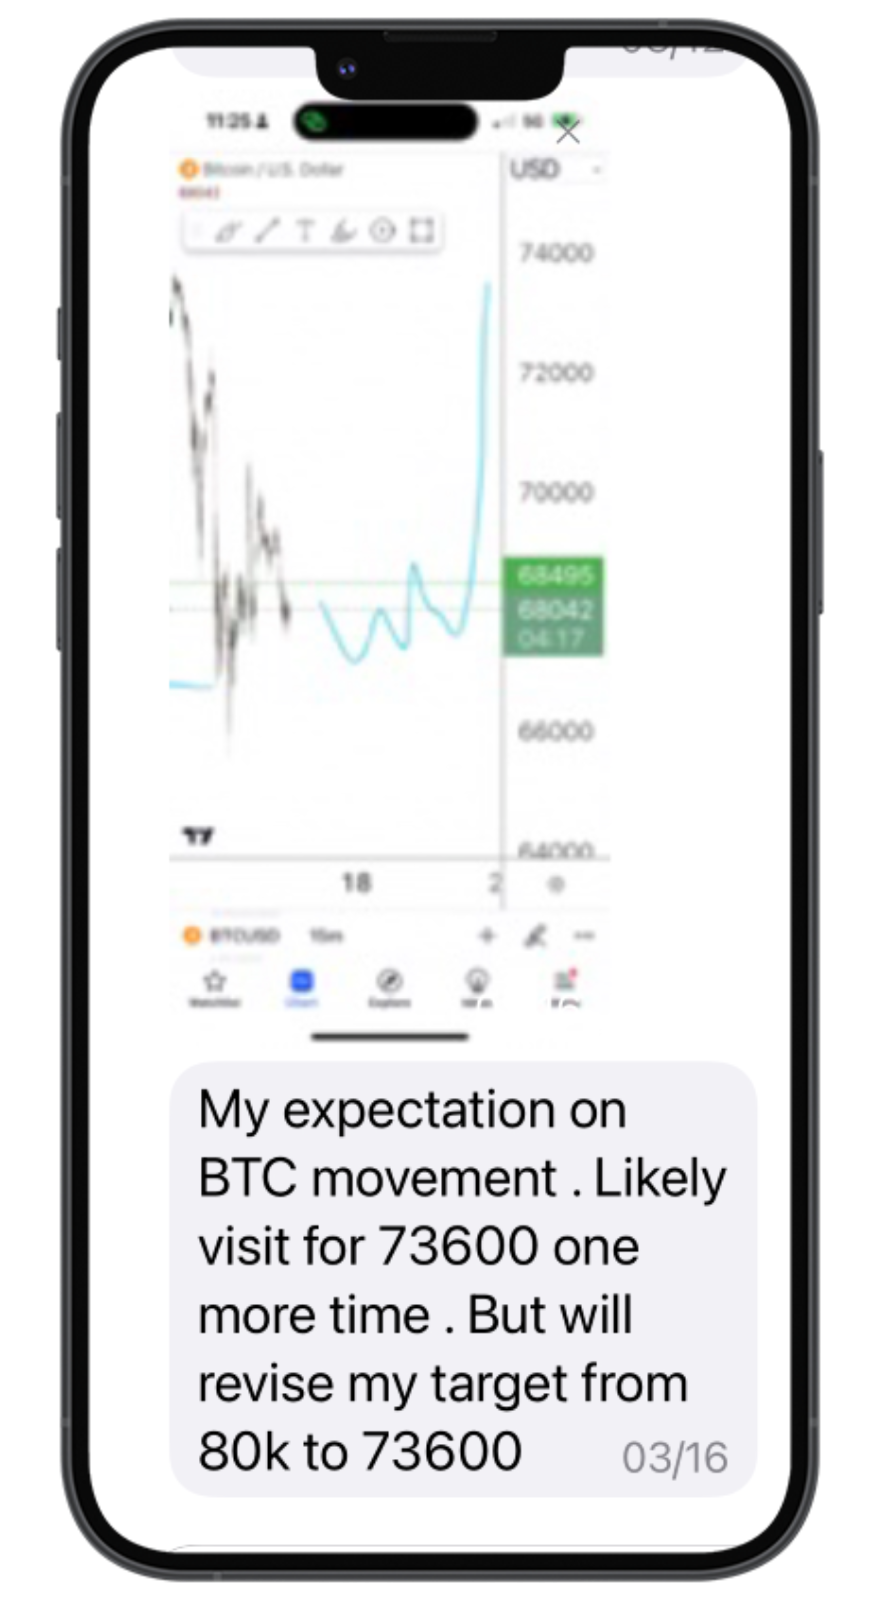
I forecasted that Bitcoin would likely revisit the $73,600 level. It hit $72,600 just before a downturn triggered by sudden geopolitical events in the Middle East.
Conclusion: Viewing market mastery through W.D. Gann’s Lens
Understanding each dimension provides the correct lens to view the market accurately. This is how you apply the overbalance of time and price using the natural law of action and reaction. To effectively calculate the 'balancing,' it's crucial to know when a cycle begins and ends, as covered in the Trading Genius Formula. However, in my experience, time and price represent two distinct domains. This is how time and price mesh together to generate trading signals. Whether the market trends are bullish or bearish, armed with the right tools and knowledge, traders can navigate Bitcoin's volatility with greater confidence and precision.
Khit Wong and all members of Gann Explained LLC are NOT financial advisors, and nothing they say is meant to be a recommendation to buy or sell any financial instrument. All information is strictly educational and/or opinion. By reading this, you agree to all of the following: You understand this to be an expression of opinions and not professional advice. Any opinions, news, research, analysis, prices, or other information contained on this website is provided as general market commentary and education and does not constitute advice. The brand name of Gann Explained LLC will not accept liability for any loss or damage, including without limitation any loss of profit, which may arise directly or indirectly from the use of or reliance on such information. You are solely responsible for the use of any content and hold Khit Wong, Gann Explained LLC all members harmless in any event or claim. FTC DISCLOSURE: Any income claims shared by myself, students, friends, or clients are understood to be true and accurate but are not verified in any way. Always do your own due diligence and use your own judgment when making buying decisions and investments in your business.
Editors’ Picks
EUR/USD Price Annual Forecast: Growth to displace central banks from the limelight in 2026 Premium
What a year! Donald Trump’s return to the United States (US) Presidency was no doubt what led financial markets throughout 2025. His not-always-unexpected or surprising decisions shaped investors’ sentiment, or better said, unprecedented uncertainty.
Gold Price Annual Forecast: 2026 could see new record-highs but a 2025-like rally is unlikely Premium
Gold hit multiple new record highs throughout 2025. Trade-war fears, geopolitical instability and monetary easing in major economies were the main drivers behind Gold’s rally.
GBP/USD Price Annual Forecast: Will 2026 be another bullish year for Pound Sterling? Premium
Having wrapped up 2025 on a positive note, the Pound Sterling (GBP) eyes another meaningful and upbeat year against the US Dollar (USD) at the start of 2026.
US Dollar Price Annual Forecast: 2026 set to be a year of transition, not capitulation Premium
The US Dollar (USD) enters the new year at a crossroads. After several years of sustained strength driven by US growth outperformance, aggressive Federal Reserve (Fed) tightening, and recurrent episodes of global risk aversion, the conditions that underpinned broad-based USD appreciation are beginning to erode, but not collapse.
Bitcoin Price Annual Forecast: BTC holds long-term bullish structure heading into 2026
Bitcoin (BTC) is wrapping up 2025 as one of its most eventful years, defined by unprecedented institutional participation, major regulatory developments, and extreme price volatility.
RECOMMENDED LESSONS
Making money in forex is easy if you know how the bankers trade!
I’m often mystified in my educational forex articles why so many traders struggle to make consistent money out of forex trading. The answer has more to do with what they don’t know than what they do know. After working in investment banks for 20 years many of which were as a Chief trader its second knowledge how to extract cash out of the market.
5 Forex News Events You Need To Know
In the fast moving world of currency markets where huge moves can seemingly come from nowhere, it is extremely important for new traders to learn about the various economic indicators and forex news events and releases that shape the markets. Indeed, quickly getting a handle on which data to look out for, what it means, and how to trade it can see new traders quickly become far more profitable and sets up the road to long term success.
Top 10 Chart Patterns Every Trader Should Know
Chart patterns are one of the most effective trading tools for a trader. They are pure price-action, and form on the basis of underlying buying and selling pressure. Chart patterns have a proven track-record, and traders use them to identify continuation or reversal signals, to open positions and identify price targets.
7 Ways to Avoid Forex Scams
The forex industry is recently seeing more and more scams. Here are 7 ways to avoid losing your money in such scams: Forex scams are becoming frequent. Michael Greenberg reports on luxurious expenses, including a submarine bought from the money taken from forex traders. Here’s another report of a forex fraud. So, how can we avoid falling in such forex scams?
What Are the 10 Fatal Mistakes Traders Make
Trading is exciting. Trading is hard. Trading is extremely hard. Some say that it takes more than 10,000 hours to master. Others believe that trading is the way to quick riches. They might be both wrong. What is important to know that no matter how experienced you are, mistakes will be part of the trading process.
The challenge: Timing the market and trader psychology
Successful trading often comes down to timing – entering and exiting trades at the right moments. Yet timing the market is notoriously difficult, largely because human psychology can derail even the best plans. Two powerful emotions in particular – fear and greed – tend to drive trading decisions off course.


