![]() Rick Wright
Rick Wright
Online Trading Academy
Hello traders! This week’s newsletter comes to you from stormy Dallas, Texas. If you ever want to visit, make sure it’s not during springtime! Strong storms with tornadoes and hail are pretty frequent and make outdoor activities hazardous to say the least. The actual topic of this week’s newsletter is that every trading style looks for the same thing, just on different charts.
As you may have heard by now, different traders will look at different time frames depending on how long they want to hold on to their trades; this is their trading style. A day trader may want to be in a trade for a few minutes to a few hours, a swing trader may want to be in for a few days, and a long term trader may want to be in a trade for a few weeks. The interesting thing is that they will often look for the same patterns, just on different time frame charts.
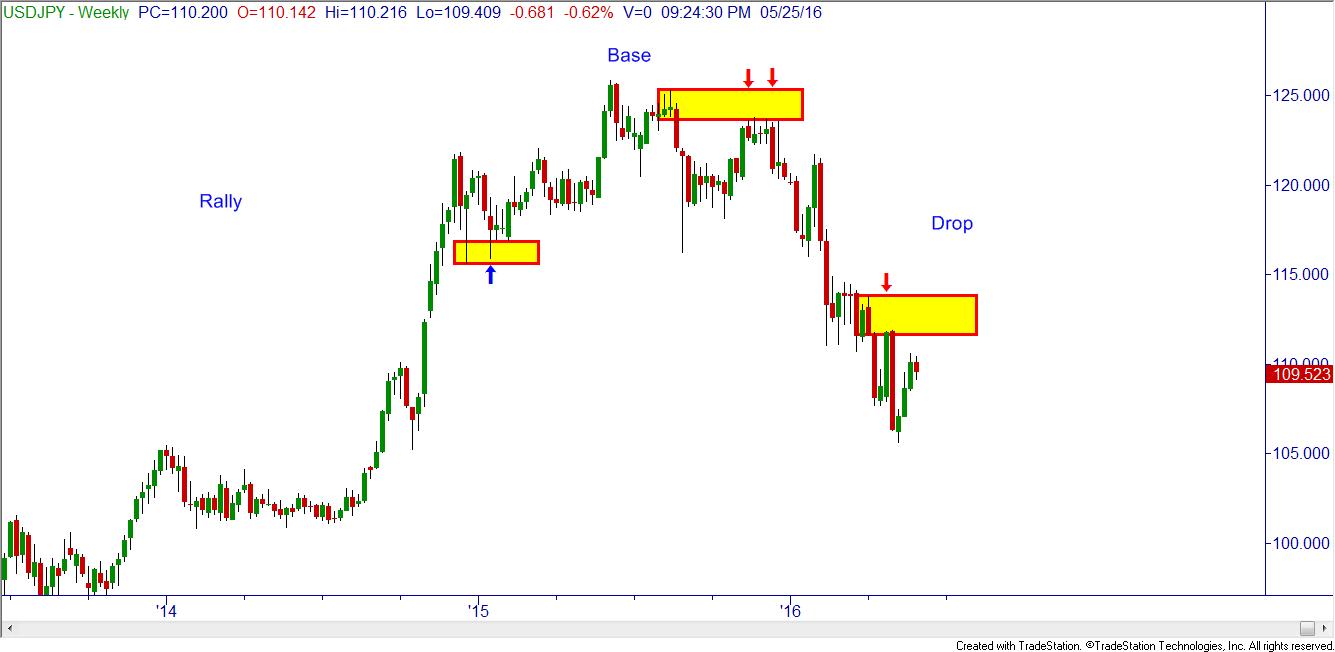
In this weekly chart of the USDJPY, we have a classic rally (uptrend) a base (sideways trend) and a drop (downtrend.) I’ve marked in just a couple of potential entry points this long term trader could have taken. Each of these trades may have lasted a couple of weeks to a couple of months, if the trader was patient enough to hold that long.
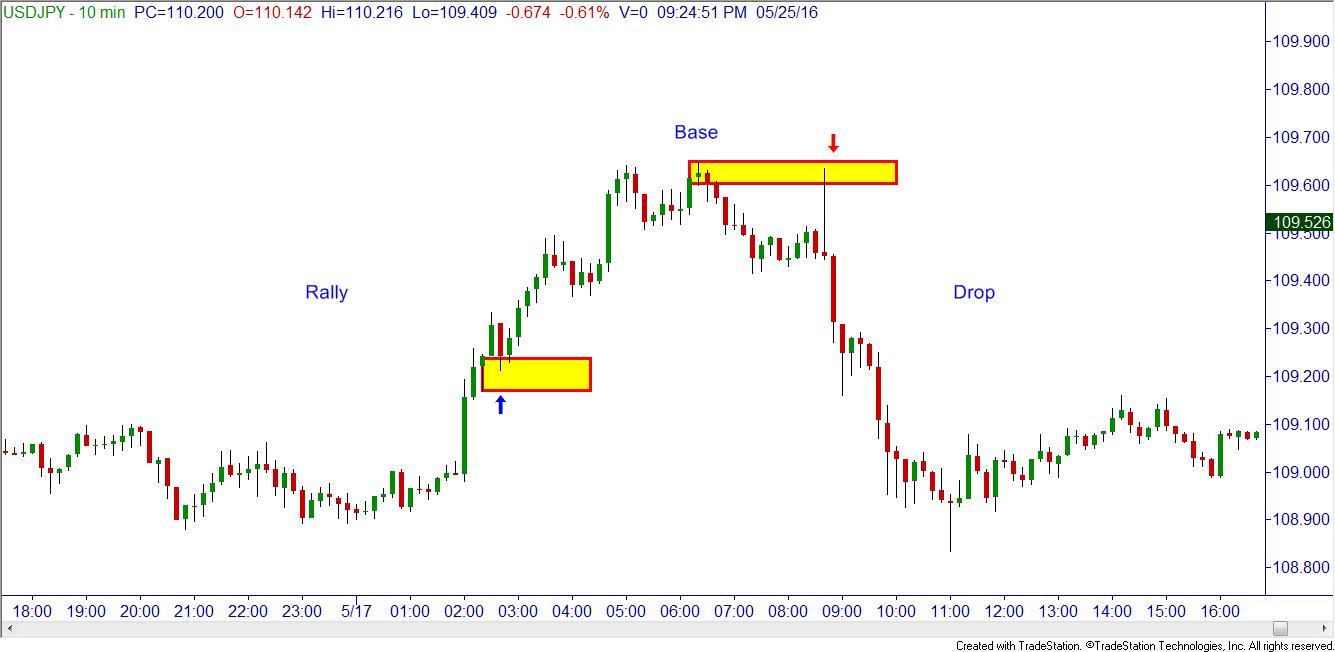
In this ten minute chart of the USDJPY a nearly identical pattern to the weekly chart emerged. A similar rally-base-drop is obvious, and again I’ve marked out a couple of potential trades. Each of these trades would have lasted just a couple of hours. Notice the similarities in what each trader would look for?
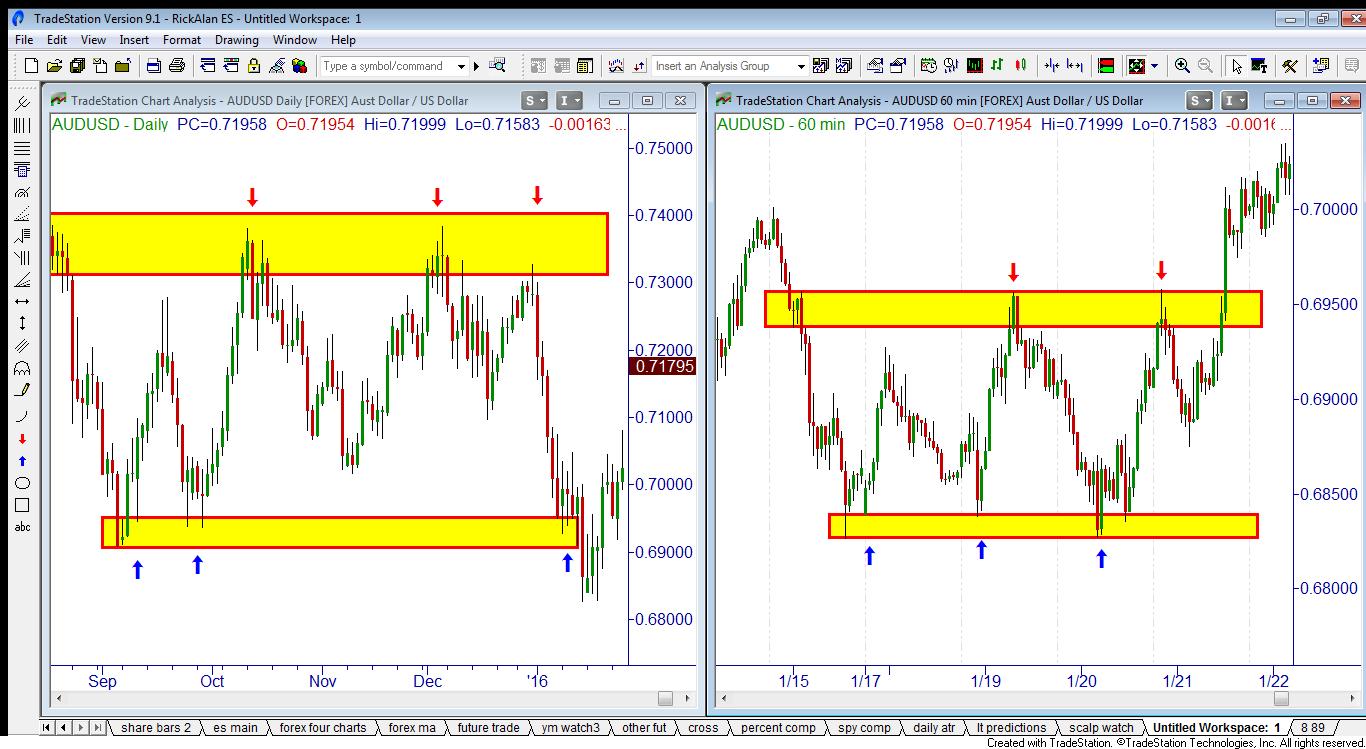
Here are a couple of examples of sideways trading in the AUDUSD. The chart on the left is a daily with a few long and short trades indicated in demand and supply. The chart on the right shows a very similar pattern, just on a one hour chart. Again, notice the similarities? So, the real question is, how can we use this information to make money trading? I’m glad you asked.
Imagine you are looking at a chart of a certain currency pair and aren’t sure how to trade it. Perhaps you are looking at a four hour chart. As this chart develops, I guarantee you that the same (similar) pattern will have already happened at some time in the past, perhaps on a different timeframe.
Here’s an idea: look back in time and see if you can recognize the same pattern and see what happens next. Then you can trade the current live chart accordingly. Of course I want you to sell in a quality supply zone and buy in a quality demand zone, which goes along with Online Trading Academy’s core strategy. But when you know that the past charts can show you what your current charts will probably do, don’t you think trading will be easier?
As I’ve stated in numerous previous newsletters, trading is a lot like driving. Every day your drive to your favorite store is a little bit different, but the basics are the same. Same turns, same roads, just the traffic is a bit different. The same applies to charts and patterns; every chart will be just a bit different but the main patterns constantly repeat over time.
This content is intended to provide educational information only. This information should not be construed as individual or customized legal, tax, financial or investment services. As each individual's situation is unique, a qualified professional should be consulted before making legal, tax, financial and investment decisions. The educational information provided in this article does not comprise any course or a part of any course that may be used as an educational credit for any certification purpose and will not prepare any User to be accredited for any licenses in any industry and will not prepare any User to get a job. Reproduced by permission from OTAcademy.com click here for Terms of Use: https://www.otacademy.com/about/terms
Editors’ Picks

EUR/USD hits two-day highs near 1.1820
EUR/USD picks up pace and reaches two-day tops around 1.1820 at the end of the week. The pair’s move higher comes on the back of renewed weakness in the US Dollar amid growing talk that the Fed could deliver an interest rate cut as early as March. On the docket, the flash US Consumer Sentiment improves to 57.3 in February.

GBP/USD reclaims 1.3600 and above
GBP/USD reverses two straight days of losses, surpassing the key 1.3600 yardstick on Friday. Cable’s rebound comes as the Greenback slips away from two-week highs in response to some profit-taking mood and speculation of Fed rate cuts. In addition, hawkish comments from the BoE’s Pill are also collaborating with the quid’s improvement.

USD/JPY drops back below 157.00, as focus shifts to Japan snap election
USD/JPY is back in the red below 157.00 in the Asian session on Friday. The Japanese Yen recovers ground against the US Dollar amid some profit-taking ahead of Japan's snap general election on Sunday. The preliminary reading of the Michigan Consumer Sentiment Index report for February will be released later on Friday.
Editors’ Picks

EUR/USD: US Dollar to remain pressured until uncertainty fog dissipates Premium
The EUR/USD pair lost additional ground in the first week of February, settling at around 1.1820. The reversal lost momentum after the pair peaked at 1.2082 in January, its highest since mid-2021.

Gold: Volatility persists in commodity space Premium
After losing more than 8% to end the previous week, Gold (XAU/USD) remained under heavy selling pressure on Monday and dropped toward $4,400. Although XAU/USD staged a decisive rebound afterward, it failed to stabilize above $5,000.

GBP/USD: Pound Sterling tests key support ahead of a big week Premium
The Pound Sterling (GBP) changed course against the US Dollar (USD), with GBP/USD giving up nearly 200 pips in a dramatic correction.

Bitcoin: The worst may be behind us
Bitcoin (BTC) price recovers slightly, trading at $65,000 at the time of writing on Friday, after reaching a low of $60,000 during the early Asian trading session. The Crypto King remained under pressure so far this week, posting three consecutive weeks of losses exceeding 30%.

Three scenarios for Japanese Yen ahead of snap election Premium
The latest polls point to a dominant win for the ruling bloc at the upcoming Japanese snap election. The larger Sanae Takaichi’s mandate, the more investors fear faster implementation of tax cuts and spending plans.
RECOMMENDED LESSONS
Making money in forex is easy if you know how the bankers trade!
I’m often mystified in my educational forex articles why so many traders struggle to make consistent money out of forex trading. The answer has more to do with what they don’t know than what they do know. After working in investment banks for 20 years many of which were as a Chief trader its second knowledge how to extract cash out of the market.
5 Forex News Events You Need To Know
In the fast moving world of currency markets where huge moves can seemingly come from nowhere, it is extremely important for new traders to learn about the various economic indicators and forex news events and releases that shape the markets. Indeed, quickly getting a handle on which data to look out for, what it means, and how to trade it can see new traders quickly become far more profitable and sets up the road to long term success.
Top 10 Chart Patterns Every Trader Should Know
Chart patterns are one of the most effective trading tools for a trader. They are pure price-action, and form on the basis of underlying buying and selling pressure. Chart patterns have a proven track-record, and traders use them to identify continuation or reversal signals, to open positions and identify price targets.
7 Ways to Avoid Forex Scams
The forex industry is recently seeing more and more scams. Here are 7 ways to avoid losing your money in such scams: Forex scams are becoming frequent. Michael Greenberg reports on luxurious expenses, including a submarine bought from the money taken from forex traders. Here’s another report of a forex fraud. So, how can we avoid falling in such forex scams?
What Are the 10 Fatal Mistakes Traders Make
Trading is exciting. Trading is hard. Trading is extremely hard. Some say that it takes more than 10,000 hours to master. Others believe that trading is the way to quick riches. They might be both wrong. What is important to know that no matter how experienced you are, mistakes will be part of the trading process.
The challenge: Timing the market and trader psychology
Successful trading often comes down to timing – entering and exiting trades at the right moments. Yet timing the market is notoriously difficult, largely because human psychology can derail even the best plans. Two powerful emotions in particular – fear and greed – tend to drive trading decisions off course.