As an instructor with Online Trading Academy, I distinctly remember how I felt when I was learning all about support, resistance, trends and all the other aspects of traditional technical analysis. Now I am on the other side of the room, I use my own experiences to teach my students in a practical manner. This simplifies the complications and frustrations of FX trading into an approach which is easy to understand. This approach steps over traditional technical analysis, and instead focuses on pure price action in terms of raw supply and demand that has been created by the biggest banks and institutions. If we can learn to follow the footsteps of the biggest market players, the need for any other tools is erased altogether. Buying when the markets show demand and selling when they show us supply will always trump any other form of technical pattern or indicator.
In the world of technical trading we have both patterns and indicators. When I first started to study trading I loved the idea that an indicator would tell me when to buy and sell! It seemed so easy…today it fascinates me how much importance I placed on technical indicators. In the search for the perfect prediction tool, I went from one to another in a desperate attempt to increase my success rate and earn more money from the market. What I failed to understand however, is that indicators are very far from the be-all and end-all of consistently profitable trading. My message for this article is that we all need to remember that any technical indicator is nothing more than a decision support tool, rather than a decision-making tool, and will always lag behind price.
No matter what your indicator of choice may be, they are all a derivative of price itself. All indicators are created with the data which price provides and are only going to give the trader a buy signal after price has started to rally or a sell signal after price has already fallen. This creates a potential trap for the novice as it forces them to buy late or sell late, often missing the move and resulting in another loss. Instead of just relying on the indicator to tell us what to do, we can instead focus on the behavior of price and use the technical tool as a further confirmation vehicle to build our confidence in the position we have taken, in conjunction with a primary decision-making tool, like a zone of supply or demand. For this example, let’s look at some recent intraday action on a chart of GBPUSD:
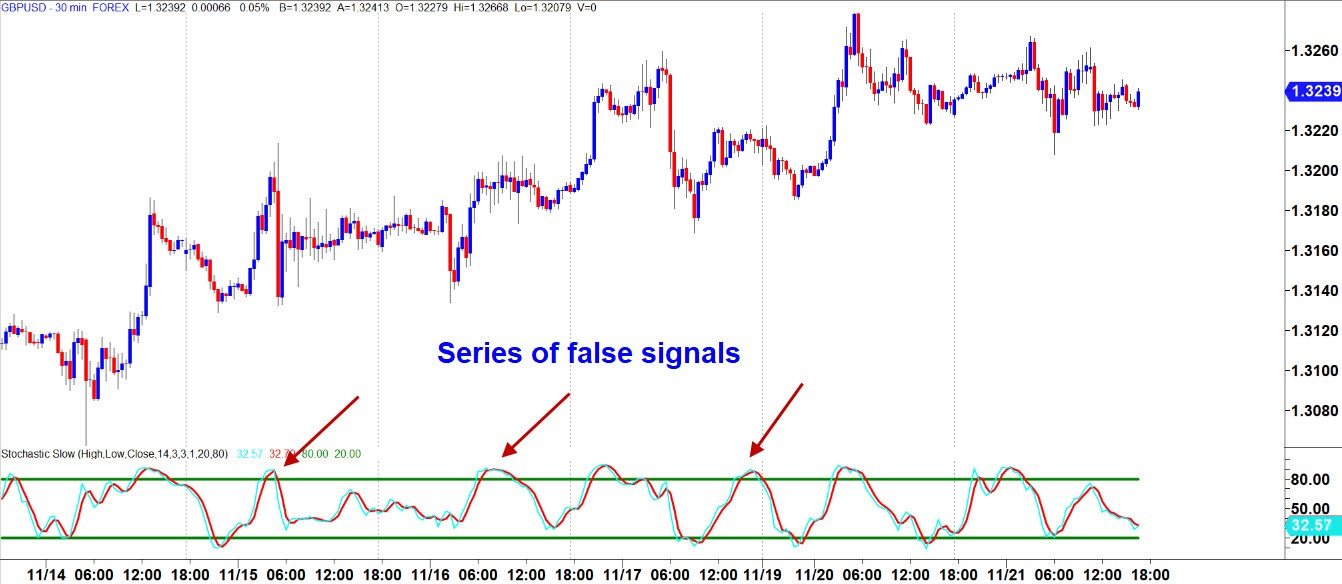
I have attached a Slow Stochastic Indicator with its basic default settings. As you may already know, the upper and lower green lines at 80% and 20% represent conditions of Overbought and Oversold respectively. Should the Stochastic cross into and leave these areas, we are given buy and sell signals for trade opportunities. Notice how we had 3 failed sell signals, mixed with some signals which did worked out a little? Even though the indicator was saying we should sell, the market continued to rise. So, how can we avoid this scenario and use the indicator to give us a real odds enhancer instead? The answer is simple: combine it with the best indicator of all, namely price.
By respecting the unbreakable laws of supply and demand and combining this with the sentiment of trend, we can get a far better feel for high probability trading opportunities. The Stochastic should ideally be used in conjunction with the supply and demand dynamic, along with trend, to make for a powerful combination. See the same chart below:
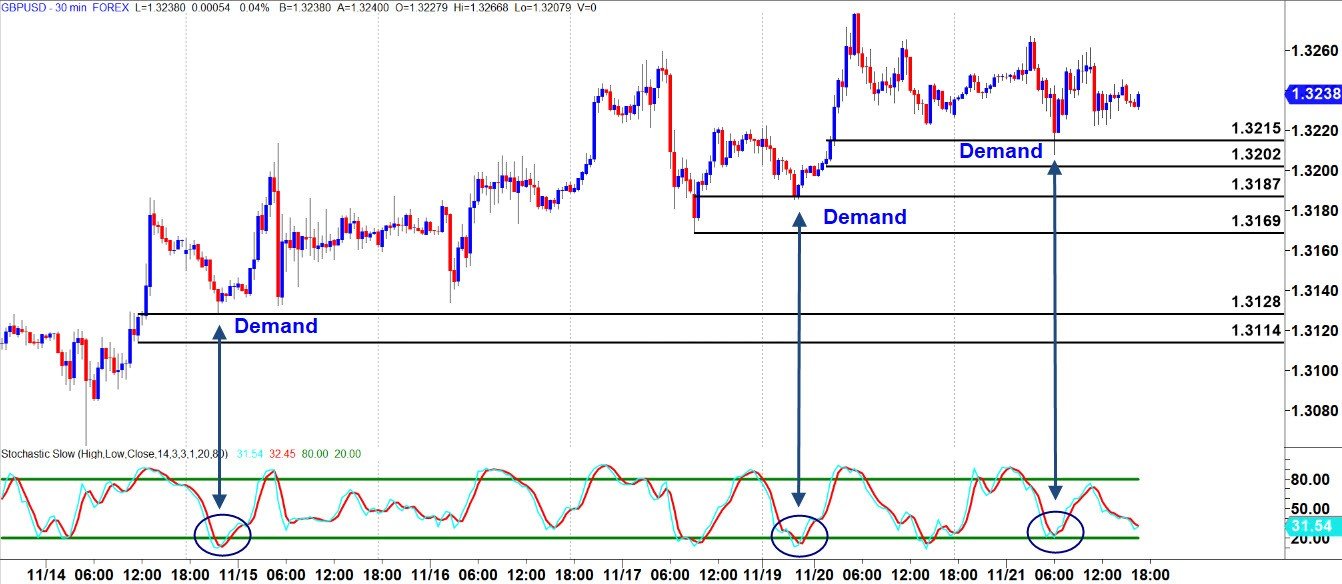
As you can see, when GBPUSD hit price demand zones, we still got the very same buy signals from our indicator but with far better results, especially as we looked to follow the trend as well; which meant we ignored sell signals while the market was rising. In effect, we ran a filtration process in our analysis and looked for a confluence between the technical indicator and price itself by using our demand zones and the uptrend as the primary reason for getting into the market. Buying in an area of demand or selling in an area of supply will always offer us the higher probability trades, and if we use the Stochastic as another level of confirmation there will be a far more likely chance of trade success. In essence, we should look to focus on price first, then the indicator and not the other way around.
With so many indicators available to traders via their charting packages, it is no wonder that the temptation to search for the Holy Grail prevails, but we all need to recognize that these tools should never be used as a crutch to lean on in times of uncertainty. Thorough planning, risk management and objective analysis is all any trader needs for consistent results. Price will always be the very best indication of all; and core strategy of supply and demand zones along with trend will give you a better chance to stay ahead of the pack.
Have a great week and take care,
The information provided is for informational purposes only. It does not constitute any form of advice or recommendation to buy or sell any securities or adopt any investment strategy mentioned. It is intended only to provide observations and views of the author(s) or hosts at the time of writing or presenting, both of which are subject to change at any time without prior notice. The information provided does not have regard to specific investment objectives, financial situation, or specific needs of any specific person who may read it. Investors should determine for themselves whether a particular service or product is suitable for their investment needs or should seek such professional advice for their particular situation. Please see our website for more information: https://bustamanteco.com/privacy-policy/
Editors’ Picks

EUR/USD hits two-day highs near 1.1820
EUR/USD picks up pace and reaches two-day tops around 1.1820 at the end of the week. The pair’s move higher comes on the back of renewed weakness in the US Dollar amid growing talk that the Fed could deliver an interest rate cut as early as March. On the docket, the flash US Consumer Sentiment improves to 57.3 in February.

GBP/USD reclaims 1.3600 and above
GBP/USD reverses two straight days of losses, surpassing the key 1.3600 yardstick on Friday. Cable’s rebound comes as the Greenback slips away from two-week highs in response to some profit-taking mood and speculation of Fed rate cuts. In addition, hawkish comments from the BoE’s Pill are also collaborating with the quid’s improvement.

USD/JPY drops back below 157.00, as focus shifts to Japan snap election
USD/JPY is back in the red below 157.00 in the Asian session on Friday. The Japanese Yen recovers ground against the US Dollar amid some profit-taking ahead of Japan's snap general election on Sunday. The preliminary reading of the Michigan Consumer Sentiment Index report for February will be released later on Friday.
Editors’ Picks

EUR/USD: US Dollar to remain pressured until uncertainty fog dissipates Premium
The EUR/USD pair lost additional ground in the first week of February, settling at around 1.1820. The reversal lost momentum after the pair peaked at 1.2082 in January, its highest since mid-2021.

Gold: Volatility persists in commodity space Premium
After losing more than 8% to end the previous week, Gold (XAU/USD) remained under heavy selling pressure on Monday and dropped toward $4,400. Although XAU/USD staged a decisive rebound afterward, it failed to stabilize above $5,000.

GBP/USD: Pound Sterling tests key support ahead of a big week Premium
The Pound Sterling (GBP) changed course against the US Dollar (USD), with GBP/USD giving up nearly 200 pips in a dramatic correction.

Bitcoin: The worst may be behind us
Bitcoin (BTC) price recovers slightly, trading at $65,000 at the time of writing on Friday, after reaching a low of $60,000 during the early Asian trading session. The Crypto King remained under pressure so far this week, posting three consecutive weeks of losses exceeding 30%.

Three scenarios for Japanese Yen ahead of snap election Premium
The latest polls point to a dominant win for the ruling bloc at the upcoming Japanese snap election. The larger Sanae Takaichi’s mandate, the more investors fear faster implementation of tax cuts and spending plans.
RECOMMENDED LESSONS
Making money in forex is easy if you know how the bankers trade!
I’m often mystified in my educational forex articles why so many traders struggle to make consistent money out of forex trading. The answer has more to do with what they don’t know than what they do know. After working in investment banks for 20 years many of which were as a Chief trader its second knowledge how to extract cash out of the market.
5 Forex News Events You Need To Know
In the fast moving world of currency markets where huge moves can seemingly come from nowhere, it is extremely important for new traders to learn about the various economic indicators and forex news events and releases that shape the markets. Indeed, quickly getting a handle on which data to look out for, what it means, and how to trade it can see new traders quickly become far more profitable and sets up the road to long term success.
Top 10 Chart Patterns Every Trader Should Know
Chart patterns are one of the most effective trading tools for a trader. They are pure price-action, and form on the basis of underlying buying and selling pressure. Chart patterns have a proven track-record, and traders use them to identify continuation or reversal signals, to open positions and identify price targets.
7 Ways to Avoid Forex Scams
The forex industry is recently seeing more and more scams. Here are 7 ways to avoid losing your money in such scams: Forex scams are becoming frequent. Michael Greenberg reports on luxurious expenses, including a submarine bought from the money taken from forex traders. Here’s another report of a forex fraud. So, how can we avoid falling in such forex scams?
What Are the 10 Fatal Mistakes Traders Make
Trading is exciting. Trading is hard. Trading is extremely hard. Some say that it takes more than 10,000 hours to master. Others believe that trading is the way to quick riches. They might be both wrong. What is important to know that no matter how experienced you are, mistakes will be part of the trading process.
The challenge: Timing the market and trader psychology
Successful trading often comes down to timing – entering and exiting trades at the right moments. Yet timing the market is notoriously difficult, largely because human psychology can derail even the best plans. Two powerful emotions in particular – fear and greed – tend to drive trading decisions off course.