![]() Brandon Wendell, CMT
Brandon Wendell, CMT
Brandon Wendell
This is the time of year where market experts are publishing their views and forecasts for the upcoming year. Never have we faced as much uncertainty as we are now with the new administration starting in the United States. Online Trading Academy is trying to prepare their students for what may come by holding special webinars such as the one held last week, “Five Ways that a Trump Presidency Will Affect your Wallet.”
My last year forecast for a market slowdown and potential market correction did not quite happen. Fortunately, I did not try to predict the exact top of the markets as we saw a rally to all-time highs in the equity markets. As a trader or investor, we need to be flexible with our opinions. We can be wrong, the market cannot.
Most professionals are baffled by the strength of the markets that occurred in the aftermath of the US election. This strong move that has occurred is not likely to continue without some profit taking. This profit taking would cause prices to move in a bearish manner and could also trigger investors’ fears. This would exacerbate the downward move in the equity markets. When this move will occur is the biggest question mark.
We do not have any overhead supply to identify exactly where this profit taking or market correction will begin. Instead, there will be two ways to hopefully predict when and if the correction is occurring. The first method is to use a technical tool called Fibonacci Expansions or Projections. This is a tool that is nowhere as accurate as finding supply or demand on our charts, but is still available when we do not have those levels due to all-time highs.
The second method is to wait until the market correction has already begun, by identifying the downtrend once it has already begun. While this method would have you enter the market late, it is better than losing money by entering too soon.
Turning to the charts, we have applied the Fibs to each of the US major equity indexes. Starting with the S&P 500 index, we can see that we are definitely in a bullish trend. We did see price stalling and close to a 200-point retracement when prices hit the first expansion point late last year.
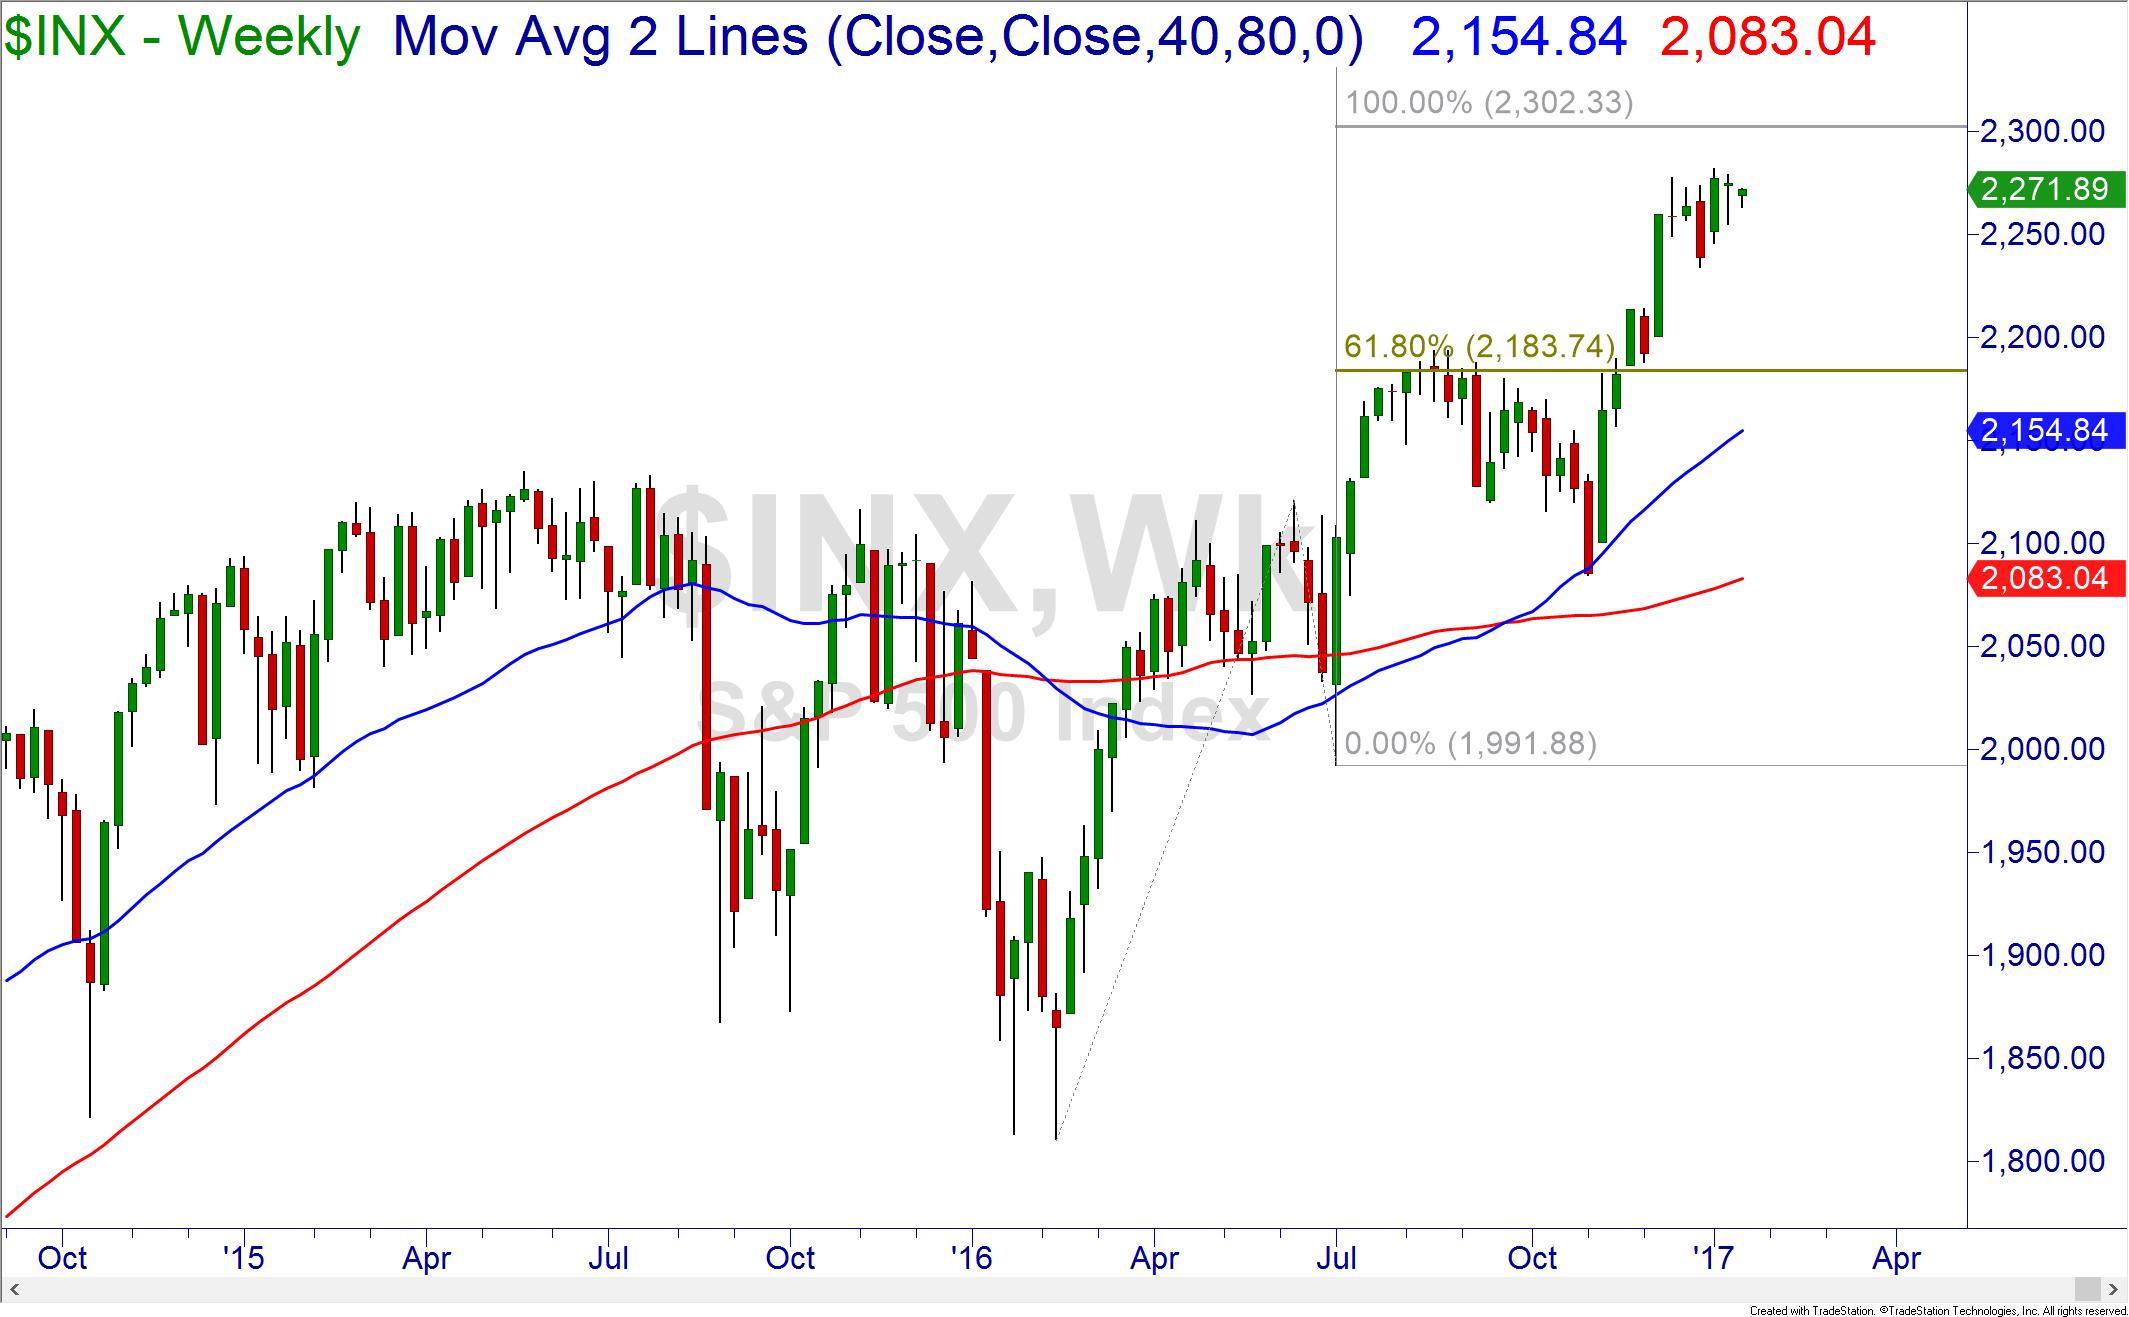
The next expansion level is soon approaching at 2300 and prices have already stalled just prior to that point. Should the bullish trend stay intact, a retracement to the blue 40 week SMA before a bounce at approximately 2180 is likely. If the bullish trend changes to a full market correction, the S&P could fall much further as there are not any fresh demand zones for nearly 800 points!
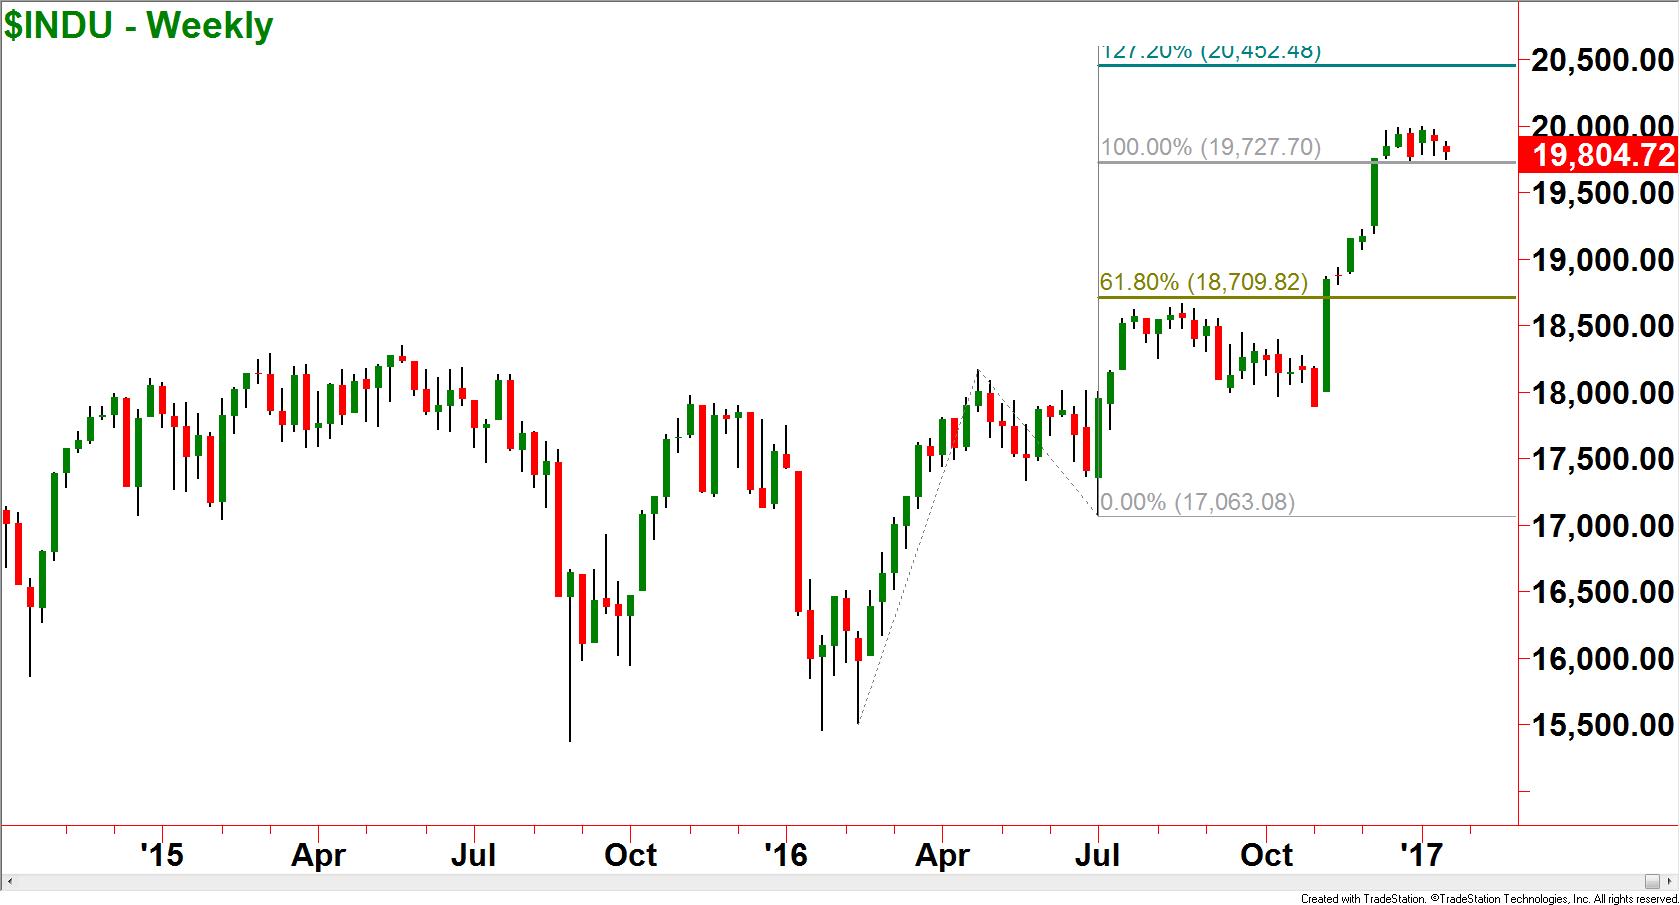
Dow 20,000 has been a mantra on business television for some time now. Looking at the chart, we have stalled in the area of two expansion levels already. Should we get another push higher in price, the next wall sits just under 20,500. If the markets correct after that, there is a small demand zone near 18,000.
The Nasdaq 100 index has been moving along with its brothers as well. Prices only stalled at one level and appear to be stronger currently than they are in the Dow or S&P. The next level is about 5100 and fast approaching.

Now that we have examined the “risk on” markets, let’s view the “risk off” or safe-haven securities such as gold and the US Treasuries.
Gold has been in a serious decline since before the election but has definitely accelerated subsequently. There is hope for the gold bugs if the equity markets top out. The $1100 level is a pretty strong demand zone on the weekly charts. We have experienced a 38% retracement of the election decline but could easily test that demand before reversing course.

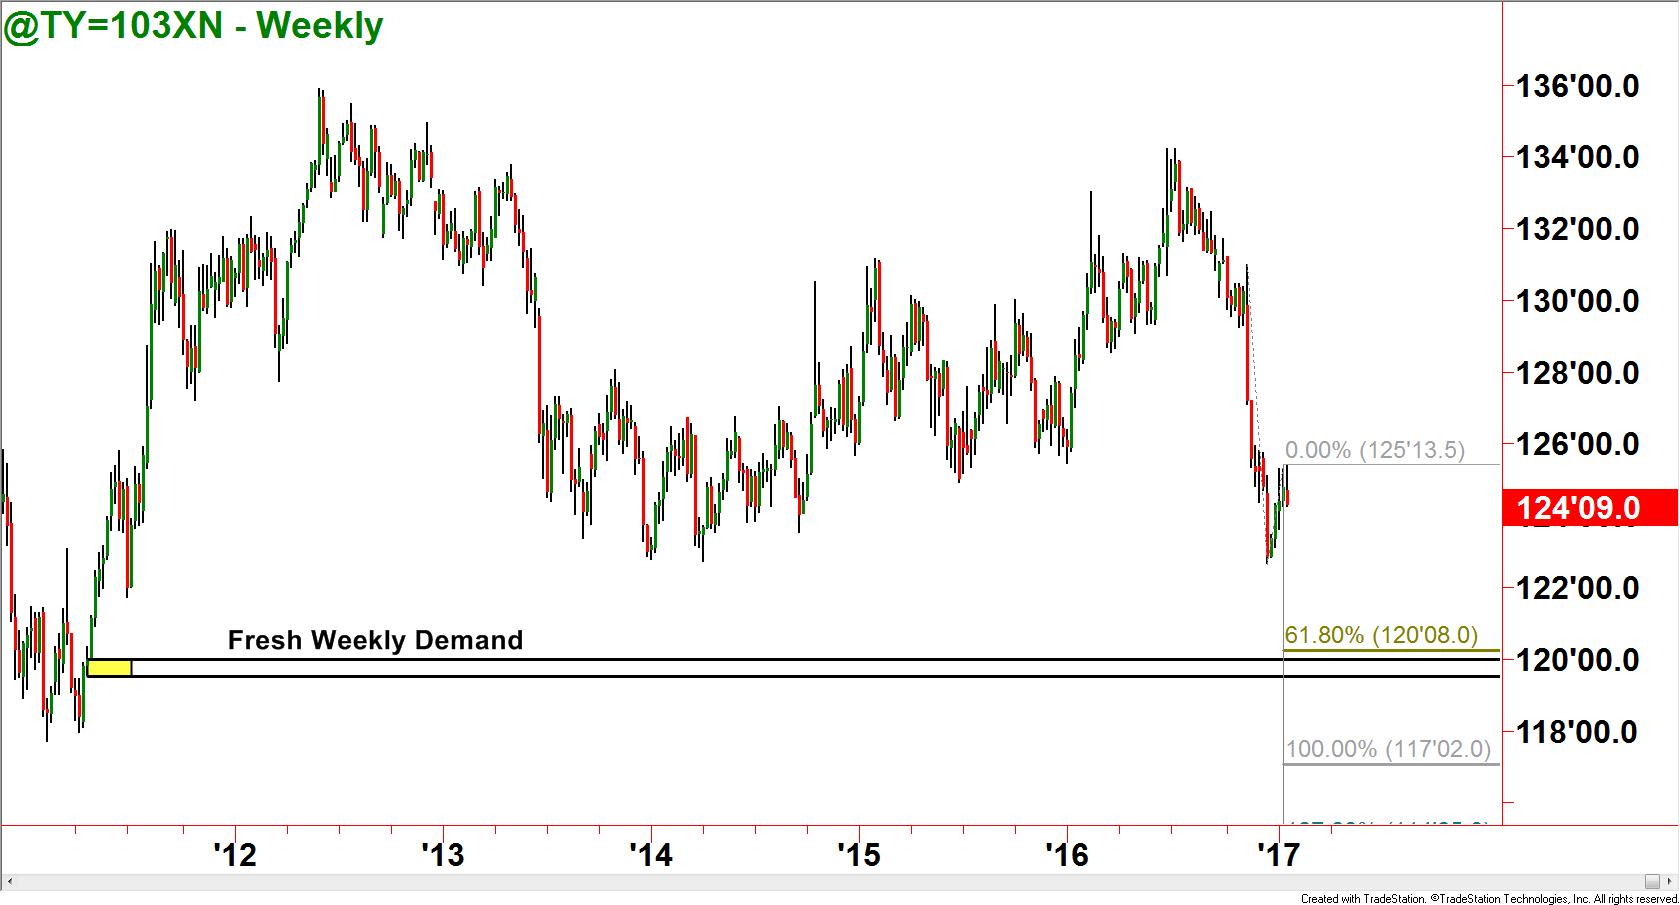
With the Federal Reserve decreasing their Quantitative Easing program, the price of treasuries has dropped dramatically while interest rates have risen. The trend looks to continue until the next meeting on February 1st. The charts support this as we have fresh demand at the same level as the Fibonacci Expansion level.
In all, 2017 looks to be an exciting year for those traders and investors who are able to separate themselves from emotions and focus on their levels visible on the charts. If you are unsure, make sure you attend your XLTs or enroll in a course at your local Online Trading Academy center today!
Neither Freedom Management Partners nor any of its personnel are registered broker-dealers or investment advisers. I will mention that I consider certain securities or positions to be good candidates for the types of strategies we are discussing or illustrating. Because I consider the securities or positions appropriate to the discussion or for illustration purposes does not mean that I am telling you to trade the strategies or securities. Keep in mind that we are not providing you with recommendations or personalized advice about your trading activities. The information we are providing is not tailored to any individual. Any mention of a particular security is not a recommendation to buy, sell, or hold that or any other security or a suggestion that it is suitable for any specific person. Keep in mind that all trading involves a risk of loss, and this will always be the situation, regardless of whether we are discussing strategies that are intended to limit risk. Also, Freedom Management Partners’ personnel are not subject to trading restrictions. I and others at Freedom Management Partners could have a position in a security or initiate a position in a security at any time.
Editors’ Picks

EUR/USD hits two-day highs near 1.1820
EUR/USD picks up pace and reaches two-day tops around 1.1820 at the end of the week. The pair’s move higher comes on the back of renewed weakness in the US Dollar amid growing talk that the Fed could deliver an interest rate cut as early as March. On the docket, the flash US Consumer Sentiment improves to 57.3 in February.

GBP/USD reclaims 1.3600 and above
GBP/USD reverses two straight days of losses, surpassing the key 1.3600 yardstick on Friday. Cable’s rebound comes as the Greenback slips away from two-week highs in response to some profit-taking mood and speculation of Fed rate cuts. In addition, hawkish comments from the BoE’s Pill are also collaborating with the quid’s improvement.

USD/JPY drops back below 157.00, as focus shifts to Japan snap election
USD/JPY is back in the red below 157.00 in the Asian session on Friday. The Japanese Yen recovers ground against the US Dollar amid some profit-taking ahead of Japan's snap general election on Sunday. The preliminary reading of the Michigan Consumer Sentiment Index report for February will be released later on Friday.
Editors’ Picks

EUR/USD: US Dollar to remain pressured until uncertainty fog dissipates Premium
The EUR/USD pair lost additional ground in the first week of February, settling at around 1.1820. The reversal lost momentum after the pair peaked at 1.2082 in January, its highest since mid-2021.

Gold: Volatility persists in commodity space Premium
After losing more than 8% to end the previous week, Gold (XAU/USD) remained under heavy selling pressure on Monday and dropped toward $4,400. Although XAU/USD staged a decisive rebound afterward, it failed to stabilize above $5,000.

GBP/USD: Pound Sterling tests key support ahead of a big week Premium
The Pound Sterling (GBP) changed course against the US Dollar (USD), with GBP/USD giving up nearly 200 pips in a dramatic correction.

Bitcoin: The worst may be behind us
Bitcoin (BTC) price recovers slightly, trading at $65,000 at the time of writing on Friday, after reaching a low of $60,000 during the early Asian trading session. The Crypto King remained under pressure so far this week, posting three consecutive weeks of losses exceeding 30%.

Three scenarios for Japanese Yen ahead of snap election Premium
The latest polls point to a dominant win for the ruling bloc at the upcoming Japanese snap election. The larger Sanae Takaichi’s mandate, the more investors fear faster implementation of tax cuts and spending plans.
RECOMMENDED LESSONS
Making money in forex is easy if you know how the bankers trade!
I’m often mystified in my educational forex articles why so many traders struggle to make consistent money out of forex trading. The answer has more to do with what they don’t know than what they do know. After working in investment banks for 20 years many of which were as a Chief trader its second knowledge how to extract cash out of the market.
5 Forex News Events You Need To Know
In the fast moving world of currency markets where huge moves can seemingly come from nowhere, it is extremely important for new traders to learn about the various economic indicators and forex news events and releases that shape the markets. Indeed, quickly getting a handle on which data to look out for, what it means, and how to trade it can see new traders quickly become far more profitable and sets up the road to long term success.
Top 10 Chart Patterns Every Trader Should Know
Chart patterns are one of the most effective trading tools for a trader. They are pure price-action, and form on the basis of underlying buying and selling pressure. Chart patterns have a proven track-record, and traders use them to identify continuation or reversal signals, to open positions and identify price targets.
7 Ways to Avoid Forex Scams
The forex industry is recently seeing more and more scams. Here are 7 ways to avoid losing your money in such scams: Forex scams are becoming frequent. Michael Greenberg reports on luxurious expenses, including a submarine bought from the money taken from forex traders. Here’s another report of a forex fraud. So, how can we avoid falling in such forex scams?
What Are the 10 Fatal Mistakes Traders Make
Trading is exciting. Trading is hard. Trading is extremely hard. Some say that it takes more than 10,000 hours to master. Others believe that trading is the way to quick riches. They might be both wrong. What is important to know that no matter how experienced you are, mistakes will be part of the trading process.
The challenge: Timing the market and trader psychology
Successful trading often comes down to timing – entering and exiting trades at the right moments. Yet timing the market is notoriously difficult, largely because human psychology can derail even the best plans. Two powerful emotions in particular – fear and greed – tend to drive trading decisions off course.