XLM Price Prediction: Stellar bulls gearing up for a big move above $0.2870
- XLM/USD is gathering strength for further upside beyond $0.30.
- Stellar price set to confirm an ascending triangle breakout on the 4H chart.
- XLM bulls find immediate support at 21-SMA at $0.2725.

Stellar Lumens (XLM/USD) is alternating between gains and losses around $0.2800 so far this Saturday, looking out for a strong bullish catalyst to extend the recent uptrend.
XLM price is consolidating after four consecutive daily gains, having failed to secure its hold above the $0.30 level. The altcoin remains on track to book the second straight weekly advance, adding nearly 7% over the past seven days.
XLM/USD’s path of least resistance remains to the upside
Stellar Lumen’s four-hour chart shows that the price has been traversing within an ascending triangle formation since July 22.
XLM price remains primed for a bullish breakout from the triangle, as it continues to challenge the horizontal trendline resistance at $0.2870.
If the bulls manage to find a strong foothold above the latter on a four-hourly candlestick closing basis, then a rally towards the pattern target measured at $0.3230 could be well on the cards in the near term.
However, on its way northwards, the $0.30 psychological level could challenge the bullish commitments.
The Relative Strength Index (RSI), currently pointing up at 58.51, backs XLM’s constructive outlook.
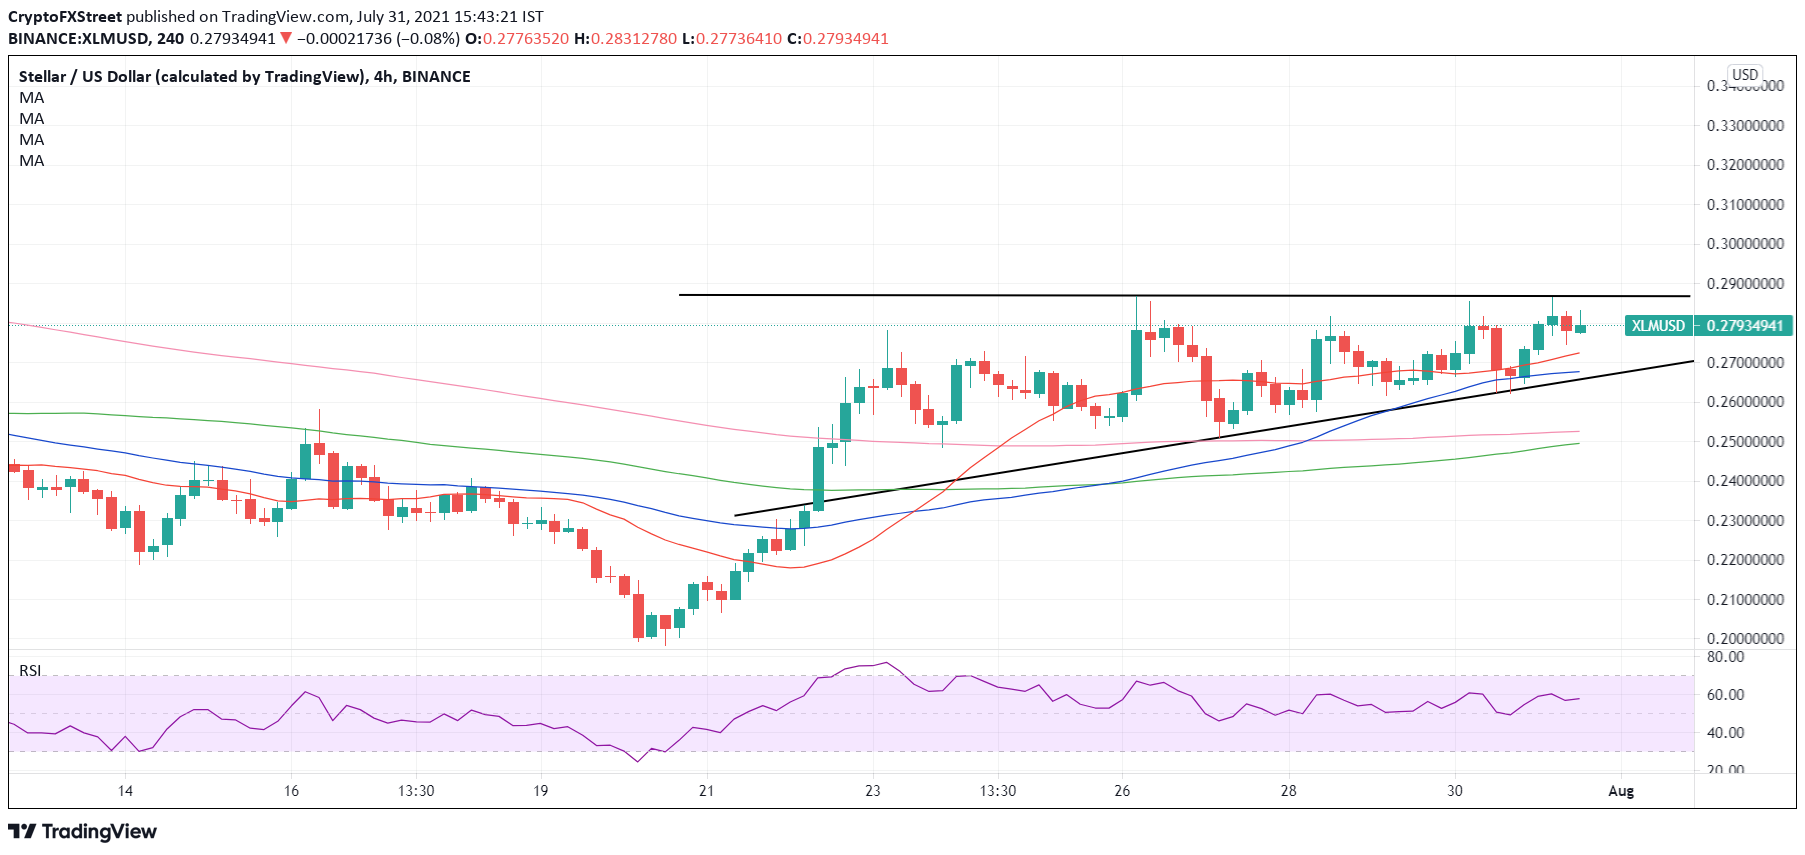
XLM/USD: Four-hour chart
Alternatively, the upward-sloping 21-Simple Moving Average (SMA) at $0.2725 could limit any pullbacks from higher levels.
Sellers will then keep their sight on the next downside target around $0.2670, where the mildly bullish 50-SMA and rising trendline (triangle) support coincide.
A sustained break below that confluence support would yield a downside breakout from the triangle, exposing the critical 200-SMA cushion at $0.2526.
Author

Dhwani Mehta
FXStreet
Residing in Mumbai (India), Dhwani is a Senior Analyst and Manager of the Asian session at FXStreet. She has over 10 years of experience in analyzing and covering the global financial markets, with specialization in Forex and commodities markets.


