- Bitcoin price is down 17% since the $73,777 all-time high recorded on March 14.
- Subsiding FOMO coupled with growing FUD suggests a recovery in price amid more rational trading behavior and price stability.
- Santiment analysts report soaring bear market mentions with markets known to go the other way relative to trader expectations.
Cryptocurrency market is bleeding, with Bitcoin (BTC) price leading altcoins south in a broader market crash. The elevated risk levels have bulls sitting on their hands, but analysts from Santiment say this bleed may only be cauterized right before or shortly after the halving.
Bitcoin price crash catalysts
Bitcoin price has been dumping since April 9. However, the slump seems to have intensified over the past few days, catalyzed by three key reasons.
- The confrontation between Iran and Israel
In the latest development, the former Mossad intelligence chief has said that they could strike Iran's nuclear facilities. This assertion could worsen the situation not only in the conflict but also in the market as it inspired panic. Investors could intensify their flight to safety in favor of more traditional assets like gold and silver.
- Fed Chair Jerome Powell’s recent hawkish stand
In a Tuesday announcement, Federal Reserve chair Jerome Powell indicated that the agency is still not very confident about inflation. Specifically, Powell said they could keep the interest rates higher for longer. The reversal was surprising, given the market was anticipating a rate cut in June, but now there is doubt about whether any rate cut is in sight.
- Greed among retail traders
Retail greed has also played a role in the downtrend, seen with the way this class of traders continues to long every dip with high leverage. Even in the face of recent corrections, the funding rate remained positive, evidence of market greed.
Trader and analyst @Ashcryptoreal on X says:
Unless and until we see a full reset or even negative funding for some time, the market could keep going sideways/down.
Read More: Bitcoin price unfazed as Fed’s hope for a pivot gets overwhelmed
Why a recovery could be looming
According to Santiment’s research, the bull market is likely in the conclusion phase after a 17% fall from the $73,777 all-time high. This assumption is based on the findings that bear market mentions are increasing.
If history is enough to go by, prices tend to go the opposite way relative to market expectations, and with the fear of missing out (FOMO) dwindling against a rise in fear, uncertainty, and doubt (FUD), the unique mix of these metrics could lead to a recovery either right before the halving or shortly after.
According to the #crypto crowd, the #bullmarket has essentially come to an end after #Bitcoin's -16% market value drop since the #AllTimeHigh of $73.6K hit back on March 14th. At the same time, #bearmarket mentions are increasing. Historically, prices move the opposite… pic.twitter.com/1fnGePwMV0
— Santiment (@santimentfeed) April 17, 2024
The described correlation between FOMO and FUD results in hype and speculative buying interest fading, which is a recipe for a more rational trading behavior and price stability. If these trends continue, it may indicate an upcoming positive shift in sentiment.
Either way, risk management is key in navigating market volatility influenced by these psychological factors.
Open Interest, funding rate FAQs
Higher Open Interest is associated with higher liquidity and new capital inflow to the market. This is considered the equivalent of increase in efficiency and the ongoing trend continues. When Open Interest decreases, it is considered a sign of liquidation in the market, investors are leaving and the overall demand for an asset is on a decline, fueling a bearish sentiment among investors.
Funding fees bridge the difference between spot prices and prices of futures contracts of an asset by increasing liquidation risks faced by traders. A consistently high and positive funding rate implies there is a bullish sentiment among market participants and there is an expectation of a price hike. A consistently negative funding rate for an asset implies a bearish sentiment, indicating that traders expect the cryptocurrency’s price to fall and a bearish trend reversal is likely to occur.
At the time of writing, Bitcoin price is trading for $61,277, defending against further downside as it tests the demand zone between $60,364 and $62,412. A candlestick close below the midline of this order block at $61,421 would confirm a further downtrend.
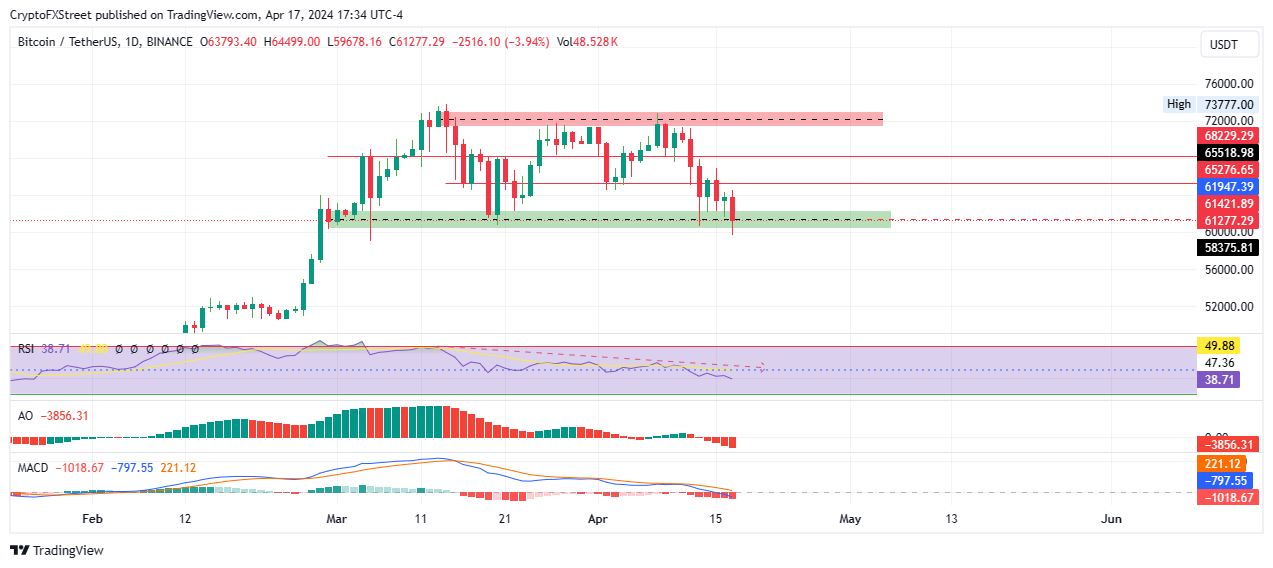
BTC/USDT 1-day chart
Information on these pages contains forward-looking statements that involve risks and uncertainties. Markets and instruments profiled on this page are for informational purposes only and should not in any way come across as a recommendation to buy or sell in these assets. You should do your own thorough research before making any investment decisions. FXStreet does not in any way guarantee that this information is free from mistakes, errors, or material misstatements. It also does not guarantee that this information is of a timely nature. Investing in Open Markets involves a great deal of risk, including the loss of all or a portion of your investment, as well as emotional distress. All risks, losses and costs associated with investing, including total loss of principal, are your responsibility. The views and opinions expressed in this article are those of the authors and do not necessarily reflect the official policy or position of FXStreet nor its advertisers. The author will not be held responsible for information that is found at the end of links posted on this page.
If not otherwise explicitly mentioned in the body of the article, at the time of writing, the author has no position in any stock mentioned in this article and no business relationship with any company mentioned. The author has not received compensation for writing this article, other than from FXStreet.
FXStreet and the author do not provide personalized recommendations. The author makes no representations as to the accuracy, completeness, or suitability of this information. FXStreet and the author will not be liable for any errors, omissions or any losses, injuries or damages arising from this information and its display or use. Errors and omissions excepted.
The author and FXStreet are not registered investment advisors and nothing in this article is intended to be investment advice.
Recommended Content
Editors’ Picks
LINK price jumps 10% as Chainlink races toward tokenization of funds

Chainlink (LINK) price has remained range-bound for a while, stuck between the $16.00 roadblock to the upside and $13.08 to the downside. However, in light of recent revelations, the token, which powers the verifiable web of the decentralized computing platform, may have further upside potential.
Gaming token Notcoin down by almost 50% after airdrop launch

NOT experienced a rapid decline hours after its anticipated launch on Thursday, shedding almost 50% of its value. This continues the cycle of huge selling pressure faced by cryptocurrency airdrops after their launch, especially the launch of gaming tokens in recent times.
Ethereum drops below $3,000 again, spot ETH ETF sparks debate in crypto community

Ethereum again went below the $3,000 key level on Thursday after posting signs of a rally. The price action follows predictions from the community regarding the SEC's decision on spot ETH ETFs next week.
SUI price defends $0.8880 amid multiple Sui network integrations
Sui (SUI) price failed to heed to the broader market recovery on Wednesday, extending the fall to the $0.8880 support level. However, with multiple network integrations in the works, the altcoin has pivoted around this level and is scaling a recovery.
Bitcoin: Why BTC is close to a bottom

Bitcoin (BTC) price efforts of a recovery this week have been countered by selling pressure during the onset of the American session. However, the downside potential appears to have been capped.