When Will Bitcoin Hit Its Next Big Peak? How High Will It Go?

How do you estimate the “true” value of Bitcoin? Or better yet, how do you predict what it will be worth at its next major peak?
Unlike stock valuation models, there’s no company, no profit-and-loss statement and no price-to-earnings ratio. There’s also no balance sheet. Ergo, no asset-valuation model.
Still, some folks have come up with valuation formulas. All are hotly debated.
Chris Burniske, for example, bases his evaluation on an “equation-of-exchange” model.
Kyle Samani seeks to do it based on a “market-share-capture” model.
Valiant attempts! Trouble is, both rely on some slippery assumptions, like the velocity of money.
In the midst of this controversy-laden polemic, I’m particularly intrigued by the “Stock-to-Flow (S2F)” valuation model proposed by “PlanB,” a quant crypto analyst.
It’s one of the most specific — and accurate — crypto valuation models I’ve seen so far. All based on actual measurable factors that reflect scarcity.
What exactly is Stock-to-Flow?
Very simply, it’s the current circulating supply divided by the annual amount produced. And it can work for virtually any commodity.
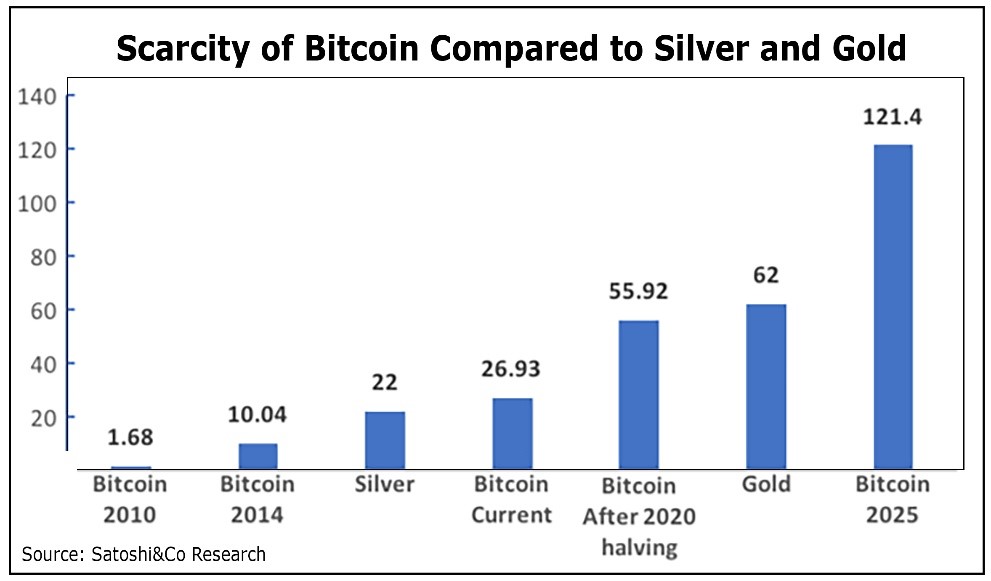
Take gold, for instance. In the chart above, gold has a Stock-to-Flow (S2F) value of 62.
Meaning at today’s rate of production, it would take 62 years to reproduce the current supply of mined gold in the world.
That’s relatively scarce. In fact, based on this metric, gold is nearly three times scarcer than silver, which has a current S2F of just 22.
Now, care to guess what Bitcoin’s Stock-to-Flow ratio is right now?
Answer: Nearly 27.
That’s right. Based strictly on this measure and holding constant all other factors, it would take 27 years to reproduce the current Bitcoin supply.
Is that scarcity metric similar to silver’s? Yes … for now. But …
Approximately every four years, the Bitcoin protocol mandates a major change called “halving” — a 50% reduction in the block reward that miners receive for creating new Bitcoin. And the next halving event is expected in or around May 2020.
At present, BTC is produced at a rate of 12.5 BTC (i.e., the block reward) every 10 minutes. Come May 2020, this block reward will be halved to 6.25 BTC.
And I repeat: That halving is mandated by the Bitcoin protocol. It must happen approximately every four years.
How does the Bitcoin halving fit into the Stock-to-Flow model?
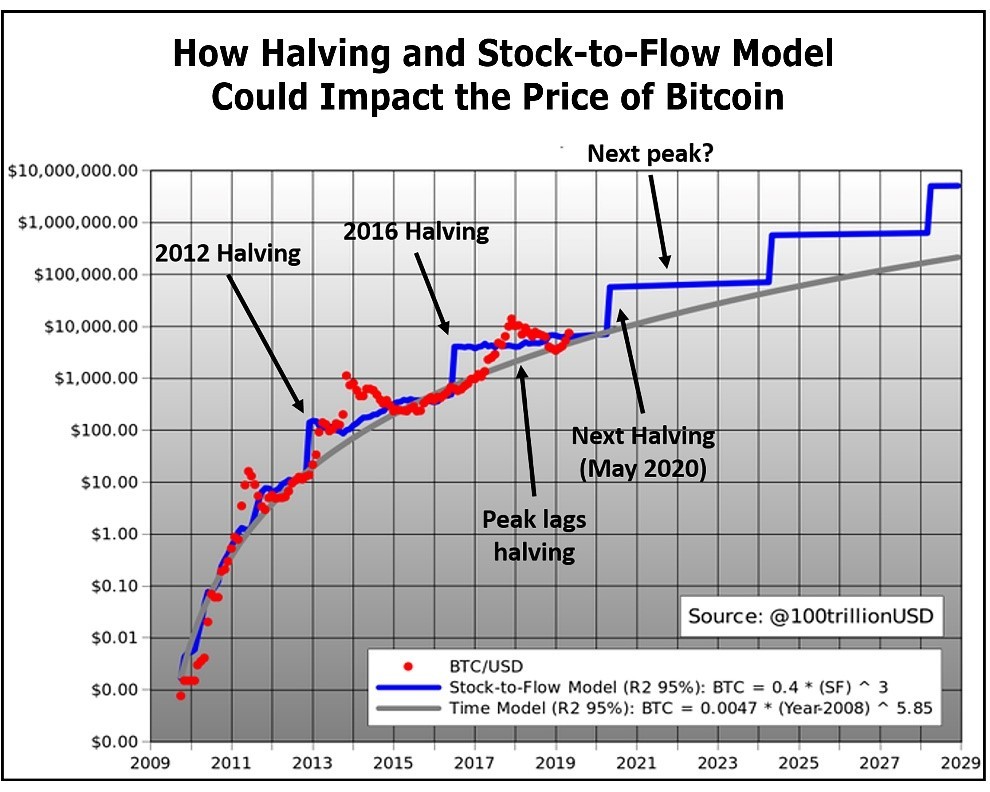
The chart above provides some answers. It tracks and predicts the price of Bitcoin based on the Stock-to-Flow model and the periodic halving of Bitcoin.
In essence, here’s how it works …
First, the blue line shows the price of Bitcoin as predicted by the Stock-to-Flow model.
Second, the red dotted line shows the actual Bitcoin prices to date.
Third, we ask the critical question: How well does it work? The answer…
Model Matches Real-World Prices to the Tune of 95%
Naturally, in the real world, there are periodic spikes followed by sharp pullbacks. But overall, Bitcoin prices follow the staircase-shaped Stock-to-Flow prediction remarkably well.
One way of evaluating its accuracy is with a statistical metric called R2, which measures how closely the data fits the model. And in this case, the R2 stat is at 95%. A very good fit.
Another clue to the model’s accuracy: The staircase forecast of the model (blue line) can be converted into a smooth curve (the gray line). Over time, that curve has proven to be a support line for the price of Bitcoin.
In other words, when the Bitcoin market falls, it tends to bottom near or at that line!
A third argument for the validity of the model is the actual impact of past halvings on the price of Bitcoin, as shown in the table below …
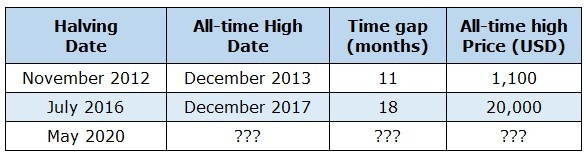
After its halving in 2012, Bitcoin moved sharply higher and made a new all-time high 11 months later.
After the halving of 2016, it again moved sharply higher, this time making new all-time highs 18 months later.
All of which begs the next two questions: Assuming past patterns continue…
When Will Bitcoin Reach Its Next High? And How Much Will It Be Worth?
Unfortunately, Bitcoin is too young to answer either question with certainty. We barely have a decade of trading history. And data from the early part of that decade, when Bitcoin trading was illiquid, is not very reliable.
With that caveat, however, it’s not unreasonable to set some expectations, as follows:
First, we know that the next halving will occur around May of next year. So, based on the 2012 and 2016 halvings, the timing of next Bitcoin high should be about one to two years later — as early as May 2021 or as late as May 2022.
Then, we’ll come to the most important number of all: Bitcoin’s most likely price at that next high.
No one can foretell what surprises the future may deliver. But after the 2020 halving, the model predicts a Bitcoin value between $50,000 to $100,000.
Moreover, we know that in all past all-time highs, the actual peak has surpassed the model’s predicted high for a brief time.
What happens if Bitcoin hits those predicted prices? The corresponding market capitalizations for Bitcoin at $50,000 and $100,000 would be approximately $920 billion and $1.8 trillion, respectively.
Sound like a pipe dream? Well, then consider that $1.8 trillion is actually small compared to the total market cap of gold at $7 trillion.
Just bear one thing in mind: The next halving won’t happen until May 2020. So, there is still some time to accumulate Bitcoin and other high-rated cryptos before the powerful forces behind this model begin kick in.
Author

Bruce Ng, Ph.D
Weiss Crypto Ratings
Dr. Bruce Ng is a respected educator in the field of Distributed Ledger Technology (DLT) and has been a lead crypto-tech analyst for Weiss Cryptocurrency Ratings since shortly after their launch. He combines the strict discipline of a Ph.D.


