Uniswap price validates bearish reversal pattern, causing $2.2 million worth of liquidations
- Uniswap price is forming a bearish reversal Head and Shoulders pattern, nearly validating it by falling below $5.81.
- The target price, according to the pattern, is set at $3.81, marking a 34% correction from the breakout level.
- Long traders have witnessed liquidations worth $2.2 million, 25 times more than the short liquidations.

Uniswap (UNI) price has declined significantly in the past few days. Despite noting a good run towards the beginning of the month, corrections came through, and the altcoin’s value declined. From a technical perspective, the recent price declines are set to extend as price action has formed a bearish reversal pattern.
Uniswap price falls hit bulls
Uniswap price has declined by more than 15% in the last seven days and is likely set to post further declines. Recent hits were absorbed by the bulls who had been betting on a price rise, which failed at UNI and fell through the support of $6.00.
As a result, the traders who had been holding out their long contracts saw liquidations coming up to more than $2.2 million. In comparison, the traders that had opened short contracts noted only $87,000 worth of liquidations. This means that the bulls observed 25 times higher liquidations than the bears in the span of a week.
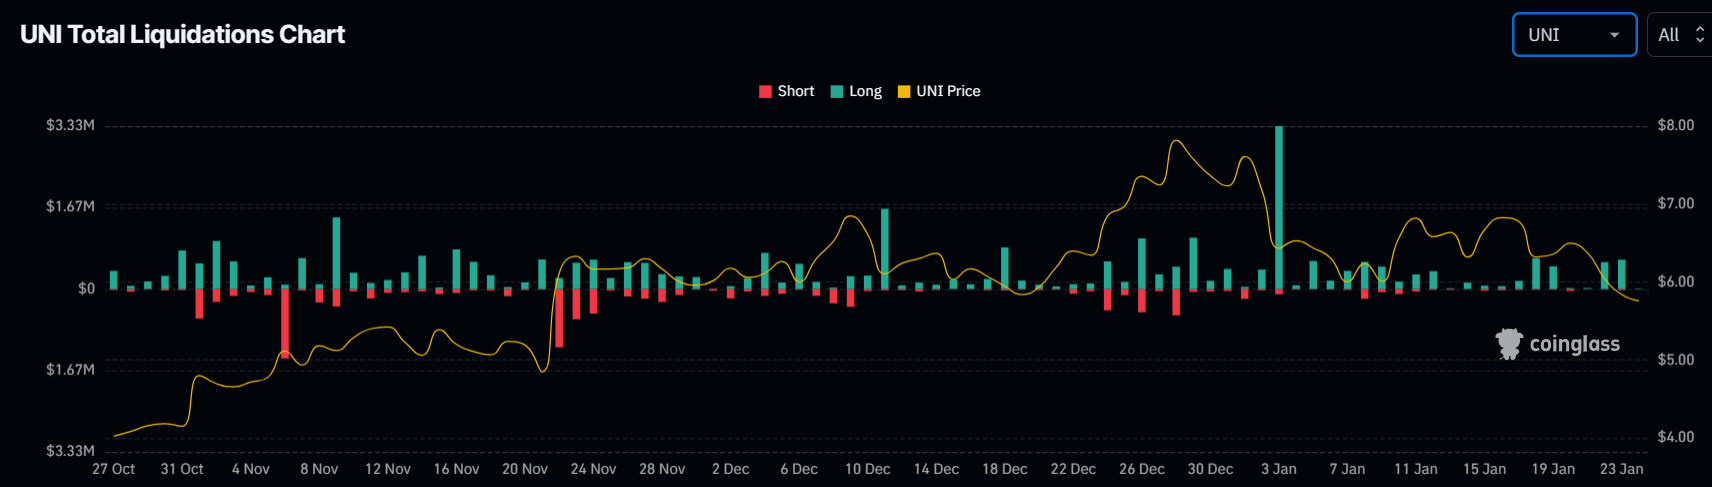
Uniswap liquidations
This difference will likely expand, and the long liquidations will increase as Uniswap price is set to decline further over the coming days.
Uniswap price bearish reversal awaits
Uniswap price trading at $5.74 has nearly validated the bearish reversal pattern of Head and Shoulders (H&S). This pattern would be confirmed once UNI successfully forms consistent lows below the neckline marked at $5.81.
The head and shoulders pattern is a trend reversal. It consists of three peaks: a higher peak (head) marked at $7.81 and two lower peaks (shoulders). The first shoulder is formed as an uptrend, followed by a higher peak forming the head, and then a lower peak completing the second shoulder.
The pattern suggests a shift from bullish to bearish sentiment, with a neckline connecting the lows. A confirmed break below the neckline indicates a potential downtrend. This is yet to occur since the daily candlestick has not closed below the neckline as of now.
Once it does, the altcoin will likely set on a path that could lead to a 34% crash, bringing the price down to $3.81. This is the target price marked as per the bearish reversal pattern.
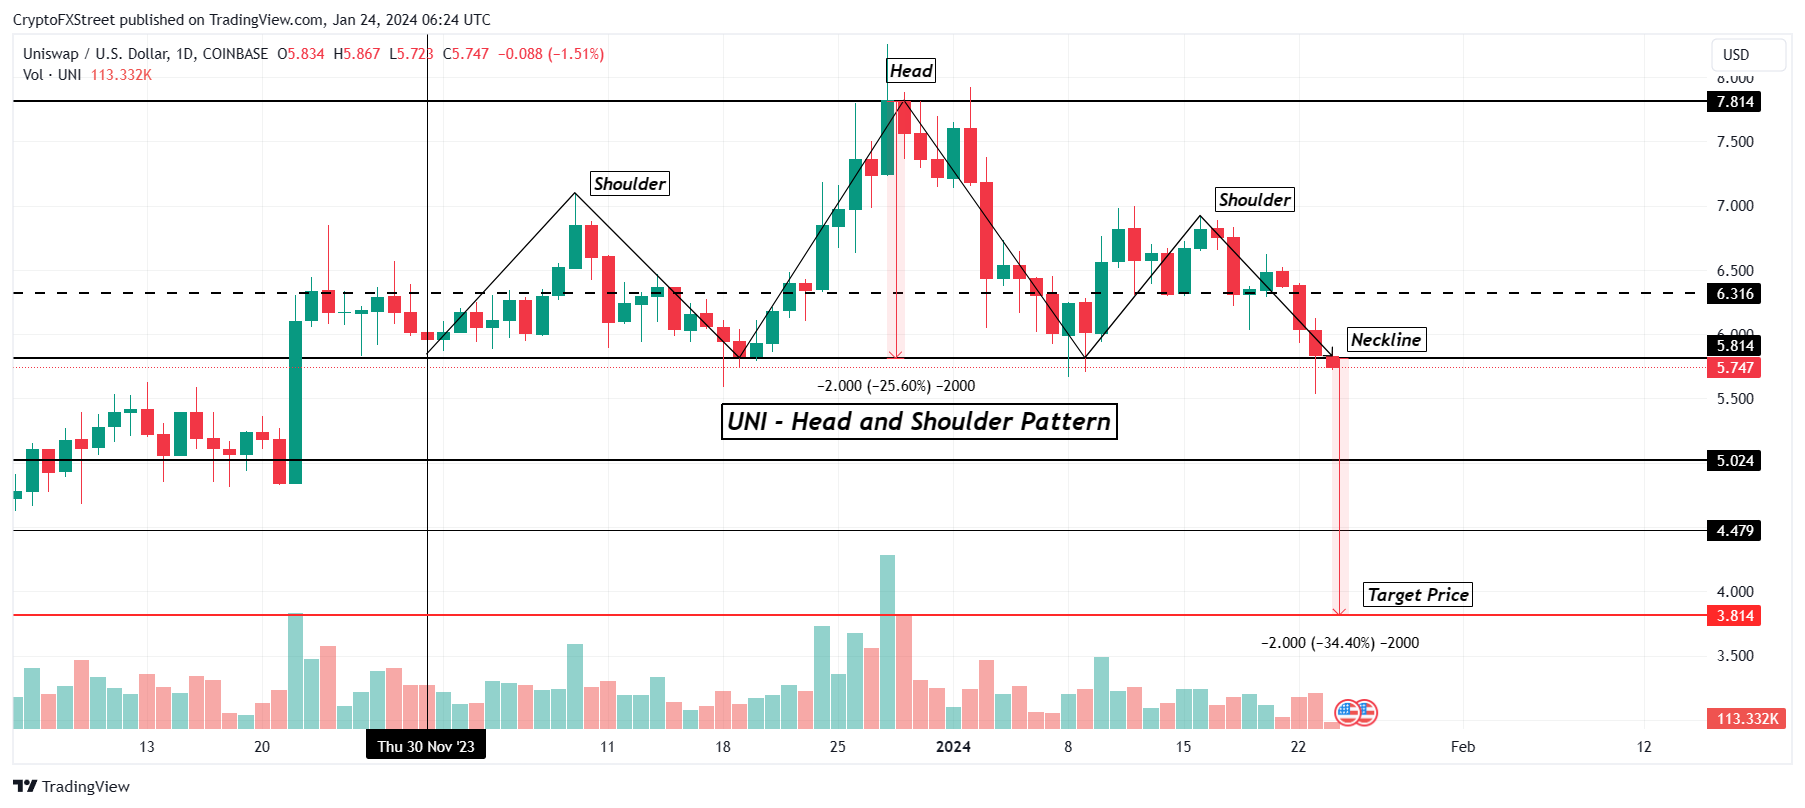
UNI/USD 1-day chart
However, if the bearish cues turn bullish, Uniswap price would have a shot at reversal, provided it can reclaim $6.31 into a support floor. This would invalidate the bearish pattern and likely send UNI beyond $6.50.
Author

Aaryamann Shrivastava
FXStreet
Aaryamann Shrivastava is a Cryptocurrency journalist and market analyst with over 1,000 articles under his name. Graduated with an Honours in Journalism, he has been part of the crypto industry for more than a year now.


