Tron TRX Price Prediction: Subtle signs of a change of hands
- TRX price finds support above the recently breached 8- and 21-day simple moving averages.
- The Volume Profile Indicator shows the bearish downtrend may have ended.
- Invalidation of the uptrend thesis is a breach of the swing lows at $0.06.

Tron’s TRX price could be setting up for another bull run.
TRX price shows strength
TRX price is displaying optimistic signals to start the second trading week of September. Following the early-month liquidation, the TRX price recovered 7% of the lost market value. Amidst the bullish retaliation, the bulls have consecutive bullish engulfing candles on the 2-day chart.
TRX price currently auctions at $0.063. The bulls currently support the price above a compressing 8-day exponential and 21-day simple moving averages. The Relative Strength Index is back in the supportive buy zone, while the volume profile indicator is nearly identical to the previous downtrend’s reading.
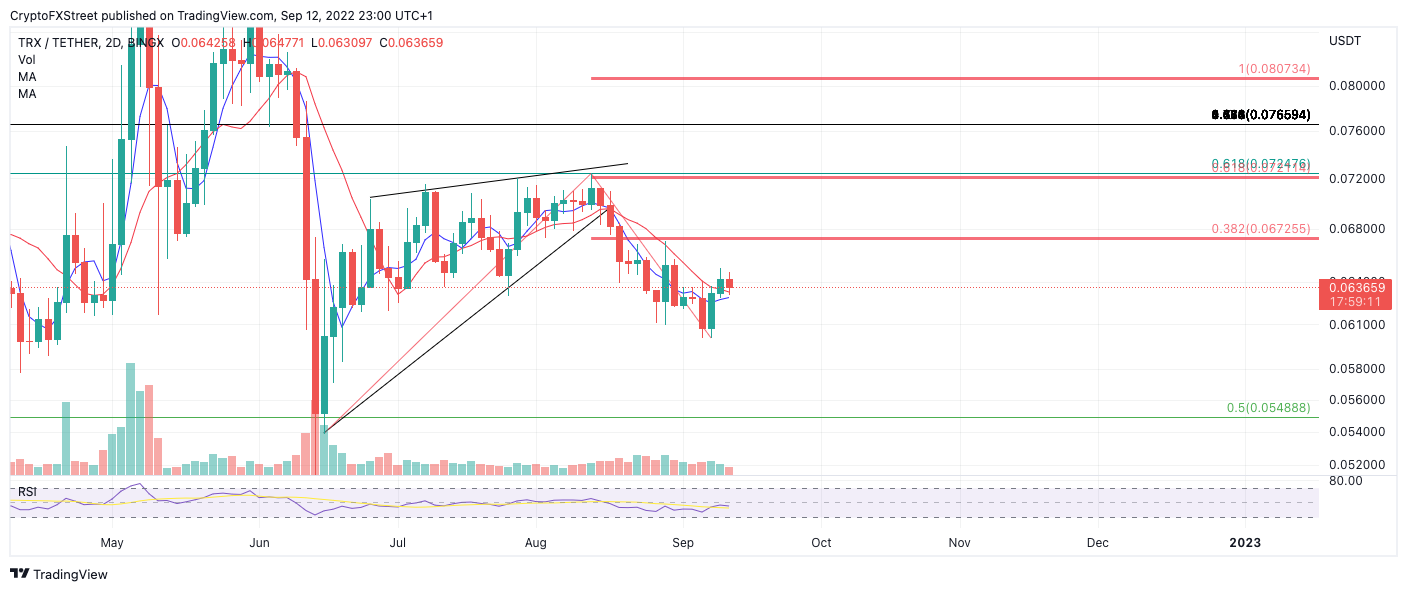
TRX USDT 2-Day Chart
When combined, TRX price could witness a “changing of hands.” Retail traders should be very cautious with placing additional short positions. A Fibonacci projection tool surrounding the summer lows and highs projected from the most recent September low has a 61.8% Fib level in the mid $0.07 zone. A rally towards the confluence level would result in a 14% Increase from the current price.
Invalidation of the uptrend scenario is a breach below the newly established September lows at $0.06. The bears could induce a drop targeting the June swing low at $0.053. Such a decline would result in a 14% decrease from the current TRX price.
In the following video, our analysts deep dive into the price action of TRON, analyzing key levels of interest in the market - FXStreet Team
Author

Tony M.
FXStreet Contributor
Tony Montpeirous began investing in cryptocurrencies in 2017. His trading style incorporates Elliot Wave, Auction Market Theory, Fibonacci and price action as the cornerstone of his technical analysis.


