Solana Price Forecast: SOL drops below $100 as bears tighten grip
- Solana trades below $100 on Wednesday after losing more than 6% the previous day.
- Institutional demand remains low as retail sentiment weakens, signaling a bearish shift.
- The technical outlook for Solana expects further decline to $85 as selling pressure intensifies.

Solana (SOL) trades below $100 at press time on Wednesday, after taking a more than 6% hit the previous day as the broader cryptocurrency market slipped. Institutional and retail demand for Solana continues to decline, while on-chain data shows a record 150 million daily transactions on Tuesday. Technically, SOL's outlook calls for a drop to $85 as bearish momentum intensifies.
Fading demand supports downside risk amid declining market conditions
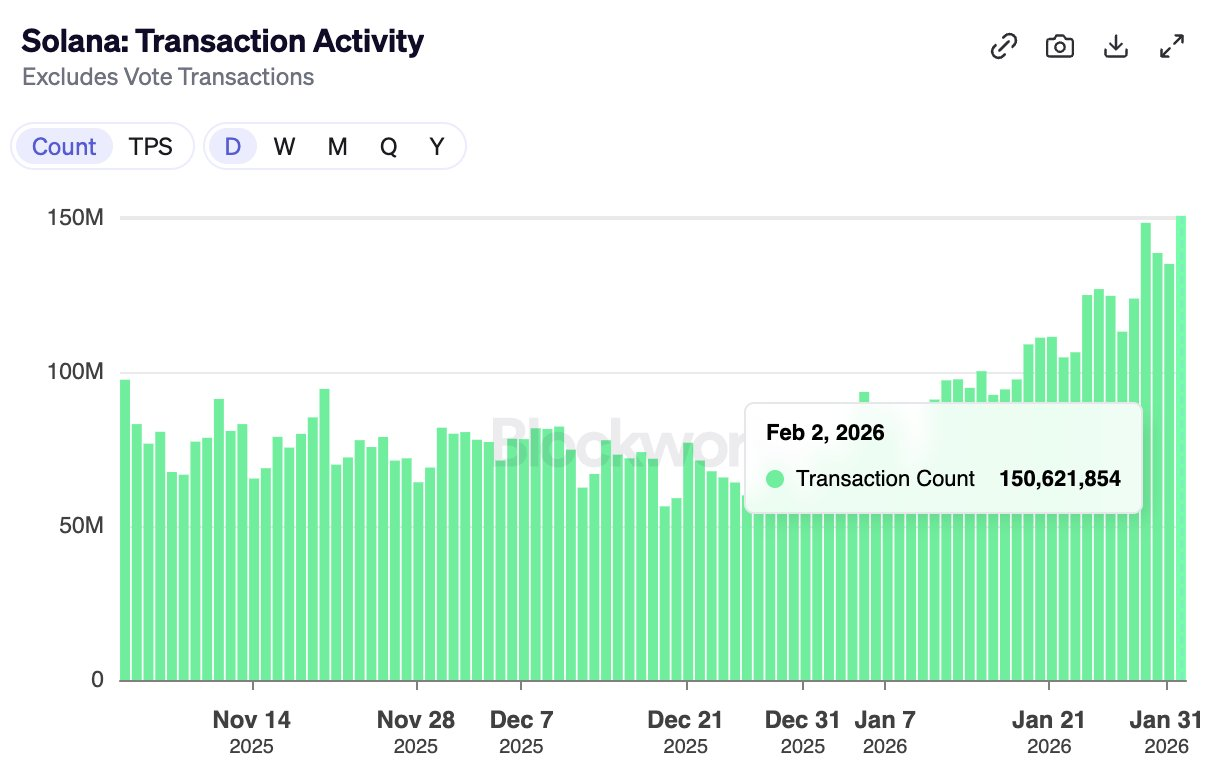
Solana sustains on-chain demand among users as the daily transaction count hits an all-time high on Tuesday. Blockworks data shows that Solana recorded more than 150 million transactions on Tuesday, with 1,743 transactions made per second (TPS).
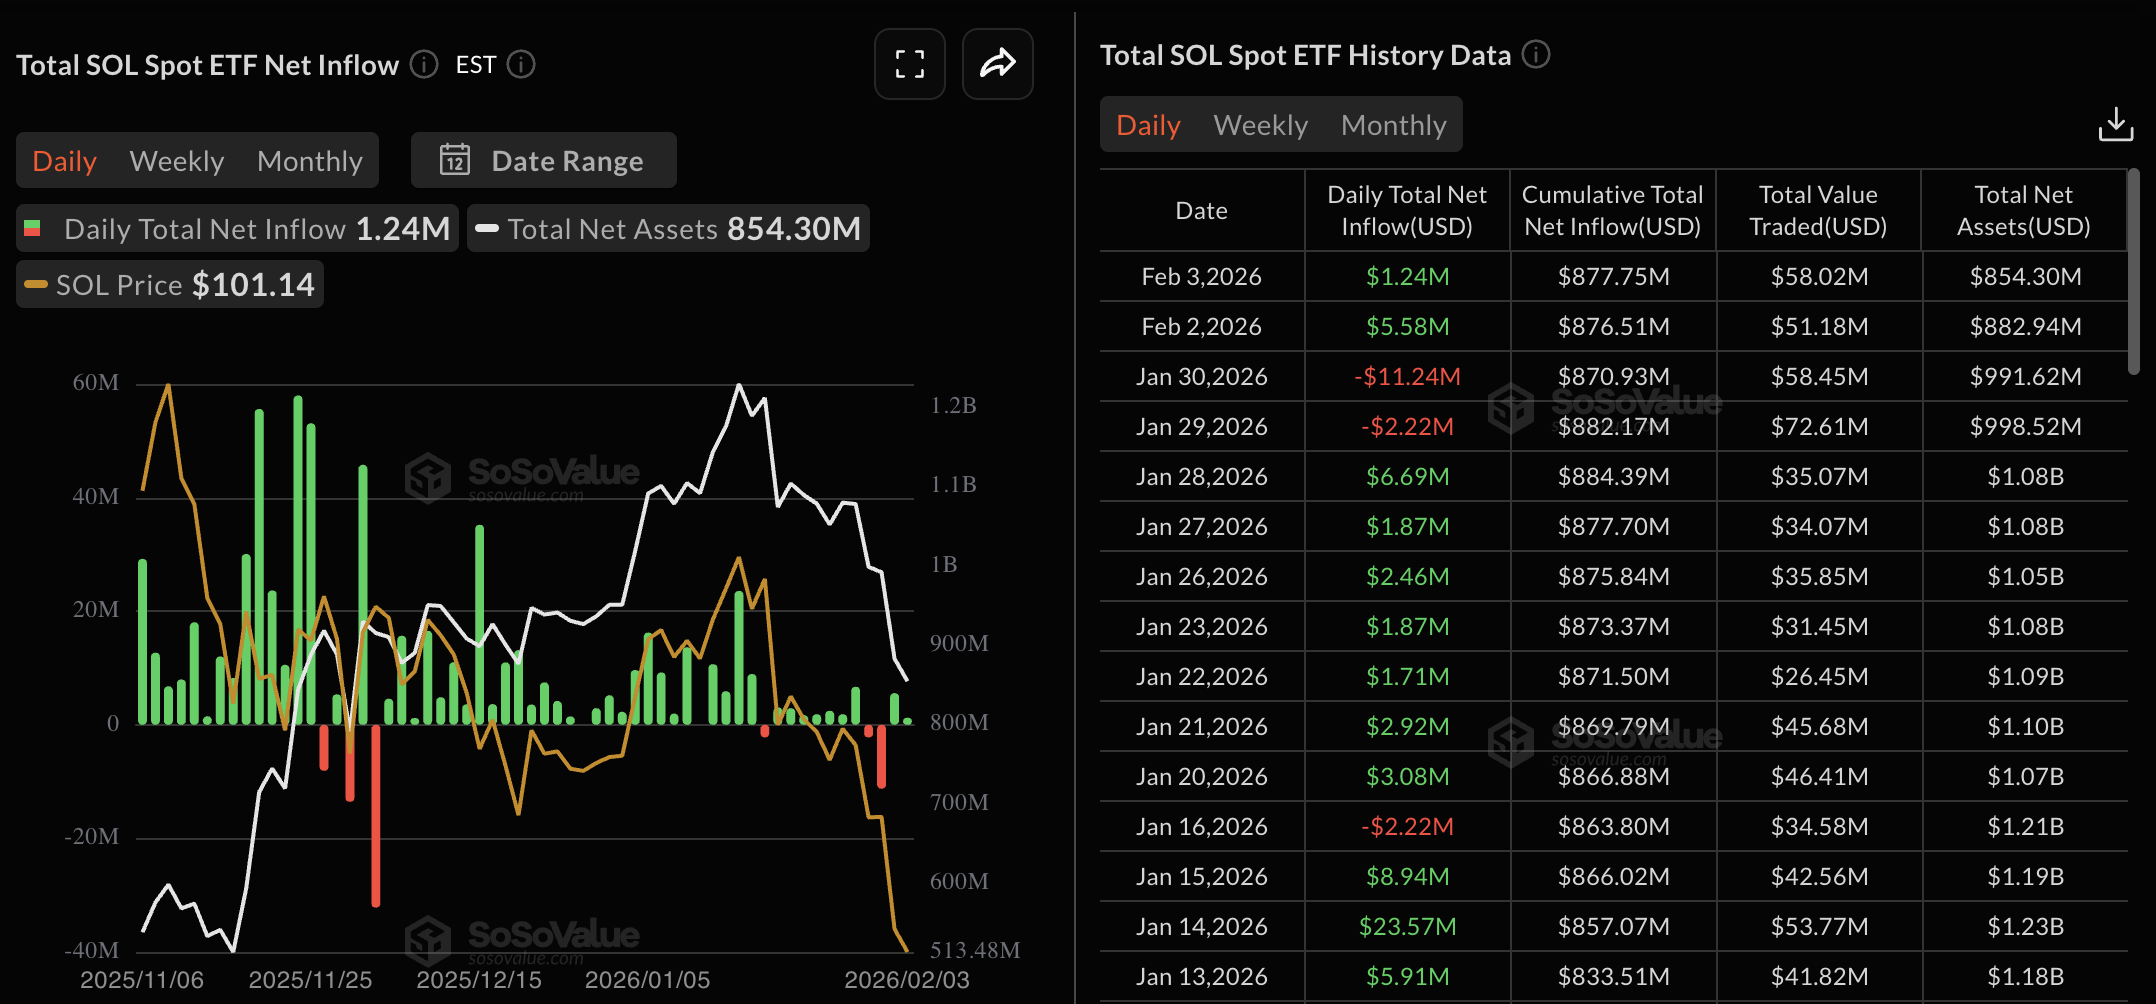
Despite strong on-chain demand, institutional inflows have remained low over the last three weeks, no more than $9 million per day since January, with three outflow days. Sosovalue data indicates that US SOL-focused Exchange-Traded Funds (ETFs) recorded an inflow of $1.24 million on Tuesday, building on the $5.58 million inflow on Monday.
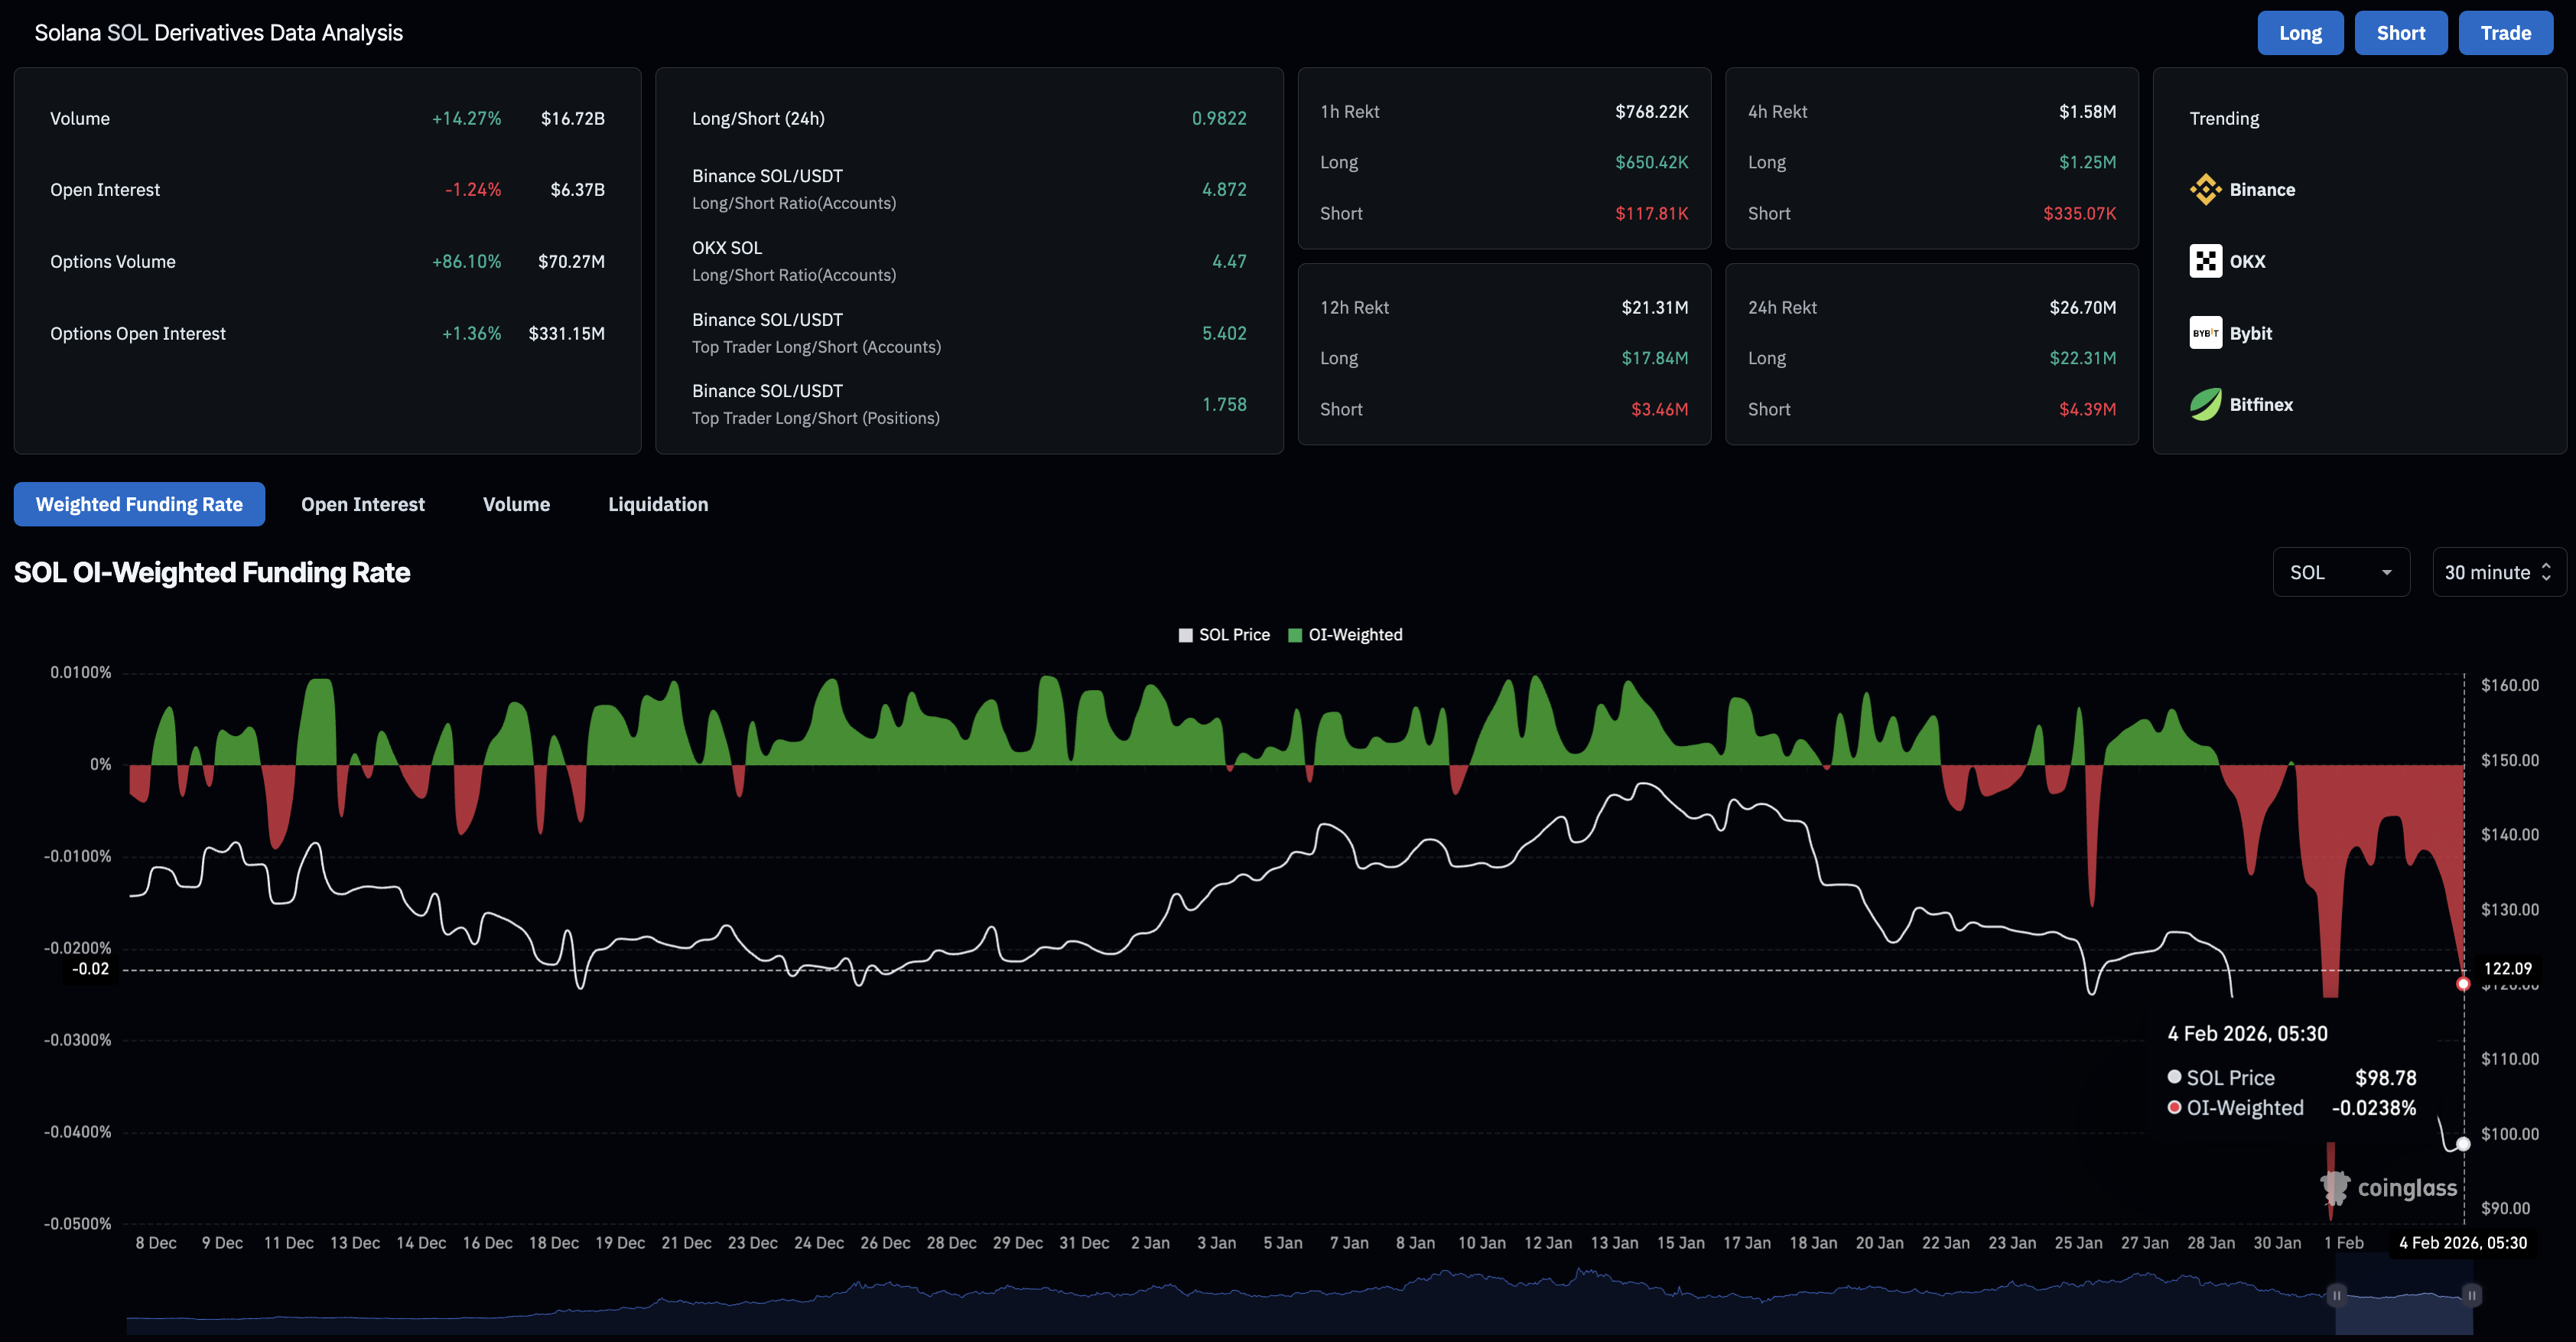
Meanwhile, the derivatives market indicates bearish sentiment toward Solana amid capital outflows. CoinGlass data shows that SOL Open Interest (OI) declined by 1.24% over 24 hours to $6.37 billion, indicating that capital was withdrawn either through position closures or by reducing leveraged positions.
Additionally, the position closures show a bearish bias, as long liquidations of $22.31 million over the same period are more than five times the short liquidations of $4.39 million.
The OI-weighted funding rate for Solana is down to -0.0238%, indicating heightened bearish sentiment among traders holding or building short positions and willing to pay a premium for it.
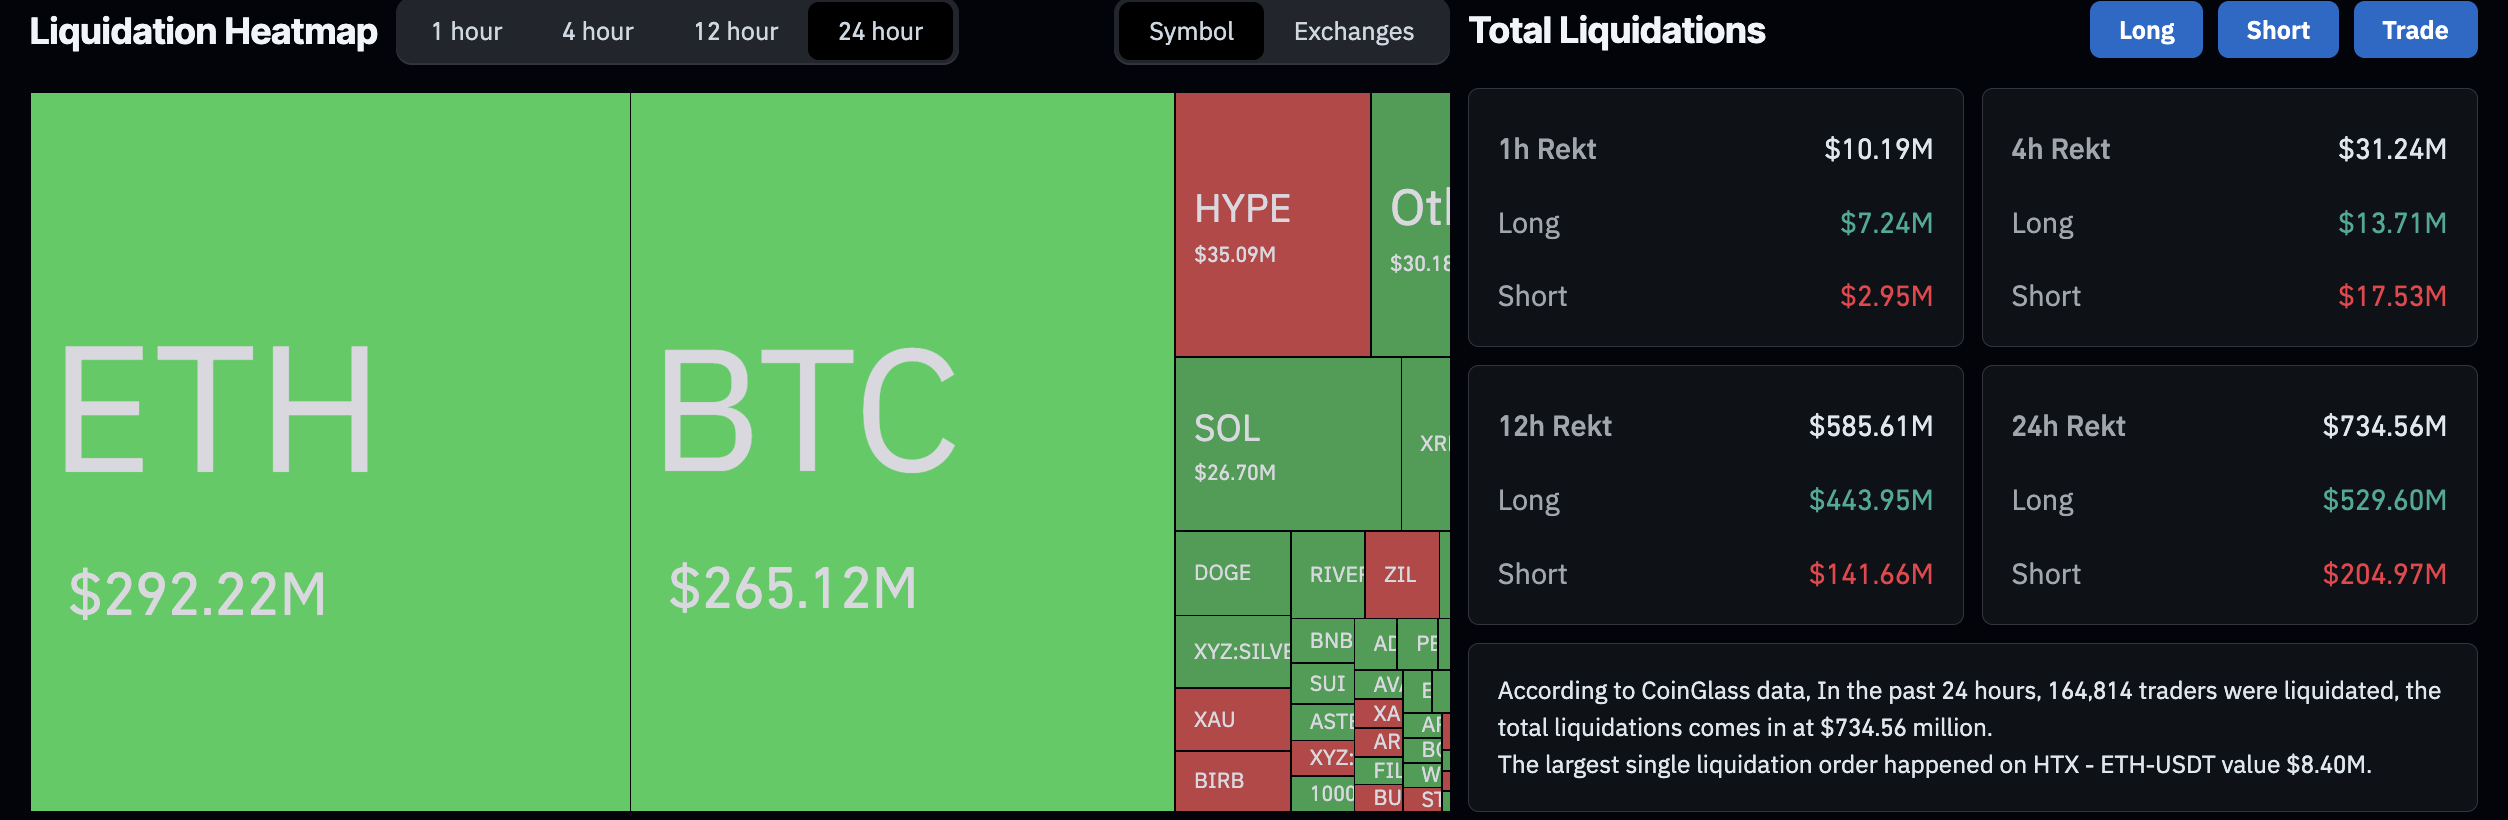
The declining bullish interest in Solana is consistent with the broader market sell-off, with total liquidations of roughly $735 million over the last 24 hours, including $529 million in long liquidations.
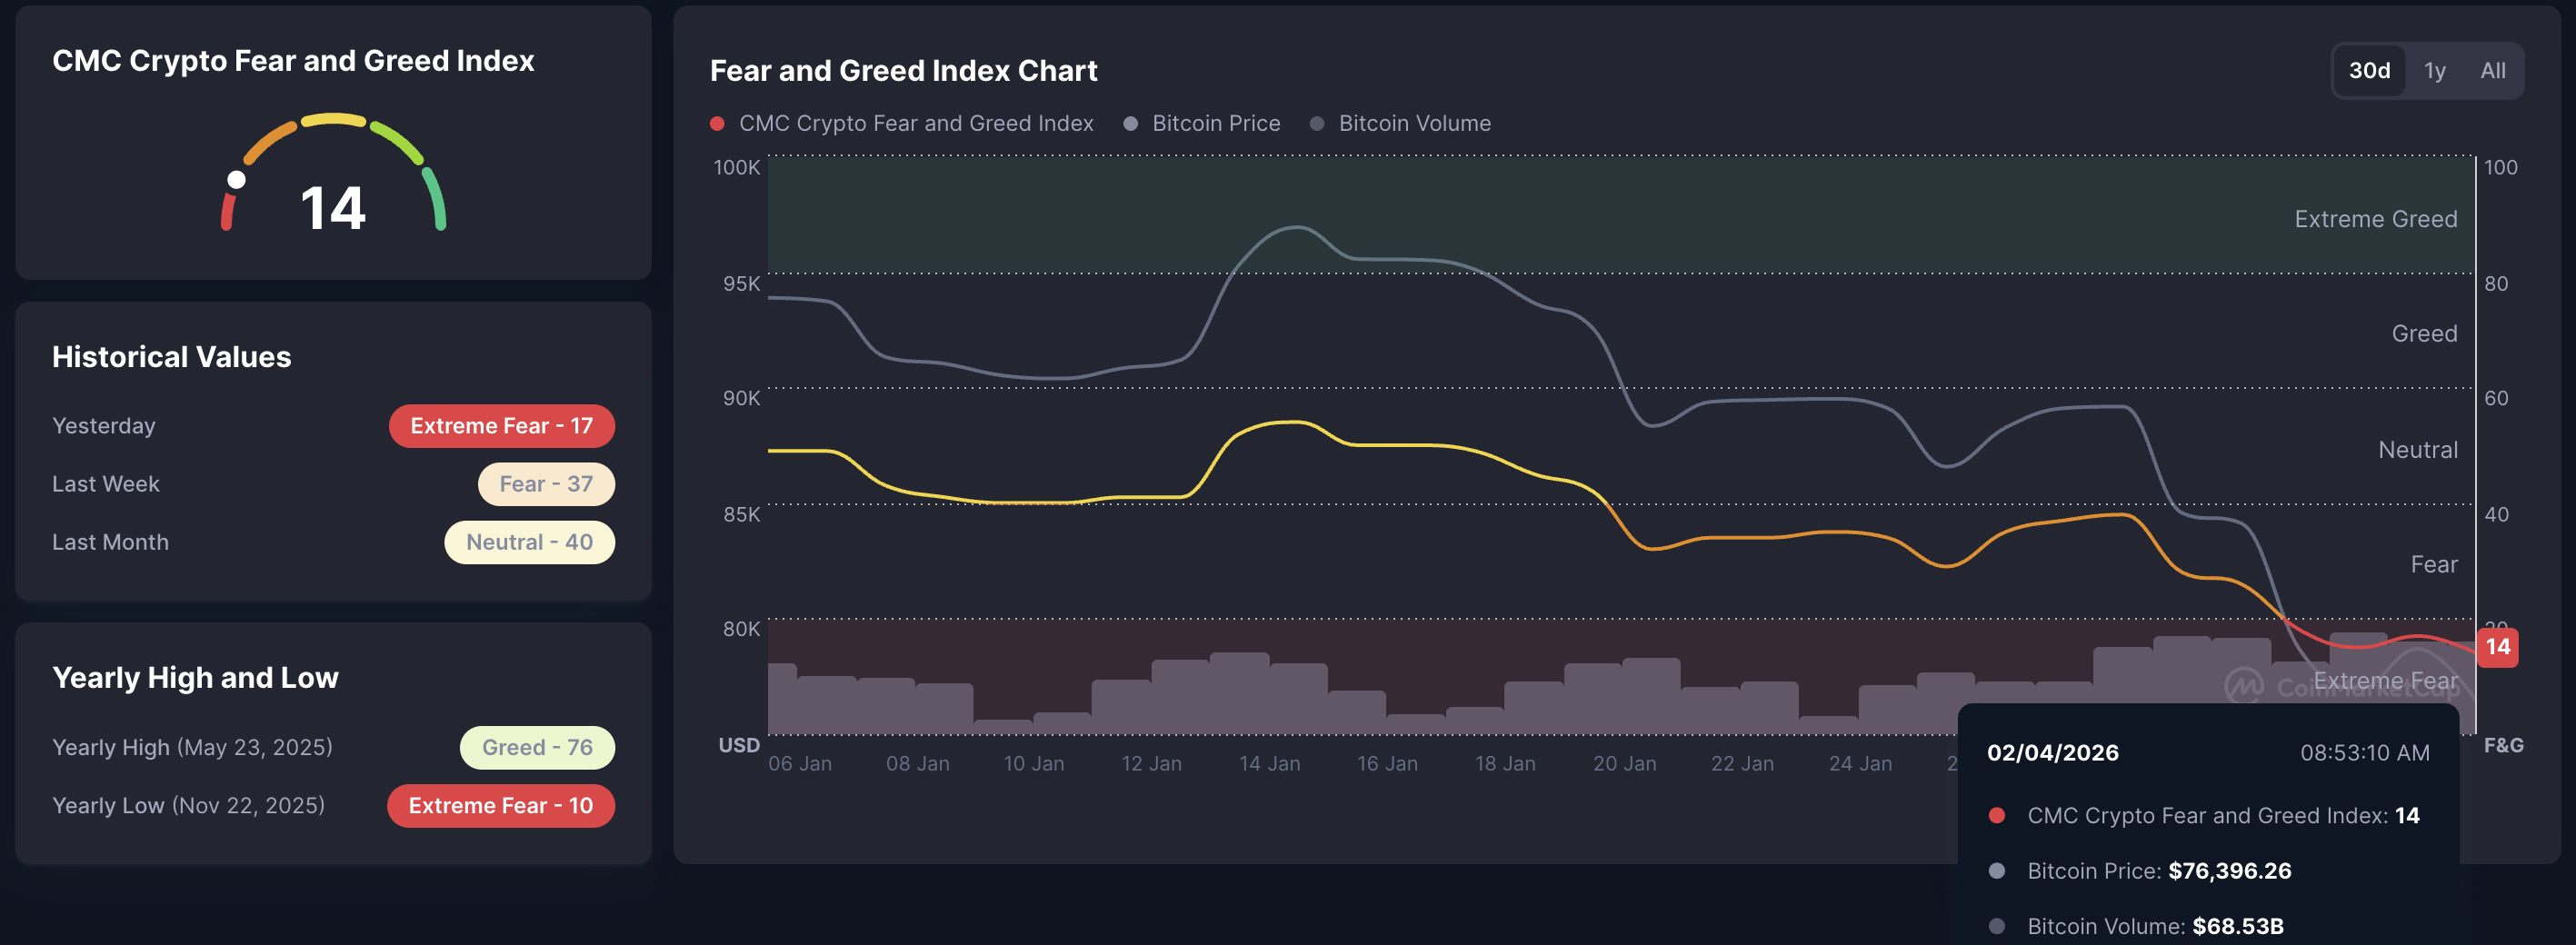
Additionally, the broader cryptocurrency market is weakening, with the Fear and Greed Index at 14 on Wednesday, signaling intense risk-off sentiment among investors. If market sentiment fails to recover, Solana could experience further declines.
Technical outlook: Will Solana price hit $85?
Solana trades below the 50-, 100-, and 200-day Exponential Moving Averages (EMAs) at $127, $139, and $153, keeping the broader bias under pressure. The short-term average slopes are lower than those of the longer measures, reinforcing a bearish stack as rebounds stall.
If SOL drops below $95, the path of least resistance targets the S1 Pivot Point at $85.
The Moving Average Convergence Divergence (MACD) declines alongside the signal line, moving deeper into negative territory on the daily chart and suggesting intense bearish momentum. The Relative Strength Index (RSI) is at 28 on the same chart and has shifted sideways into the oversold zone, which could encourage a further sell-off.
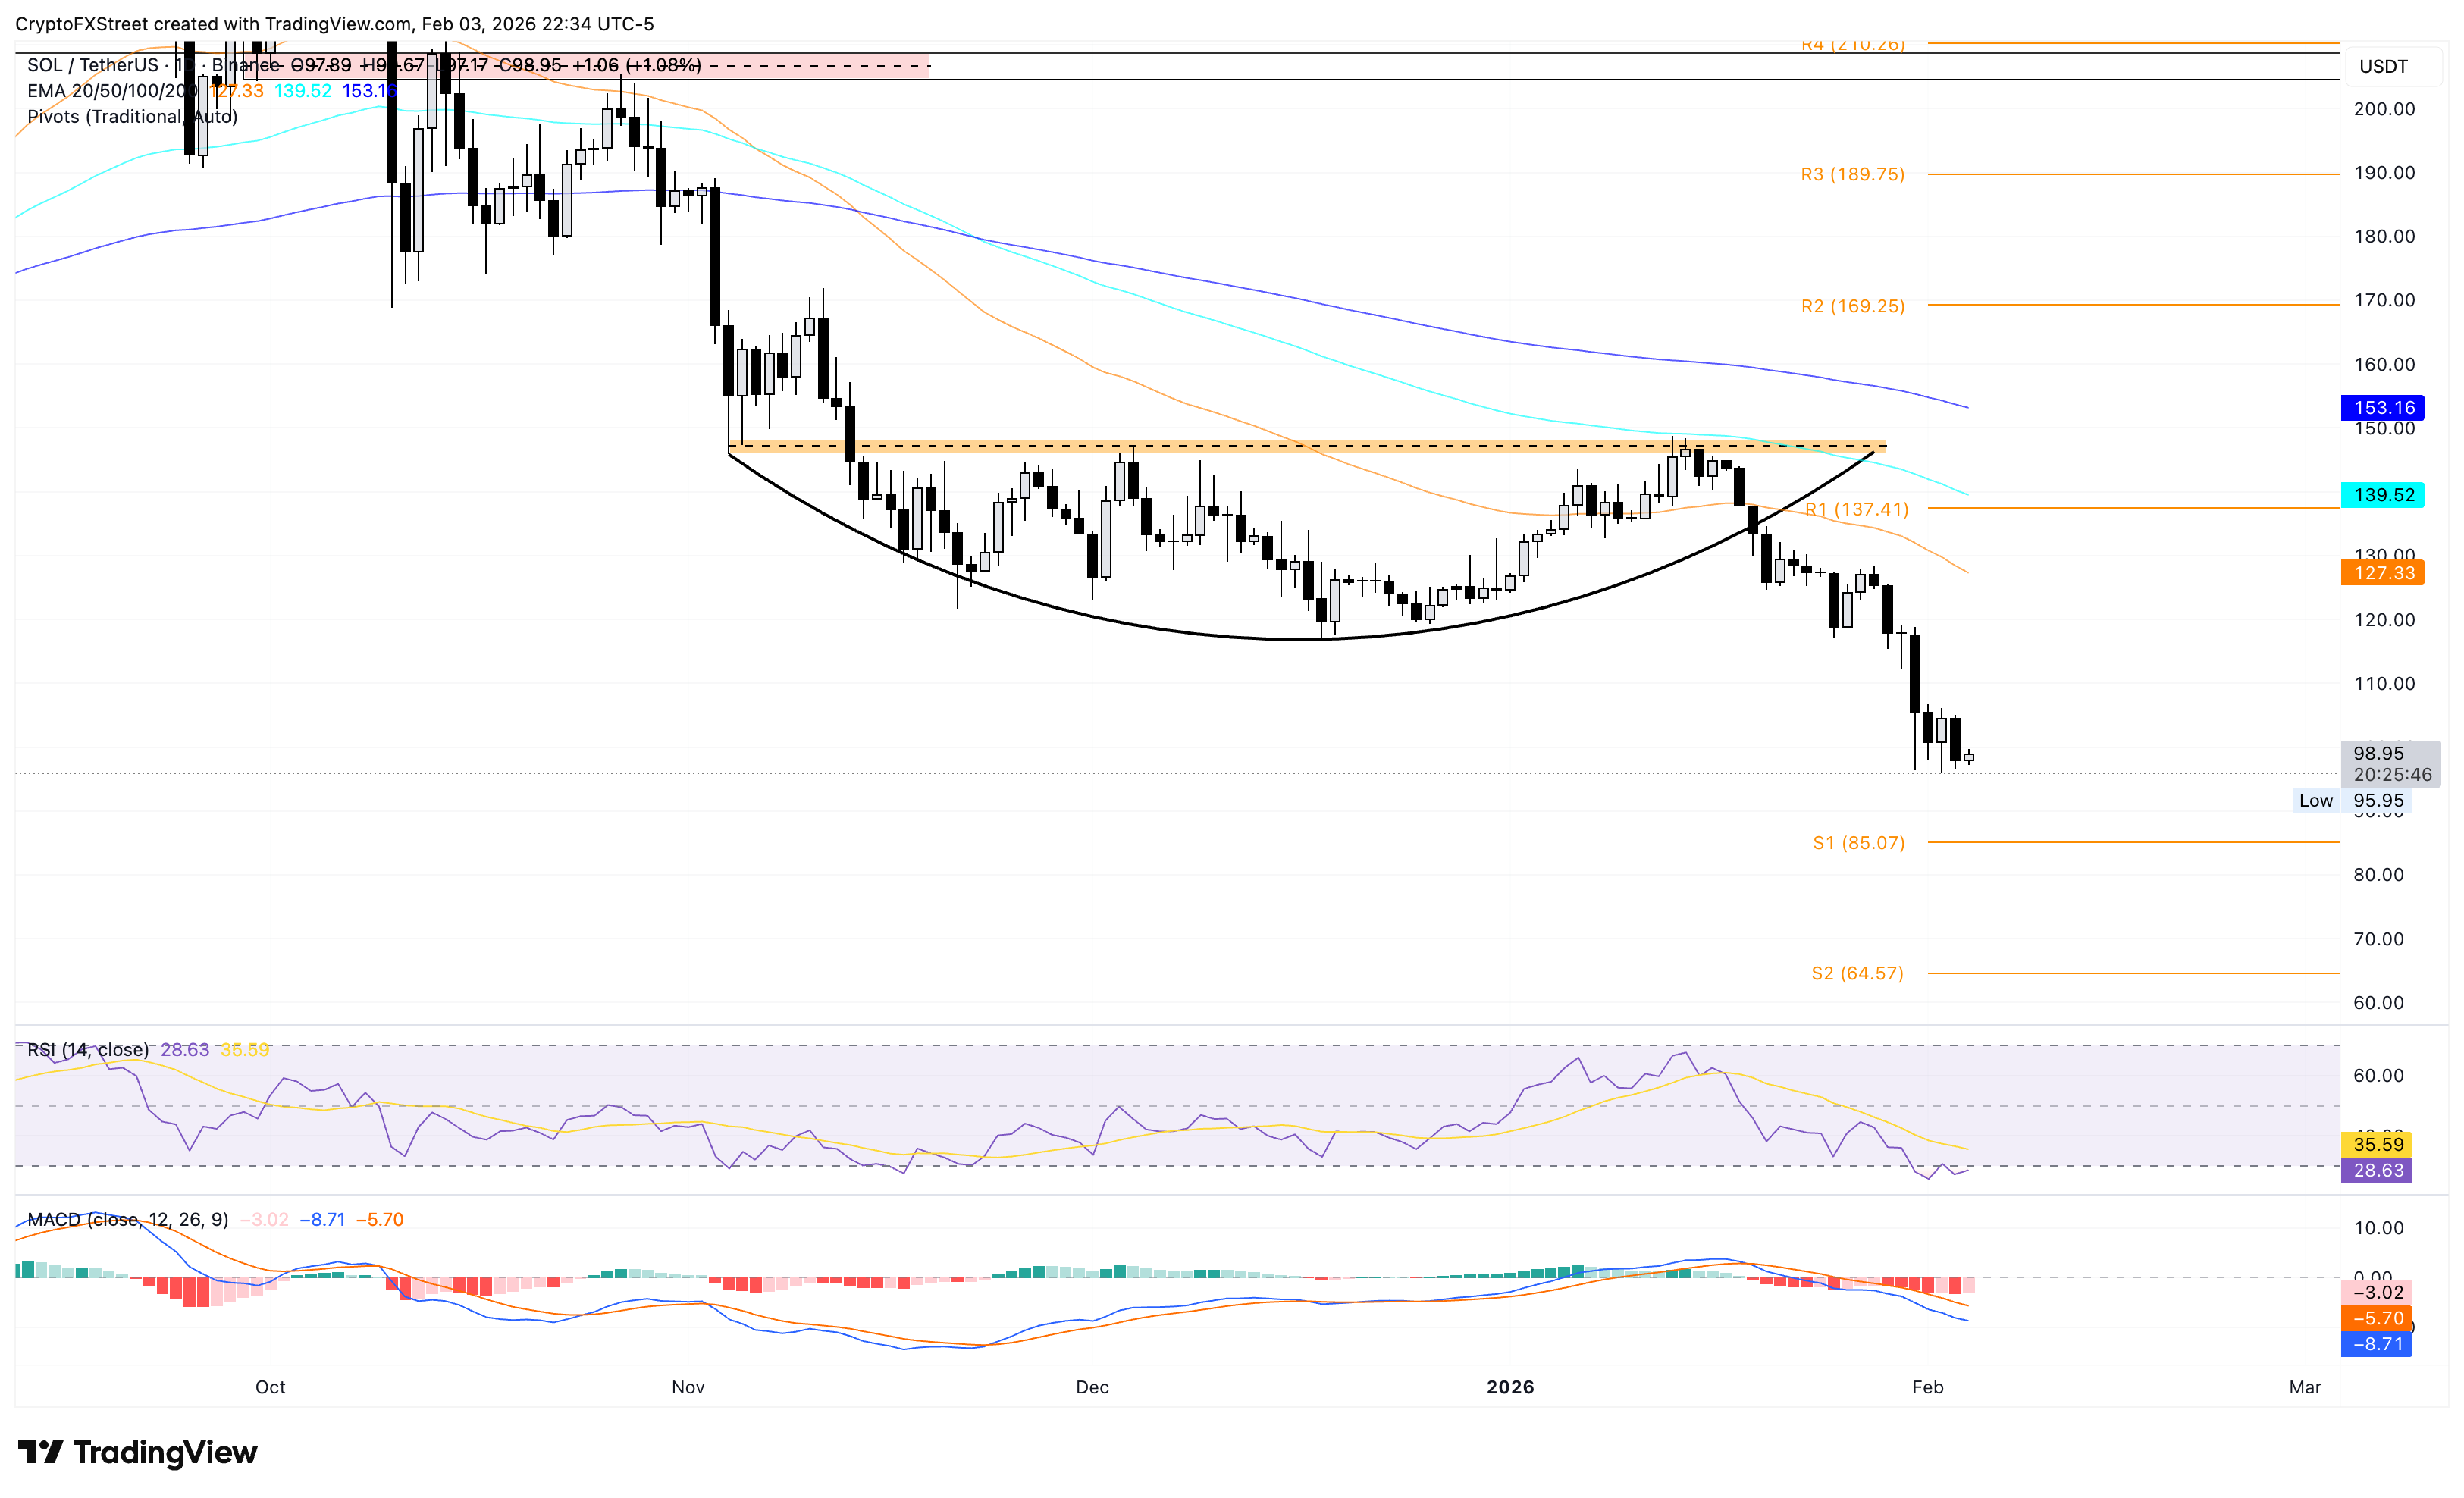
Looking up, if Solana resurfaces above $100, it could focus on the 50-day EMA at $127 as the primary target.
(The technical analysis of this story was written with the help of an AI tool.)
Author

Vishal Dixit
FXStreet
Vishal Dixit holds a B.Sc. in Chemistry from Wilson College but found his true calling in the world of crypto.



