Toncoin Price Forecast: TON recovery supported by bullish derivatives, fading bearish momentum
- Toncoin price extends recovery on Wednesday, rising 4.5% over the past two days after finding support around a key level.
- Derivatives data supports the rebound, with rising long bets and funding rates turning positive.
- The technical outlook indicates early signs of recovery, with indicators suggesting that bearish momentum is fading.

Toncoin (TON) is extending its rebound, trading above $1.40 at the time of writing on Wednesday, after recovering 4.5% over the past two days, following last week’s massive correction. The derivatives data shows improving sentiment with rising long bets and funding rates turning positive. On the technical side, the outlook indicates early signs of recovery for TON, with indicators showing fading bearish momentum.
Derivatives data shows improving sentiment
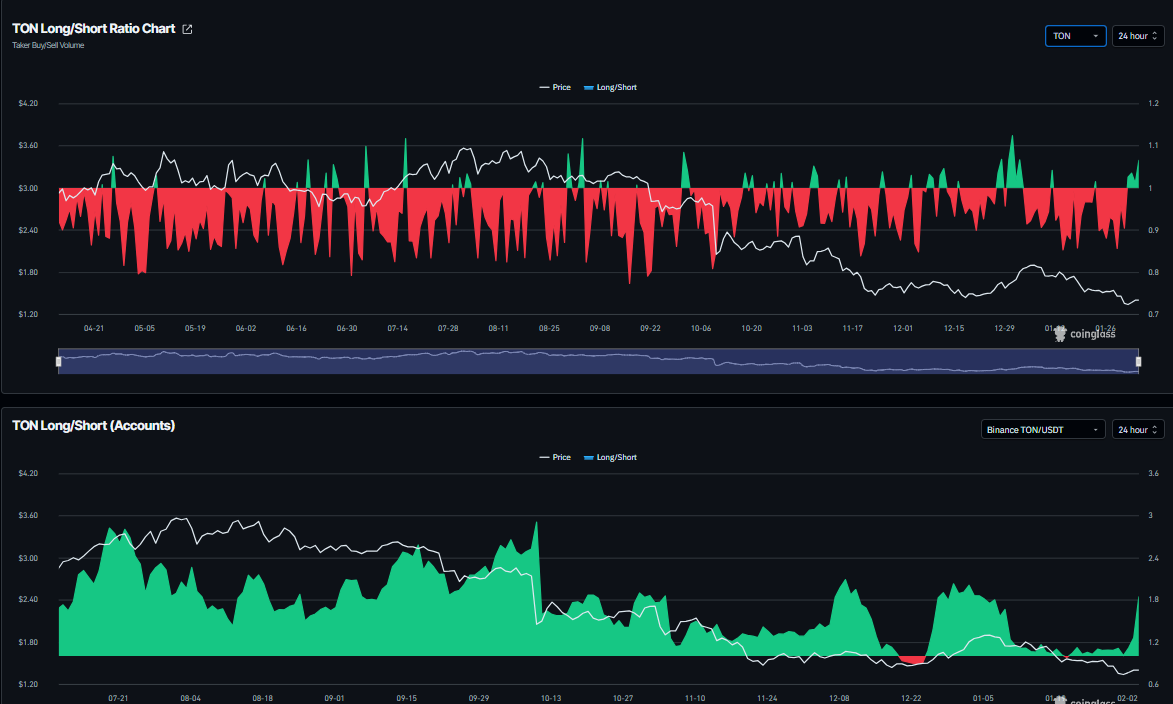
CoinGlass data shows that Toncoin's long-to-short ratio reads 1.06 on Wednesday and has been steadily rising. The ratio above one reflects bullish sentiment in the markets, as more traders are betting on the asset price to rally. In addition, the long bets on the Binance exchange reached 1.84 on Wednesday, the highest level since January 7, further supporting the recovery thesis.
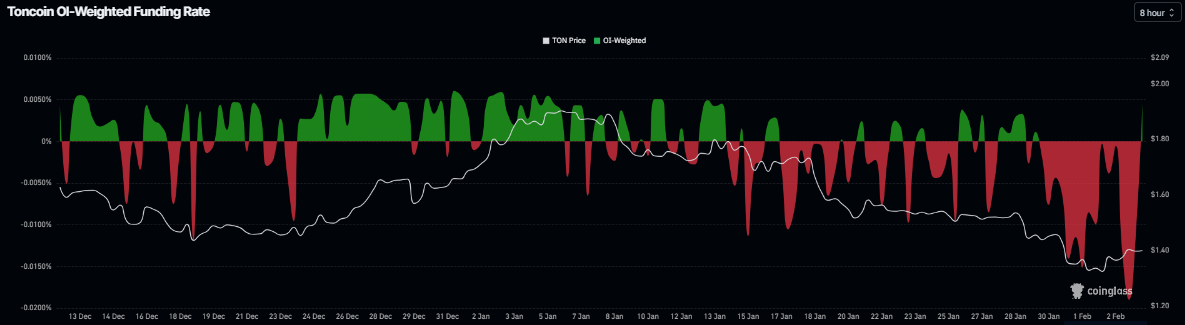
CoinGlass OI-Weighted Funding Rate data shows that the number of traders betting that the price of TON will slide further is lower than that anticipating a price increase.
The metric has flipped positive, reading 0.0045% on Wednesday, indicating that longs are paying shorts and supporting recovery chances.
Toncoin Price Forecast: TON rebounds after retesting daily support
Toncoin price corrected more than 11% last week and retested the daily support level at $1.31. At the start of this week, TON found support around the daily level and recovered 4.5% through Tuesday. As of Wednesday, TON is trading around $1.40.
If TON continues its recovery, it could extend the advance toward the 50-day Exponential Moving Average (EMA) at $1.59, which coincides with the descending trendline (drawn by joining multiple highs since early August).
The Relative Strength Index (RSI) on the daily chart reads 35, rebounding from the oversold conditions and pointing upward, indicating fading bearish momentum. However, for the recovery rally to be sustained, the RSI must move above the neutral level. Moreover, the Moving Average Convergence Divergence (MACD) is also converging with decreasing red histogram bars below the neutral level, further supporting the recovery thesis.
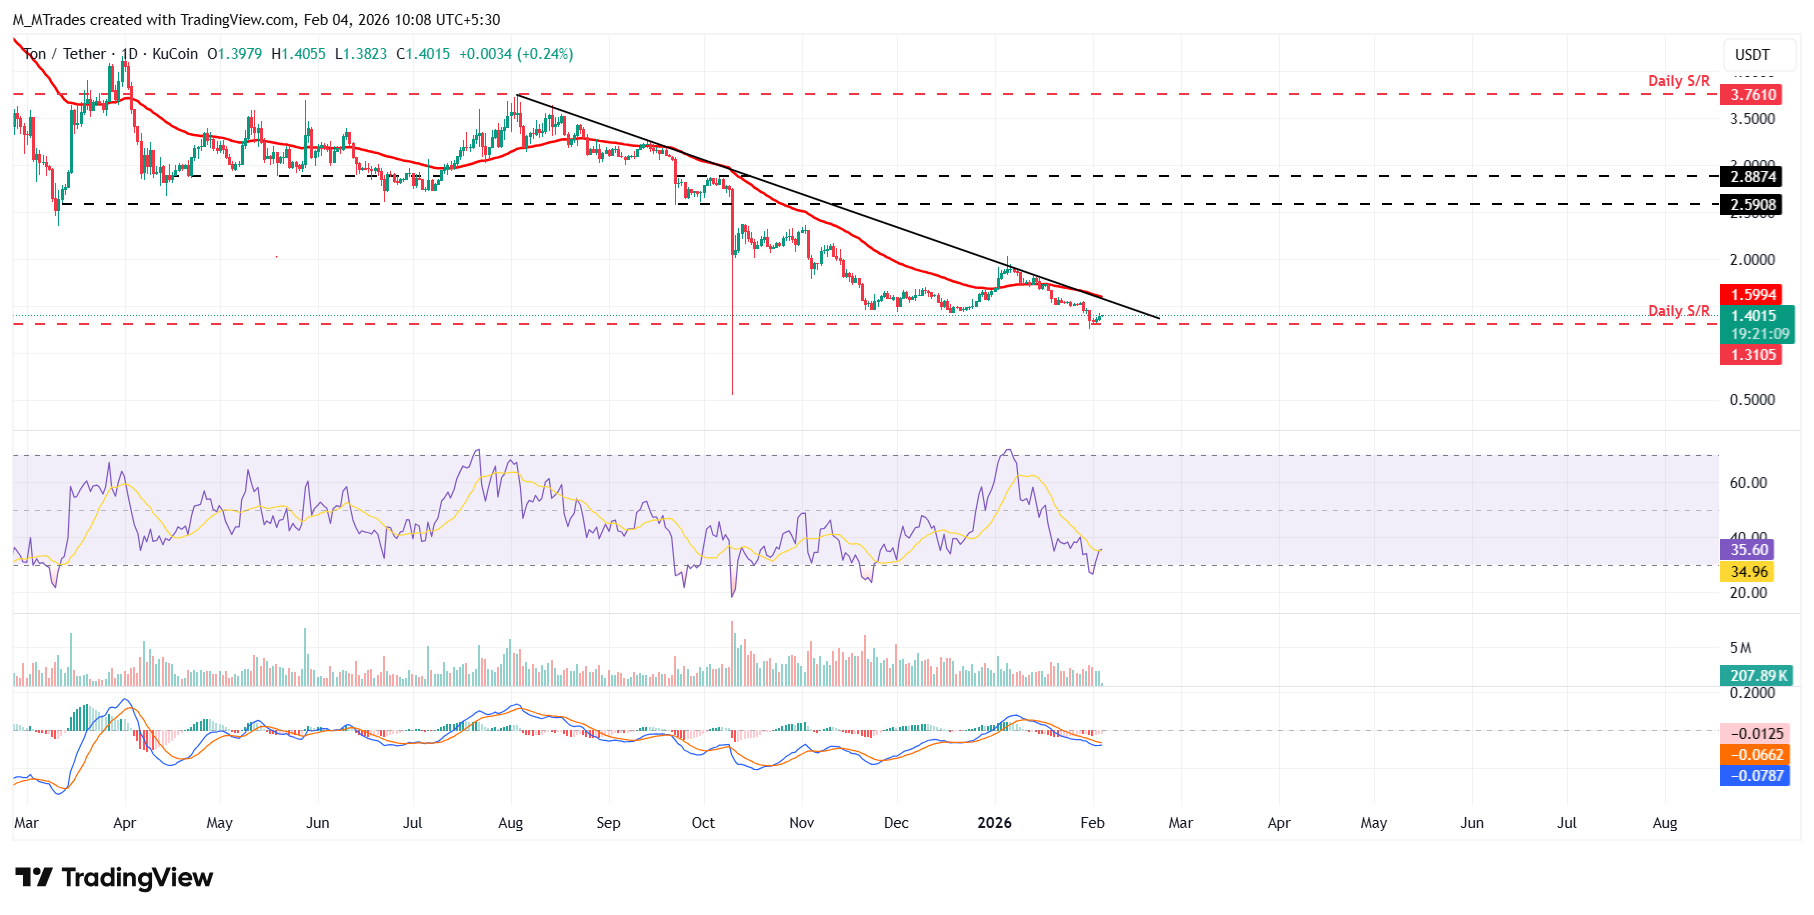
On the other hand, if TON faces a correction, it could extend the decline toward the daily support at $1.31.
Author

Manish Chhetri
FXStreet
Manish Chhetri is a crypto specialist with over four years of experience in the cryptocurrency industry.


