TRON price reaches make or break moment with TRX at the cusp of a 100% gain
- TRON price shaping the handle of a cup-with-handle base on the weekly chart.
- TRX daily Relative Strength Index (RSI) remains overbought but below the extreme reading of 83.06 plotted on August 16.
- TRON price respects July ascending trend line on August 19 with a 4.03% bounce.

TRON price has rallied in step with the broader cryptocurrency market since the July 20 low, recording a 100% gain at the August 16 high of $0.098 and confidently maintaining support above the July ascending trend line. Despite the noteworthy rally, TRX has reached a resistance level that corresponds with the April lows while flashing an extreme overbought reading on the daily RSI. The preconditions for a deeper pullback are coming into focus.
TRON price is an opportunity wrapped in mystery
From a long-term perspective, TRON price has been plotting a cup-with-handle pattern since the January 2018 high. The April-July cyclical correction has shaped the handle. The handle low is defined by superior support attributed to the confluence of the 50-week simple moving average (SMA) and the 2020 high of $0.053. Now, TRX is aiming to complete the right side of the handle in the coming months.
The measured move target of the cup-with-handle base is $0.370, putting TRON price above the left side of the base at $0.350.
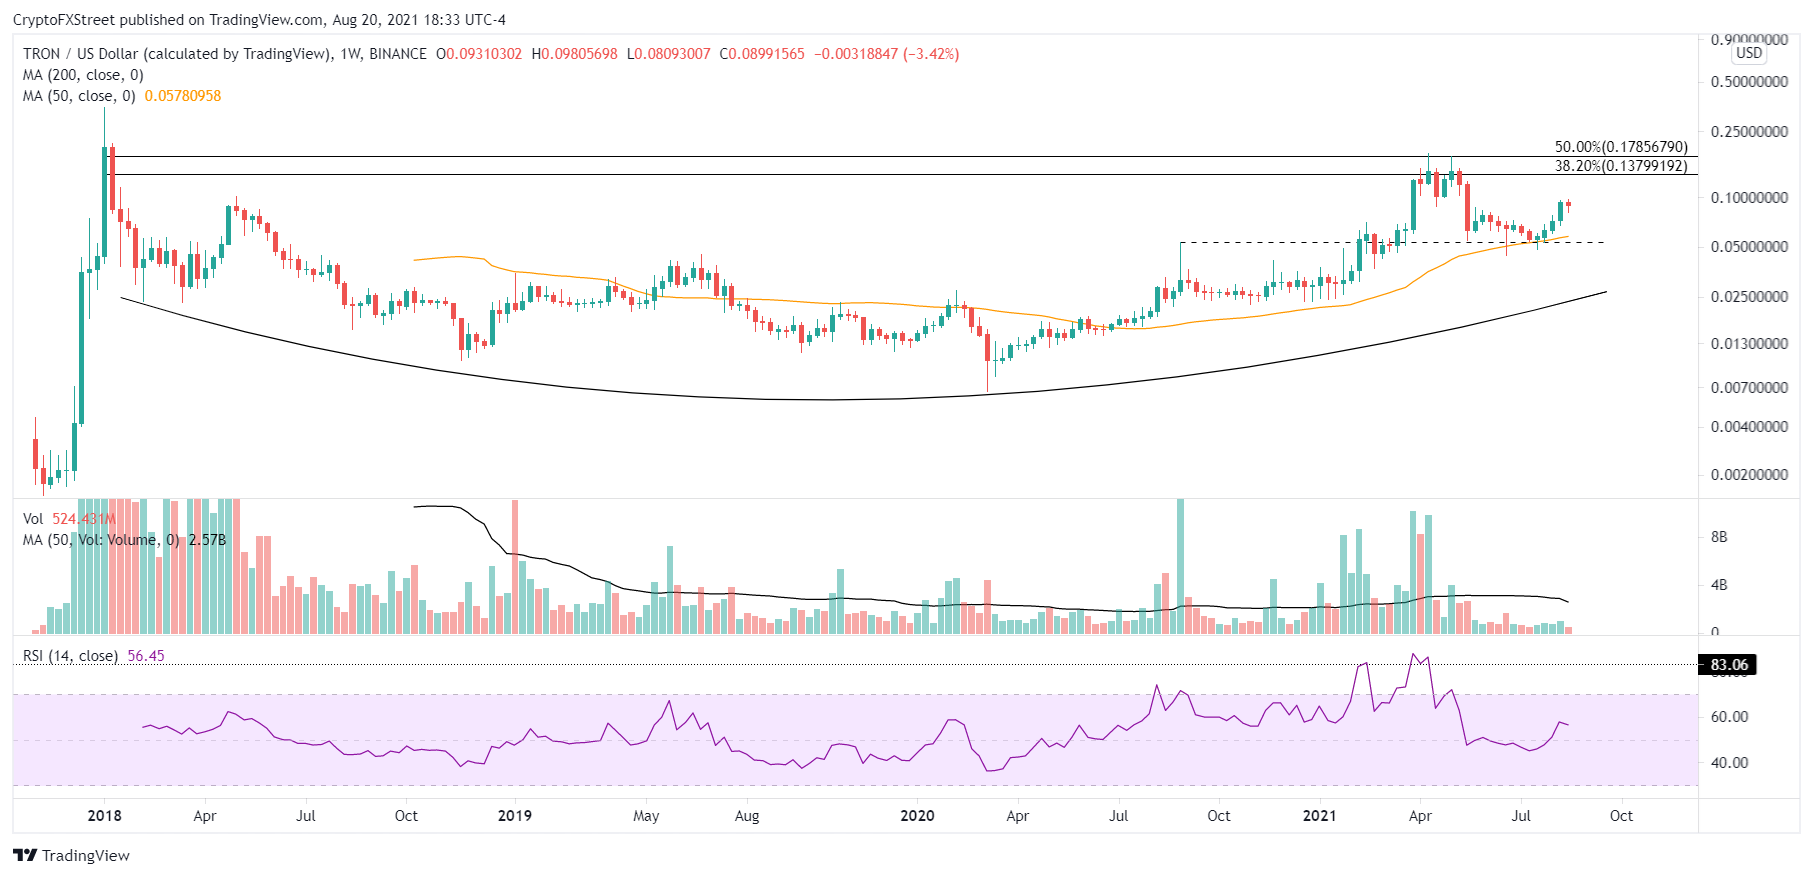
TRX/USD weekly chart
Currently, TRON price holds the 200-day SMA at $0.078, and the July ascending trend line but is confronting the resistance established by the April lows and the TRX rebound highs that followed the May 19 collapse around $0.095.
The test of the TRON price range while hitting an extreme overbought condition does raise the probabilities of a deeper pullback, possibly down to the 50-day SMA at $0.067. It would create a new entry price for TRX speculators and the runway for the altcoin to resume the pursuit of a breakout from the cup-with-handle pattern.
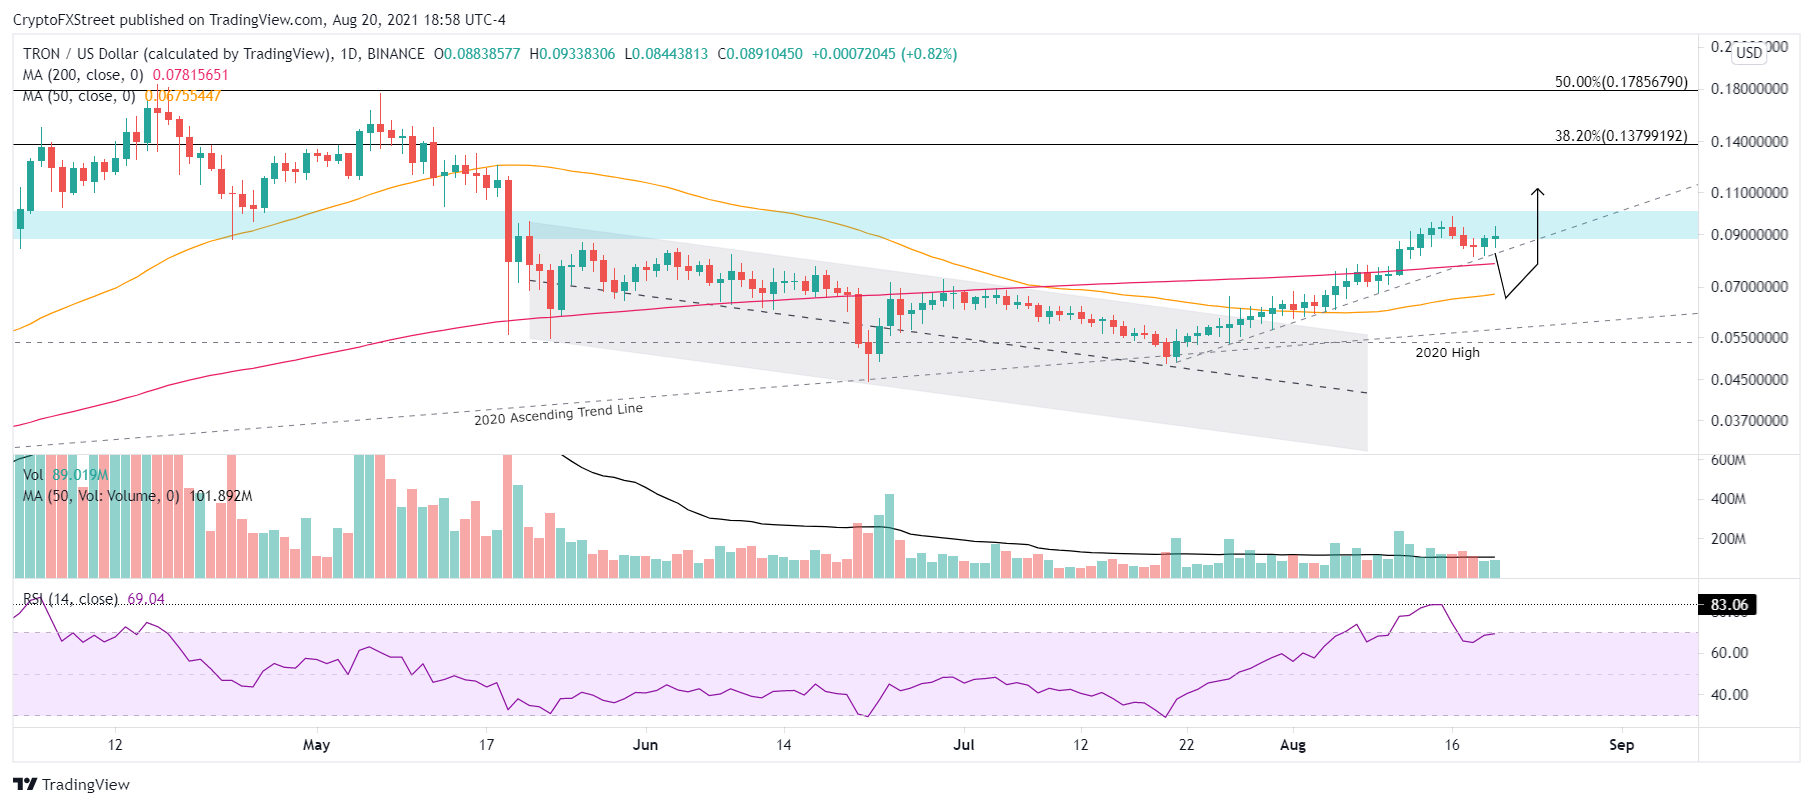
TRX/USD daily chart
The presence of the July ascending trend line and 200-day SMA may prevent a deeper pullback for TRON price, enabling a correction in time versus price. Once TRX closes above the August 16 high of $0.098 and the high of the noteworthy price resistance at $0.099, it will not encounter any serious technical obstacles until the 38.2% Fibonacci retracement of the 2018-2020 secular correction at $0.137.
The 50% retracement at $0.178 and the handle highs will also be a challenge for TRON price if the 38.2% retracement is shattered. It would represent a 100% gain from the current TRX price.
TRON price is at an inflection point as it battles a challenging range with an overbought daily RSI. Subsequently, the mystery is whether TRX can beat the resistance mentioned above without a meaningful pullback. Or, does it need to refresh the price structure and technical indicators to master a sustainable rally to the handle highs and a 100% return.
Author

Sheldon McIntyre, CMT
Independent Analyst
Sheldon has 24 years of investment experience holding various positions in companies based in the United States and Chile. His core competencies include BRIC and G-10 equity markets, swing and position trading and technical analysis.


