Top five cryptocurrencies to watch this week: BTC, ADA, SOL, MATIC, KLAY

Bitcoin’s consolidation in the current range could create trading opportunities for ADA, SOL, MATIC and KLAY over the coming days.
The U.S. core personal consumption expenditure (PCE) price index increased 0.5% in May, below market estimates of 0.6%. However, when compared year-over-year, the PCE index surged to 3.4% recording its largest gain since 1991.
While the U.S. Federal Reserve expects inflation to be transitory, analysts at BofA differ in their estimation. The bank anticipates U.S. inflation to remain high, in the 2% to 4% range, for the next two to four years and believes the Fed will hike rates in the next six months, barring a financial market crash.
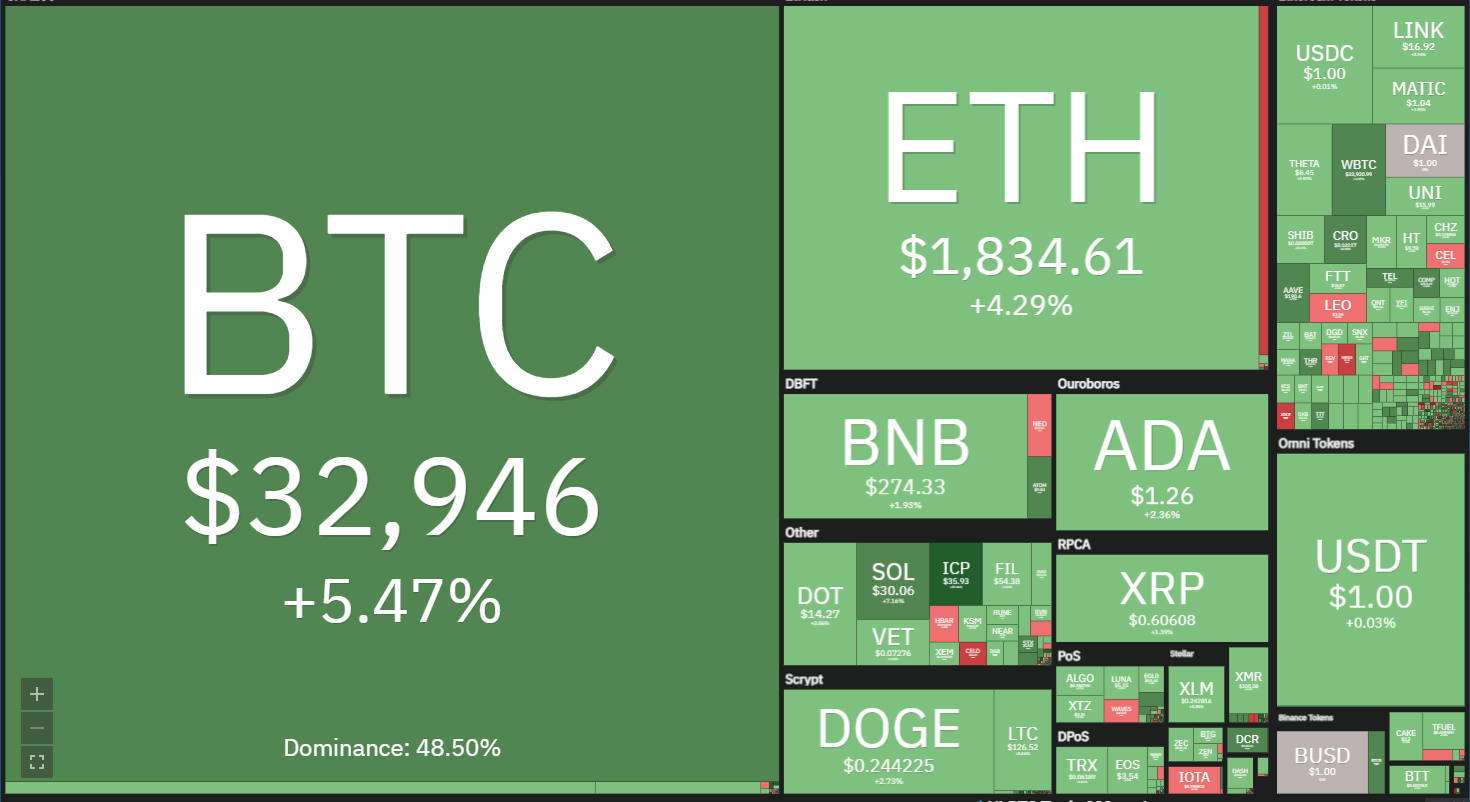
Crypto market data daily view. Source: Coin360
If inflation remains elevated, investors are again likely to focus on Bitcoin (BTC) to hedge their portfolios. A CoinShares report published on June 21 said it was unsure of inflation in the next five years but believed "adding Bitcoin and other real assets as a prudent measure to protect portfolios from the tail-risk of out-of-control inflation."
Although near-term risk remains, select cryptocurrencies could offer short-term trading opportunities to traders. During a bear phase, traders may focus on booking profits at regular intervals instead of waiting for windfall rallies. Let’s study the charts of the top-5 cryptocurrencies that may turn short-term bullish in the next few days.
BTC/USDT
Bitcoin dropped to the $28,000 to $31,000 support zone on June 26 but the positive sign is that the bulls again bought this dip. This suggests that buyers are accumulating at lower levels.
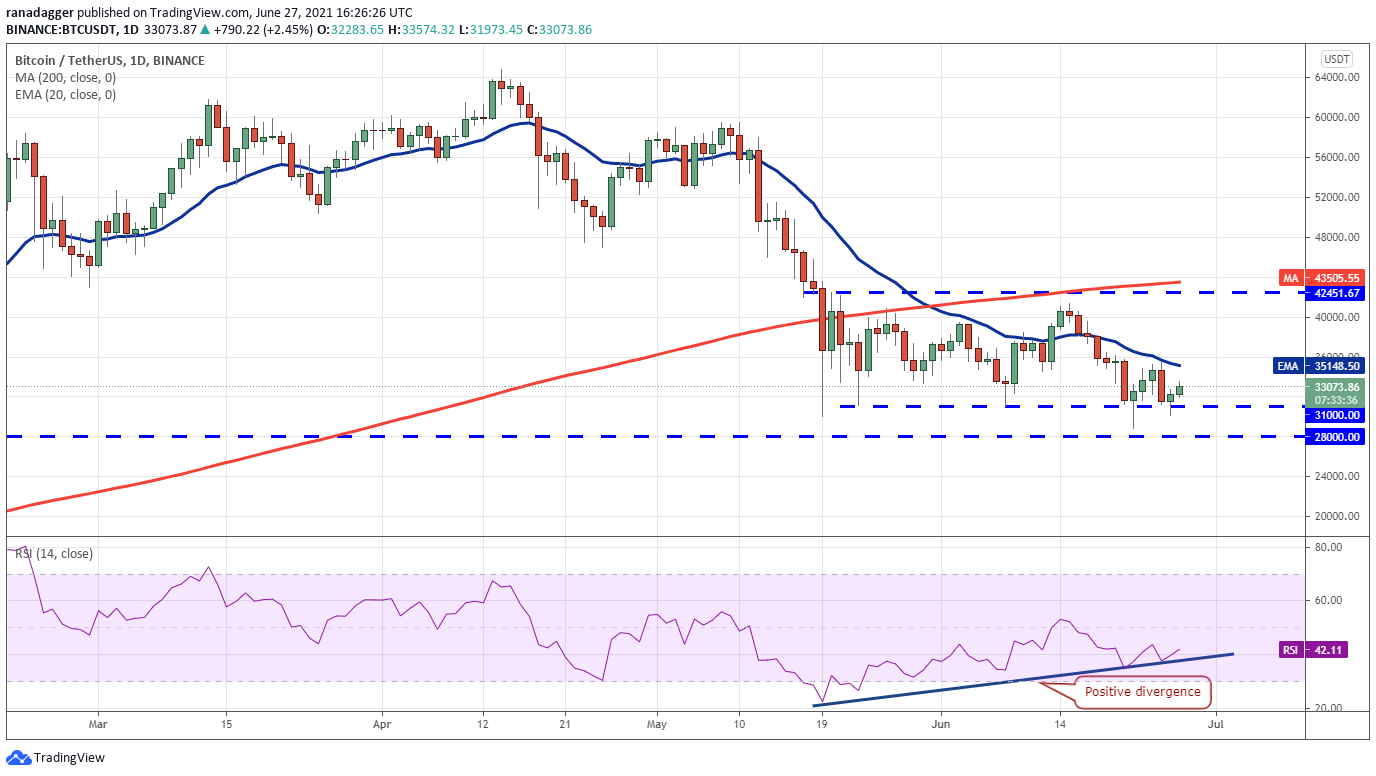
BTC/USDT daily chart. Source: TradingView
The bulls will now try to push the price above the 20-day exponential moving average ($35,148). If they manage to do that, it will suggest that the selling pressure may be reducing. The positive divergence on the relative strength index (RSI) is also pointing to a possible relief rally.
A break above the 20-day EMA could open the doors for a move to the stiff overhead resistance zone at $40,000 to $42,451.67. The 200-day simple moving average ($43,505) is just above this zone, hence the bulls may find it difficult to climb above it.
This points to a possible consolidation between $28,000 and $42,451.67 for the next few days. The longer the price trades in this range, the stronger will be the next breakout from it. The trend will favor the bears if they can sink and sustain the price below $28,000.
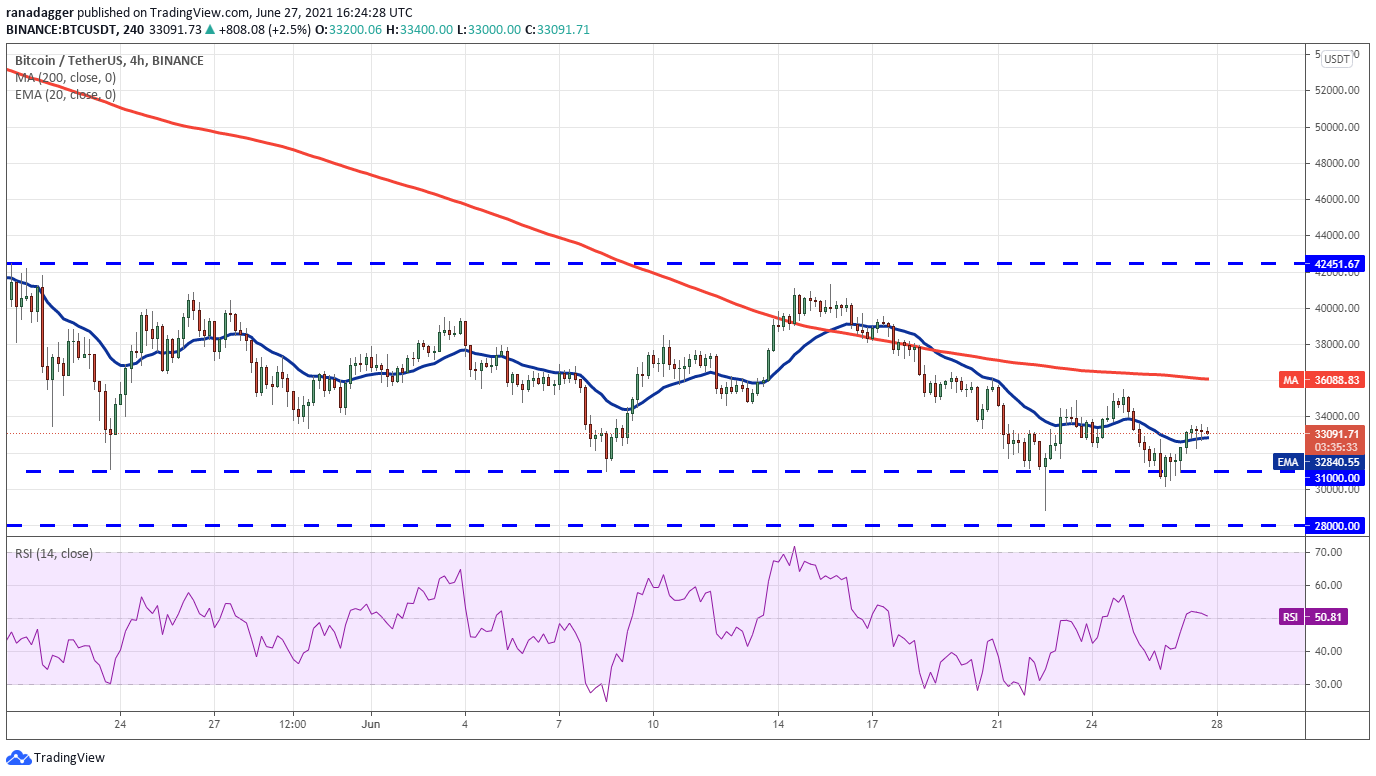
BTC/USDT 4-hour chart. Source: TradingView
The 4-hour chart shows that the bulls are attempting to form a higher bottom at $30,000. The 20-EMA has flattened out and the RSI is near the midpoint, suggesting that the sellers are losing their grip.
If the bulls sustain the price above the 20-EMA, the BTC/USDT pair could rally to the 200-SMA. A breakout of this resistance could attract further buying that may push the price to $40,527. This bullish view will invalidate if the bears sink the price below $30,000.
ADA/USDT
Cardano (ADA) rebounded off the $1 support on June 22, indicating strong accumulation near this level. However, the bulls could not push the price above the 20-day EMA ($1.39) on June 24 and 25, suggesting that bears are defending the resistance.
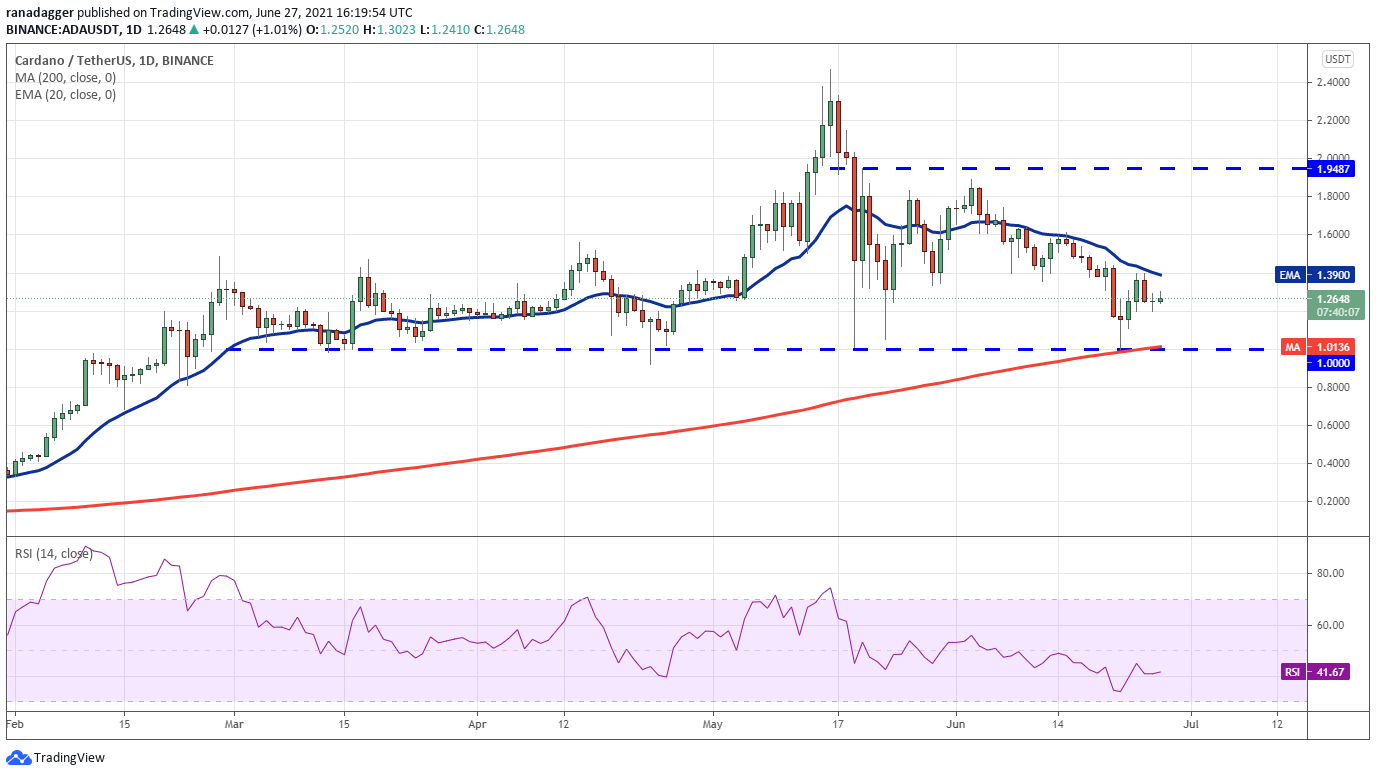
ADA/USDT daily chart. Source: TradingView
The gradually downsloping 20-day EMA and the RSI in the negative zone suggest that bears have the upper hand. The ADA/USDT pair may witness a long liquidation if the bears sink and sustain the price below $1. That could pull the price down to $0.68 and then to $0.40.
Conversely, if the bulls can thrust the price above the 20-day EMA, it will suggest that the short-term trend has tilted in favor of the bulls. The pair could then rise to $1.60 and then to the stiff overhead resistance at $1.94.
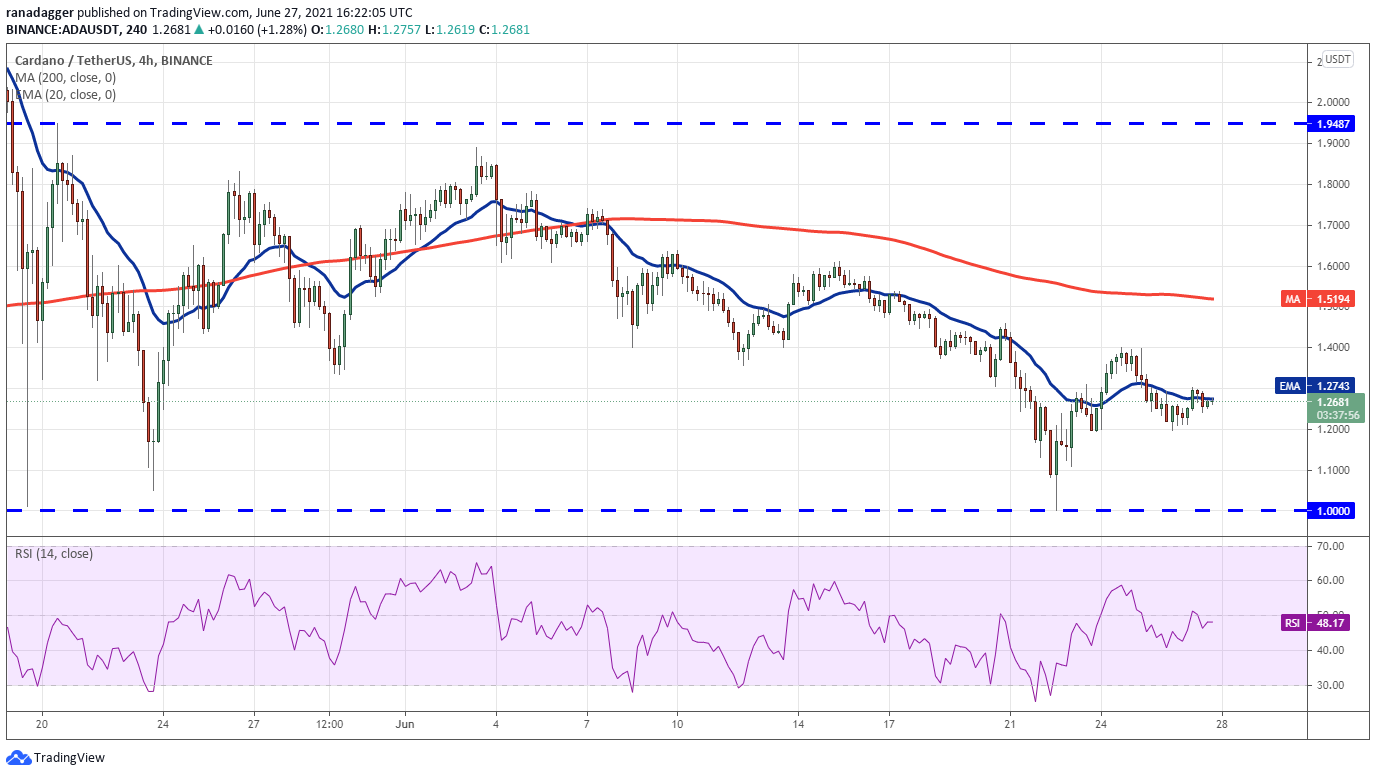
ADA/USDT 4-hour chart. Source: TradingView
The moving averages on the 4-hour chart have flattened out and the RSI near the midpoint suggest that the selling pressure is reducing. If the bulls push the price above $1.40, it will indicate the possibility of a short-term bottom formation. The pair could then attempt to rally to $1.60 and then to $1.88.
Contrary to this assumption, if the price turns down from the current level or $1.40 and plummets below $1.20, it will suggest a lack of buyers at higher levels. The pair may then drop to the critical support at $1.
SOL/USDT
The long tail on Solana’s (SOL) June 22 candlestick shows that traders are aggressively defending the 200-day SMA ($20). However, the relief rally could not scale above the 20-day EMA ($33), indicating that bears are selling on rallies.
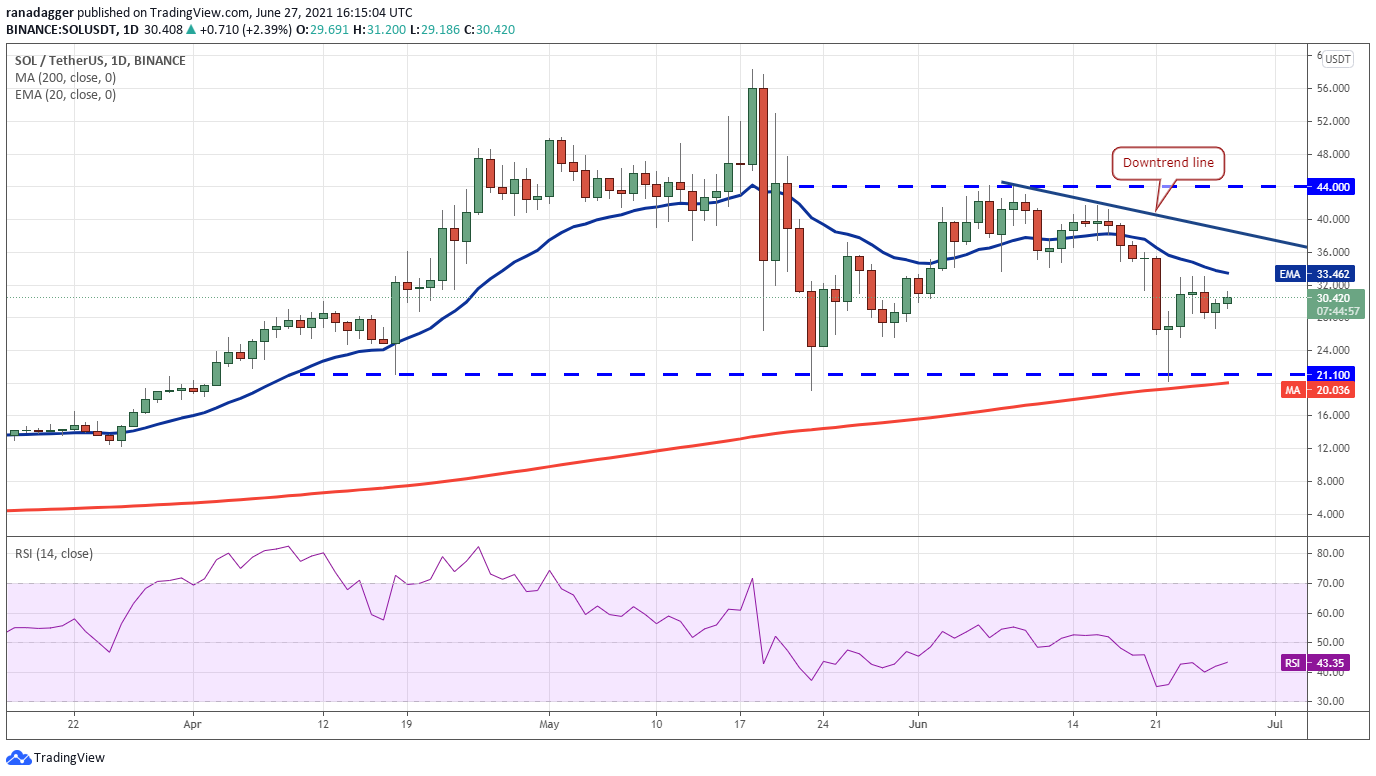
SOL/USDT daily chart. Source: TradingView
The buyers are currently attempting to form a higher low at $26.65. If they can push and sustain the price above the 20-day EMA, the SOL/USDT pair could pick up momentum and move up to the downtrend line and then to $44.
However, the downsloping 20-day EMA and the RSI in the negative territory suggest that bears will have other plans. They will try to defend the 20-day EMA and sink the price below $26.65. If this support cracks, the pair may drop to $21.10.
A strong rebound off this support will suggest that bulls are accumulating on dips. The pair could then consolidate between $21.10 and $44 for the next few days.
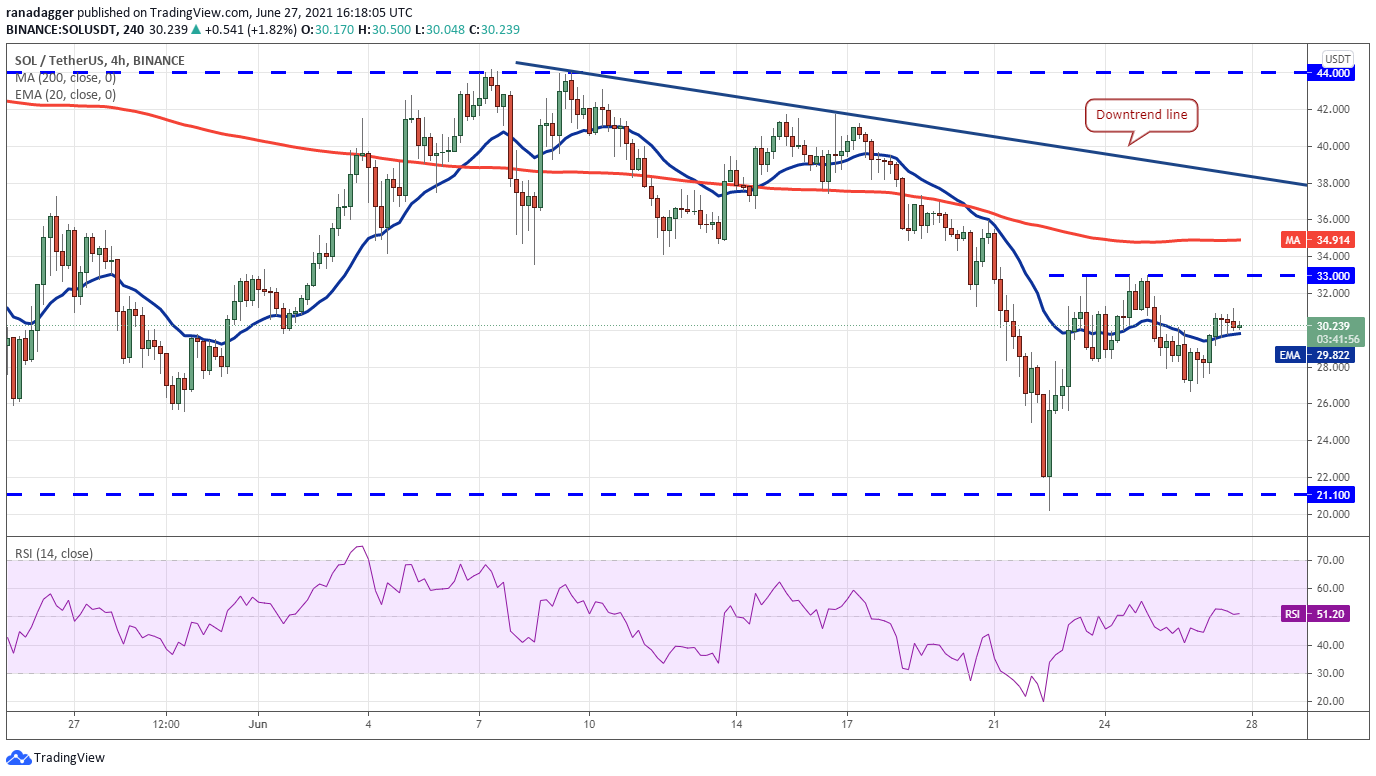
SOL/USDT 4-hour chart. Source: TradingView
The 20-EMA on the 4-hour chart has flattened out and the RSI is near the midpoint, indicating a balance between buyers and sellers. This balance may tilt in favor of the bulls if they push and sustain the price above $33.
Such a move could clear the path for a move to the downtrend line and then to $42. On the other hand, if the price turns down from the current level or $33, The bears will try to break the support at $26.65. If that happens, the advantage may tilt in favor of the bears.
MATIC/USDT
Polygon (MATIC) has been trading below the 20-day EMA ($1.29) for the past few days but the positive sign is that the bulls have not allowed the price to dip to the May 23 low at $0.74. This suggests a lack of sellers at current levels.
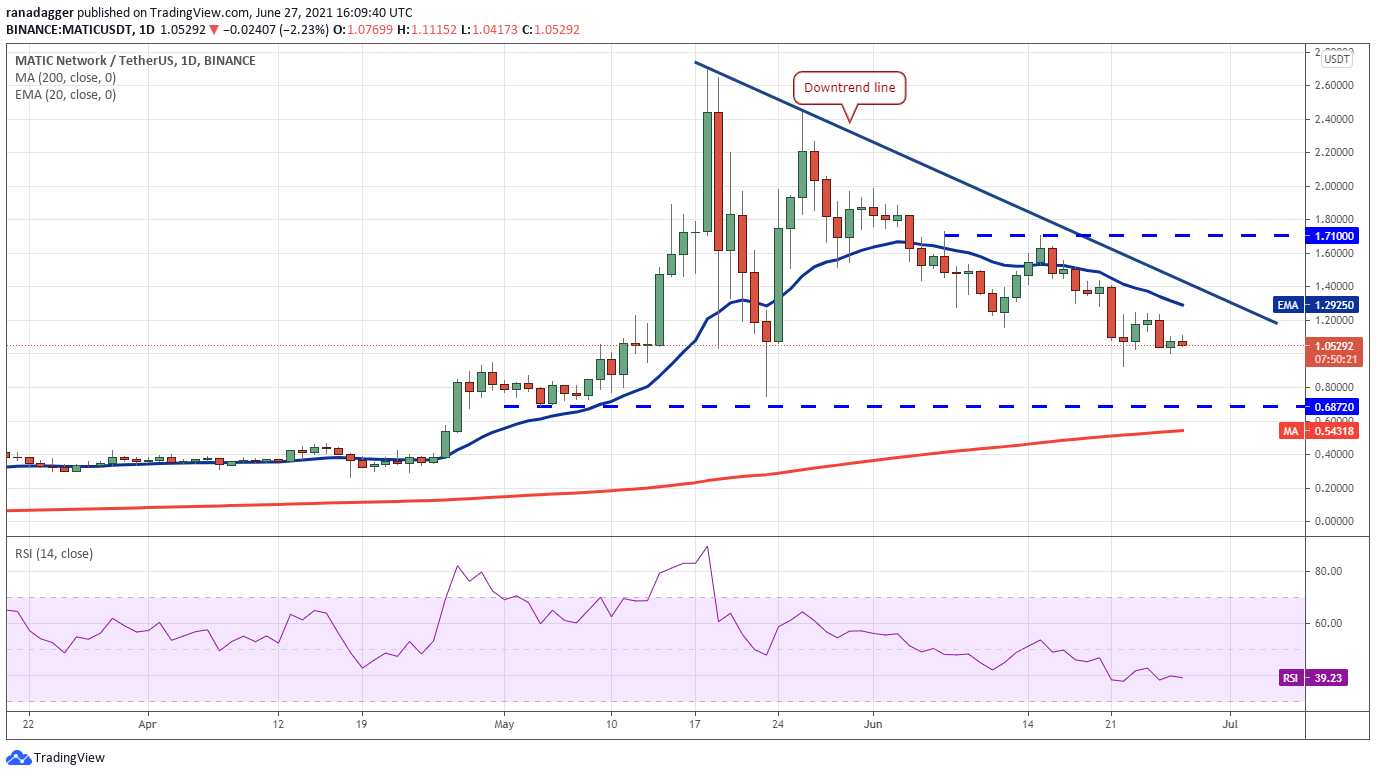
MATIC/USDT daily chart. Source: TradingView
If the bulls regroup and push the price above the downtrend line, it will indicate that the correction may be over. The MATIC/USDT pair could then rise to $1.71 and later to the psychological resistance at $2.
However, the bears may have other plans. The downsloping 20-day EMA and the RSI in the negative zone suggest that sellers have the upper hand. If they sink the price below $0.92, the pair may drop to the $0.74 to $0.68 support zone.
The bulls are likely to defend this zone aggressively. A strong bounce will suggest accumulation at lower levels and the bulls may then try to push the price above the downtrend line.
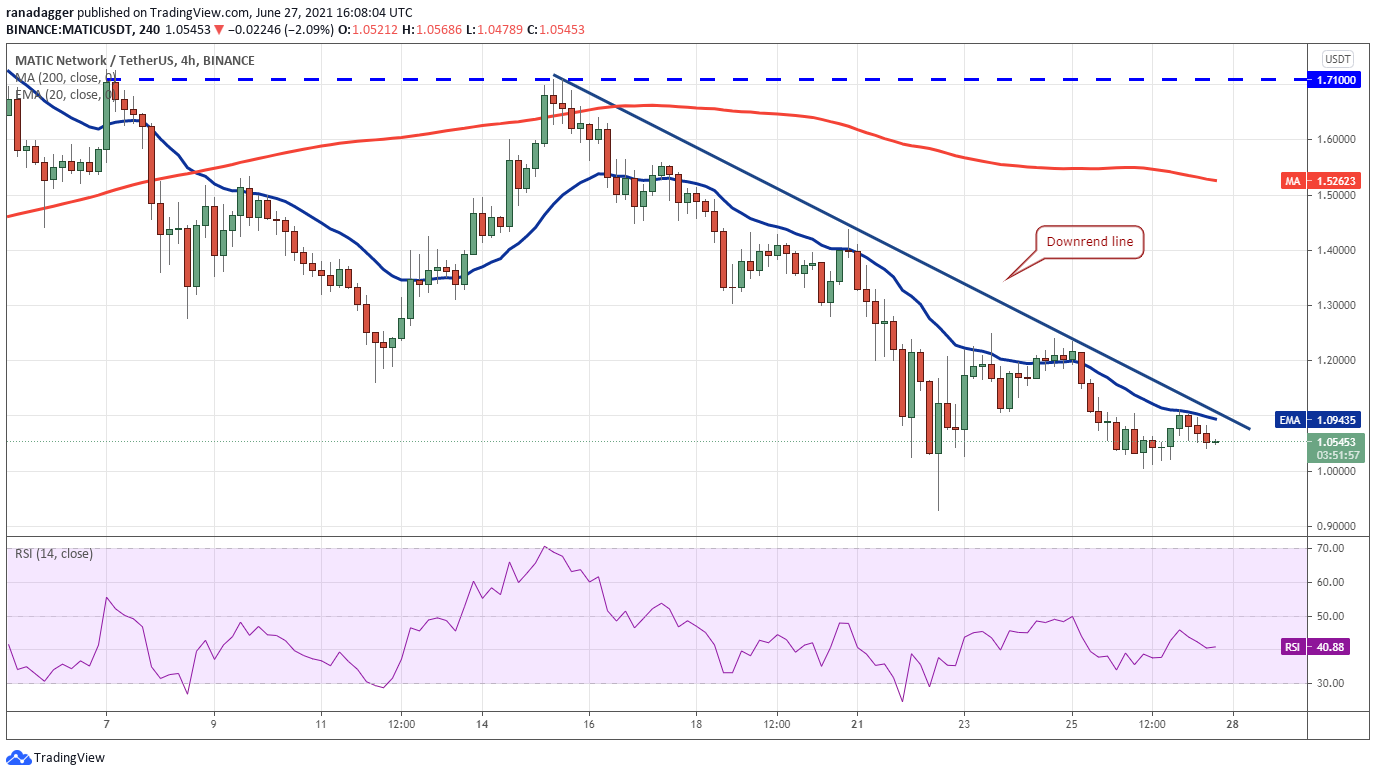
MATIC/USDT 4-hour chart. Source: TradingView
The 4-hour chart shows that the bears are aggressively defending the downtrend line. The downsloping 20-EMA and the RSI in the negative zone indicate advantage to the bears. If they sink the price below $1, the pair may drop to $0.92.
Conversely, if the price rebounds off $1, the bulls will make one more attempt to drive the price above the downtrend line. If they succeed, it will suggest that bulls are trying to make a comeback. The pair may pick up momentum on a breakout and close above $1.25.
KLAY/USDT
Klaytn (KLAY) has been trading below the 20-day EMA ($1.02) for the past many days but the RSI is showing a positive divergence. This indicates that the sellers may be losing their grip.

KLAY/USDT daily chart. Source: TradingView
If the bulls push and sustain the price above the 20-day EMA, it will be an indication that a trend change is possible. However, the bears are unlikely to give up easily. They will try to stall the recovery in the $1.24 to $1.29 zone.
If the price turns down from the overhead zone but does not dip below the 20-day EMA, it will indicate that the bulls are trying to make a comeback. A breakout of the resistance zone could attract buyers who may then challenge the 200-day SMA ($1.51).
A breakout and close above the 200-day SMA will indicate that the downtrend may be over in the short term. This positive view will invalidate if the bears sink the price below $0.72.
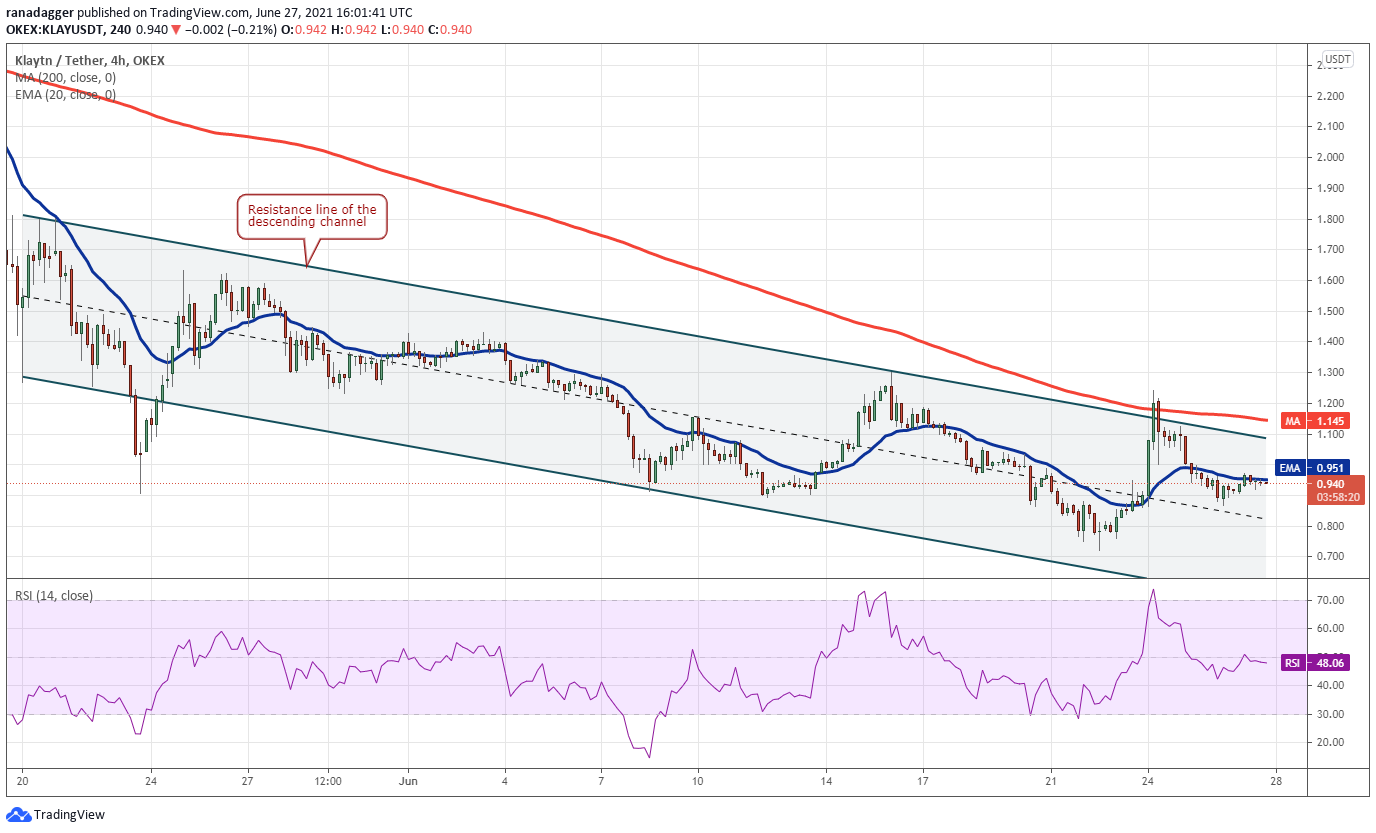
KLAY/USDT 4-hour chart. Source: TradingView
The 4-hour chart shows the KLAY/USDT pair is trading inside a descending channel. The bulls had pushed the price above the channel and the 200-SMA but they could not sustain the higher levels.
If the bulls push and sustain the price above the 20-EMA, the pair may again try to rise above the channel and the 200-SMA. If that happens, the pair may start a new uptrend that could reach $1.62.
Contrary to this assumption, if the pair breaks below $0.86, the decline could extend to $0.72.
Author

Cointelegraph Team
Cointelegraph
We are privileged enough to work with the best and brightest in Bitcoin.


