Top 3 Price Prediction Bitcoin, Ethereum, XRP: market moves in fits and starts
- Litecoin has become the best-performing altcoin for no particular reason.
- Top-3 coins may be ready for a short-term correction from the recent highs.
- We will need to see a sustainable move above the critical resistance area to attract new buyers to the market.

Friday morning has brought Litecoin to the limelight. The seventh-largest coin with the current market capitalization of $4.3 billion has gained over 10% of its value in recent 24 hours. The coin tested area above $70.00, which is the highest level since September 23, 2019. While the fundamental factors behind the stellar growth are still unclear, the coin may be poised for an extended bullish run as long as the price stays above $60.00.
LTC/USD Daily Chart
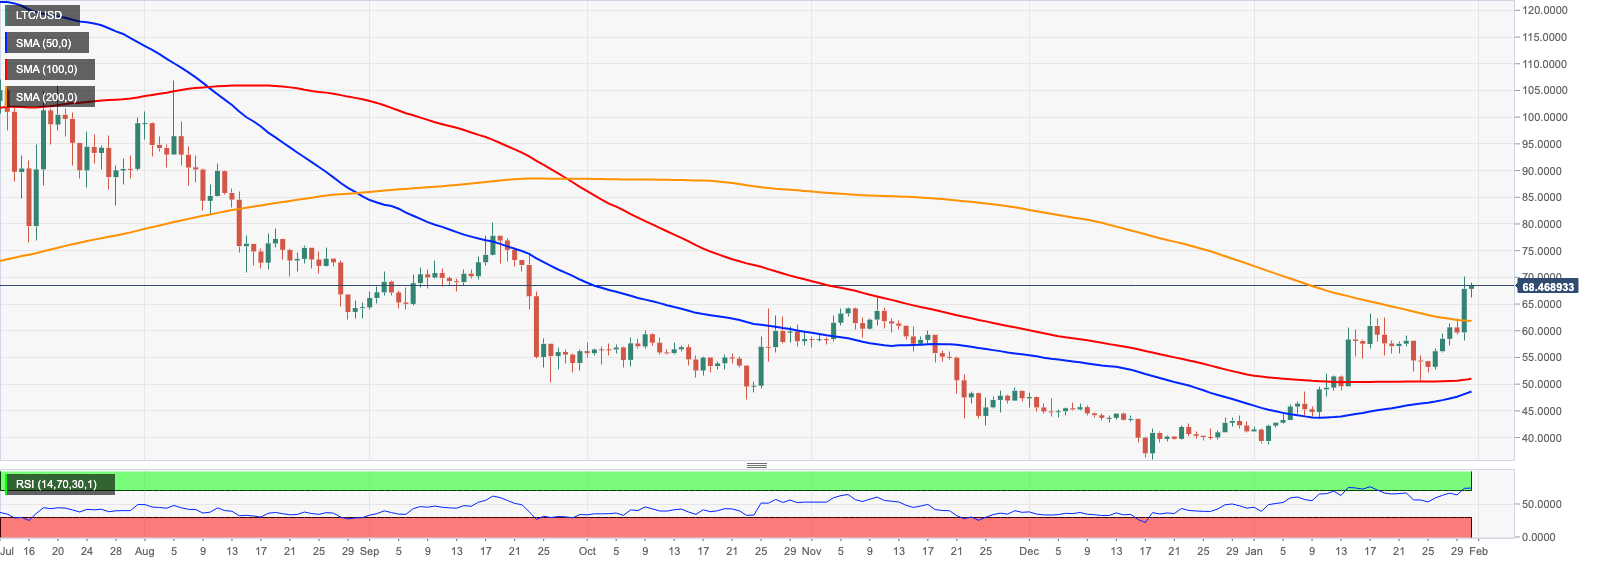
This support is an important milestone in Litecoin's price momentum that can serve a catalyst for another bull's rally. However, traders should exercise caution at this levels as the rejection from $70.00 may trigger downside correction, before another upside wave starts. The RSI on a daily chart is on the overbought territory, which also implies a retreat from the recent highs.
BTC/USD Daily Chart
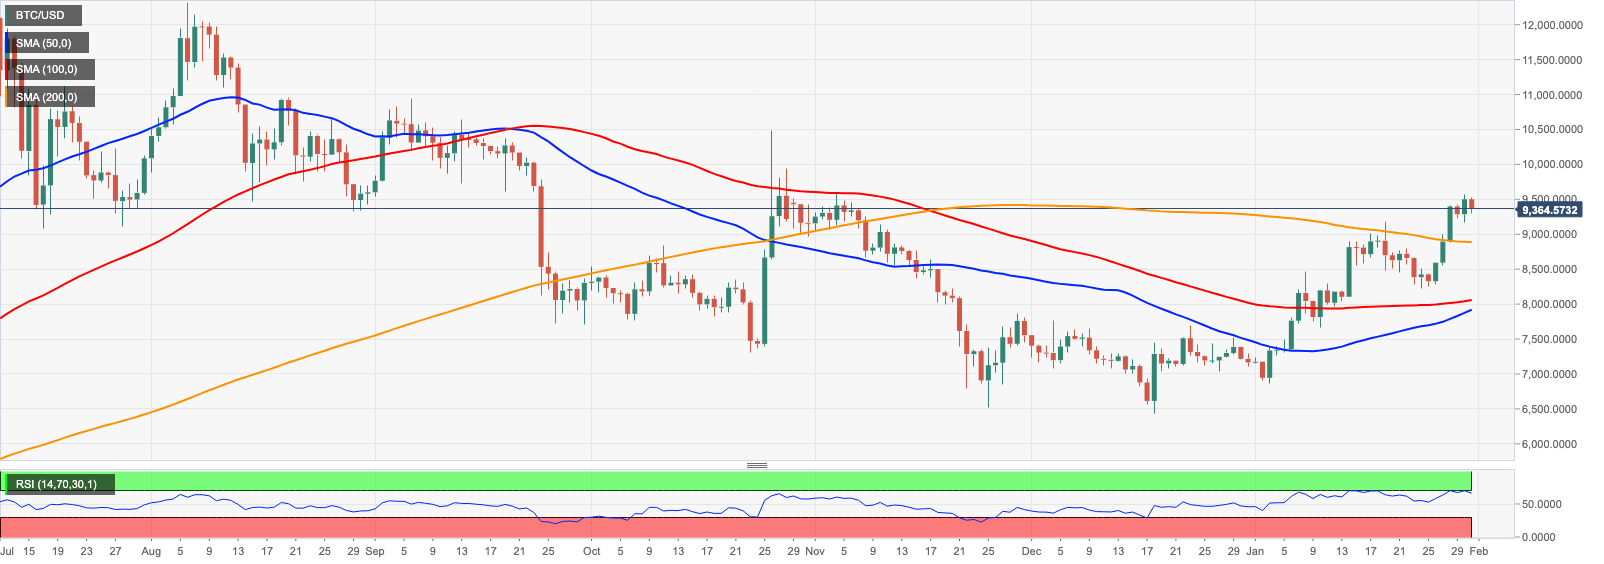
BTC/USD is currently trading at $9,345 (+1.67% on a day-to-day basis) after reaching a new top at $9,568 level on Thursday, the coin retreated to the previous range. Considering that the RSI in a daily chart has reversed to the downside from an overbough area, more sell-off within a current channel may be expected into the end of the week.
Above the current price, the first resistance level is created by the middle line of 1-hour Bollinger Band on approach to $9,500, the next comes at psychological $10,000.
Below the current price, the first support level lies at $9,200 (SMA100 1-hour), then the second is at $9,000 reinforced by SMA200 daily and the third one is at $8,550.
From the technical point of view, BTC/USD bottomed at $6,412 on December 18, 2019 and has been recovering ever since. A sustainable move above $9,000 bodes well Bitcoin's long-term perspective; however, we still need to regain ground above $9,500 to increase an upside momentum.
ETH/USD Daily Chart
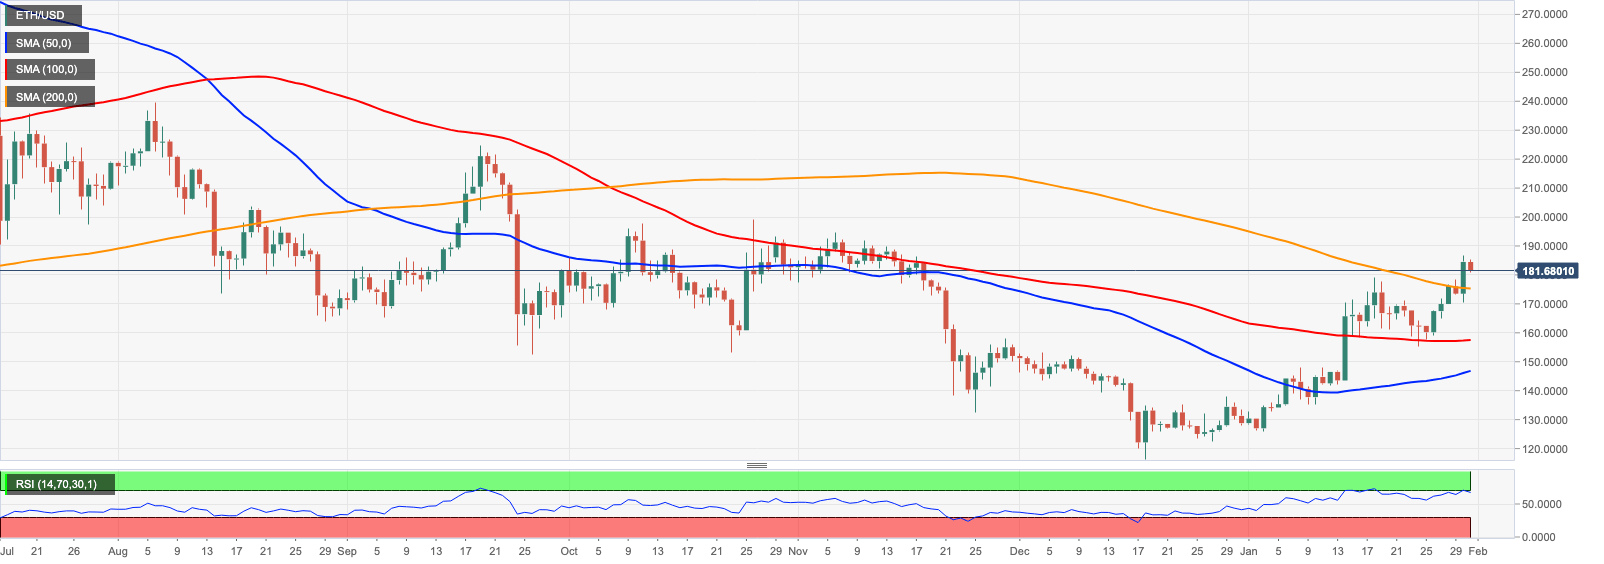
ETH/USD is currently trading at $181.25 (+5.3% on a day-to-day basis), off the recent high registered at $186.76. The coin has printed a large green candle on Thursday and settled well above SMA200 daily currently at $175.28, which is a strong bullish signal in the long run. The next major upside barrier is created by psychological $200.00
Above the current price, the first resistance level is at $180, then the second at $184 and the third one at $190.
Below the current price, the first support level is at $175, reinforced by the above-said SMA200 daily, then the second comes at $160 with SMA100 daily marginally below, and the third one is at $155.
The RSI on the daily chart is reversing down from an overbought territory, which means the price may experience a short-lived correction before another bullish attempt.
XRP/USD Daily Chart
-637160586910133567.png)
XRP/USD is currently trading at $0.2400 (+1.7% on a day-to-day basis). The third largest coin has retreated from the recent high at $0.2464 amid global correction on the cryptocurrency market. XRP/USD lags behind other major digital assets as it is still well below the recent top of $0.2540.
Above the current price, the first resistance level is registered at $0.2440, which is the upper line of 4-hour Bollinger Band, then comes the second resistance at $0.2540 (2020 high) and the third one at $0.26.
Below the current price, the first support level is created by SMA100 daily at $0.235, then the second comes at $0.2200 and the third one is at $0.20.
The RSI on a daily chart stays flat in the neutral position, which means the coin may continue consolidation patter around the current levels.
Get 24/7 Crypto updates in our social media channels: Give us a follow at @FXSCrypto and our FXStreet Crypto Trading Telegram channel
Author

Tanya Abrosimova
Independent Analyst


