Top 3 Price Prediction Bitcoin, Ethereum, Ripple: XRP price takes point in recovering weekend crash losses
- Bitcoin price has recovered only 8.5% since its crash, while Ethereum and Ripple have surged 18% and 32%, respectively.
- Ethereum price and BTC face headwinds stalling their upswings while XRP bulls hint at a positive outlook.
- Ripple price could surge 30% due to the presence of a strong foothold at $1.34.

The entire cryptocurrency market tumbled this weekend due to rumors from unfounded sources circulating on Twitter. At the time of writing, most altcoins, especially DeFi coins, seem to be recovering quickly while Bitcoin and Ethereum, not so much.
Bitcoin price to experience resistance on its way up
On the 4-hour chart, Bitcoin price shows a clear rejection at the upper boundary of the demand zone at $57,329 that was flipped into the supply zone after the recent sell-off. This move indicates that the bullish momentum is not strong enough to push through this significant level.
Hence, investors can expect range-bound moves from BTC price as long as it fails to climb above this zone. Even if the buyers manage to slice through the resistance zone mentioned above, it will face hurdles at the 100 Simple Moving Average (SMA) at $59,400 and the Momentum Reversal Indicator (RMI) at $59,900.
Beyond these levels, the 50 SMA at $60,700 will prevent any short-term bullish upswings from passing through.
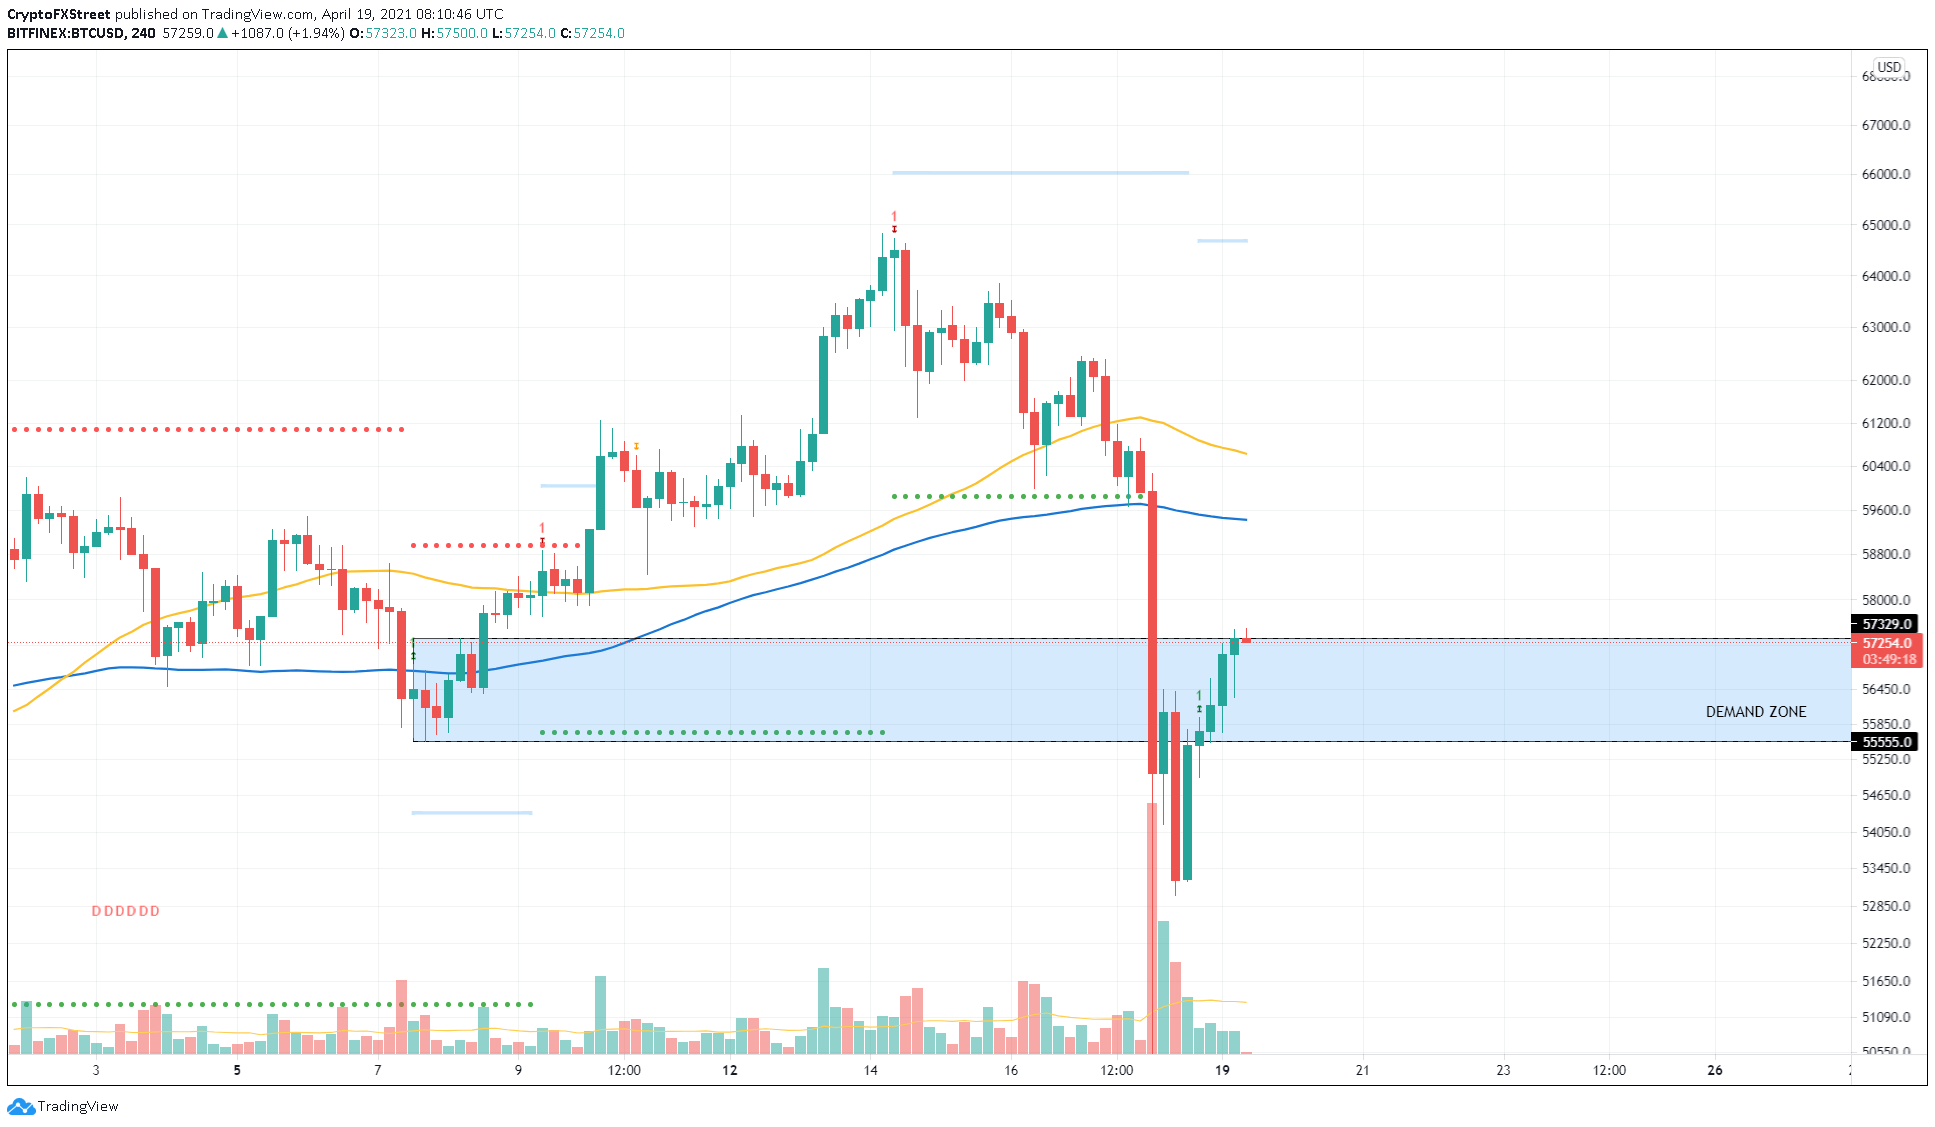
BTC/USD 4-hour chart
Regardless of the bearish pressure, a sudden surge in buying pressure that leads to a decisive close above $57,329 is significant and could restart the upswing to $60,000.
Ethereum price follows pioneer cryptocurrency’s footsteps
Ethereum price has surpassed the 100 SMA on the 4-hour chart but faces the 50 SMA at $2,300 and two supply zones that extend from $2,313 to $2,544. Hence, ETH’s arduous journey will need a high concentration of buyers to join hands if new highs are in question.
So the logical direction for the smart contract token is south. The sellers might invoke a retest of the 100 SMA at $2,184.
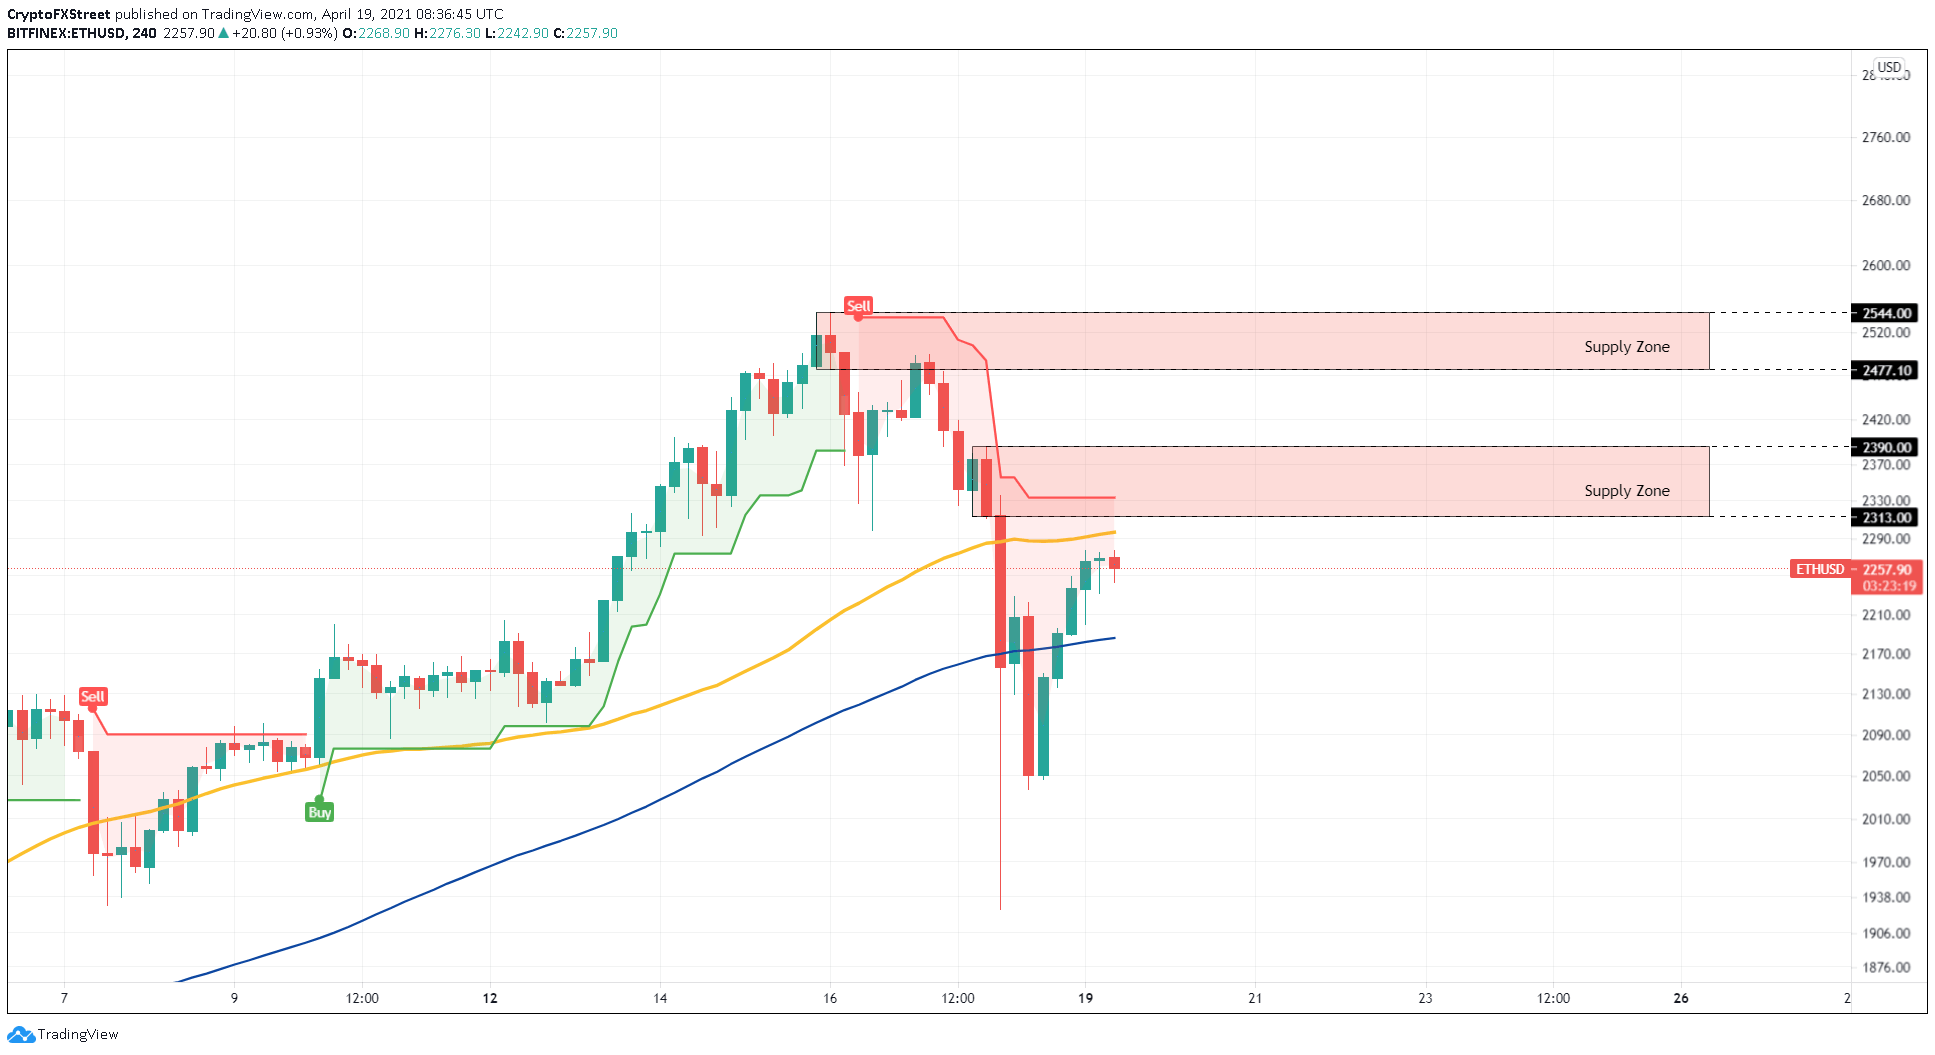
ETH/USD 4-hour chart
If Ethereum price shatters through the 50 SMA and erects a solid candlestick close above $2,333, it will produce a buy signal from the SuperTrend indicator that would signal a rise in short-term bullish momentum.
Such a move might attract market participants to buy ETH. If investors keep piling up, then the bid orders might snowball, pushing the pioneer altcoin toward the lower band of the next supply zone at $2,477.
Ripple price plans to revisit recent highs
XRP price has surged a whopping 32% since its crash and is currently hovering around $1.40. The overall outlook for the remittance token is bullish due to the confluence of the MRI’s State Trend Support and the upper end of the demand zone at $1.34.
Now, Ripple could bounce off this crucial level and kick start another upswing that would set up a higher high near the bottom end of the supply zone at $1.80. If this bullishness continues to persist, there is a high chance that XRP price could indeed retest the recent highs at $1.96.
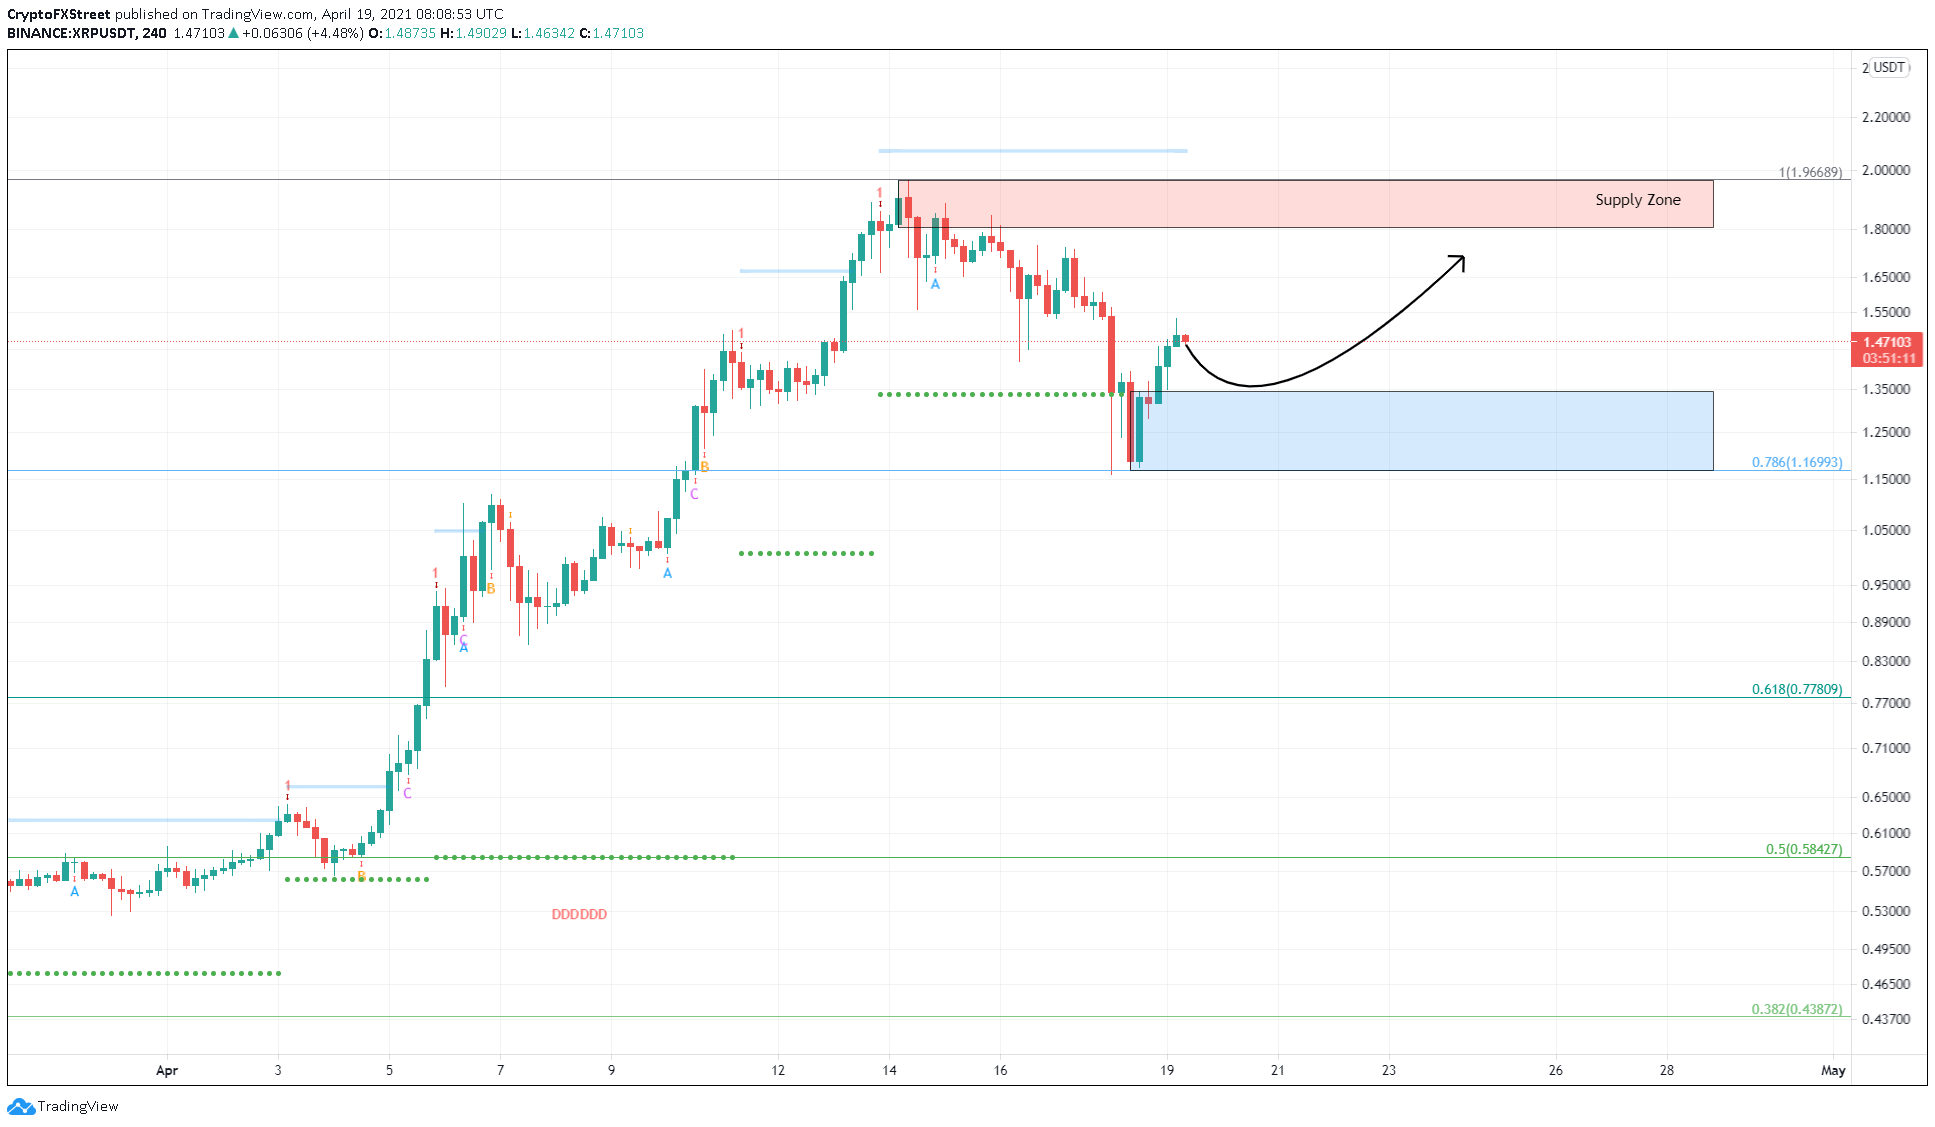
XRP/USDT 4-hour chart
However, an unforeseen event that results in a burst of selling pressure could null the demand zone. Under these circumstances, investors can expect the remittance token to slide 14% toward the next support level at $1.
Author

Akash Girimath
FXStreet
Akash Girimath is a Mechanical Engineer interested in the chaos of the financial markets. Trying to make sense of this convoluted yet fascinating space, he switched his engineering job to become a crypto reporter and analyst.


