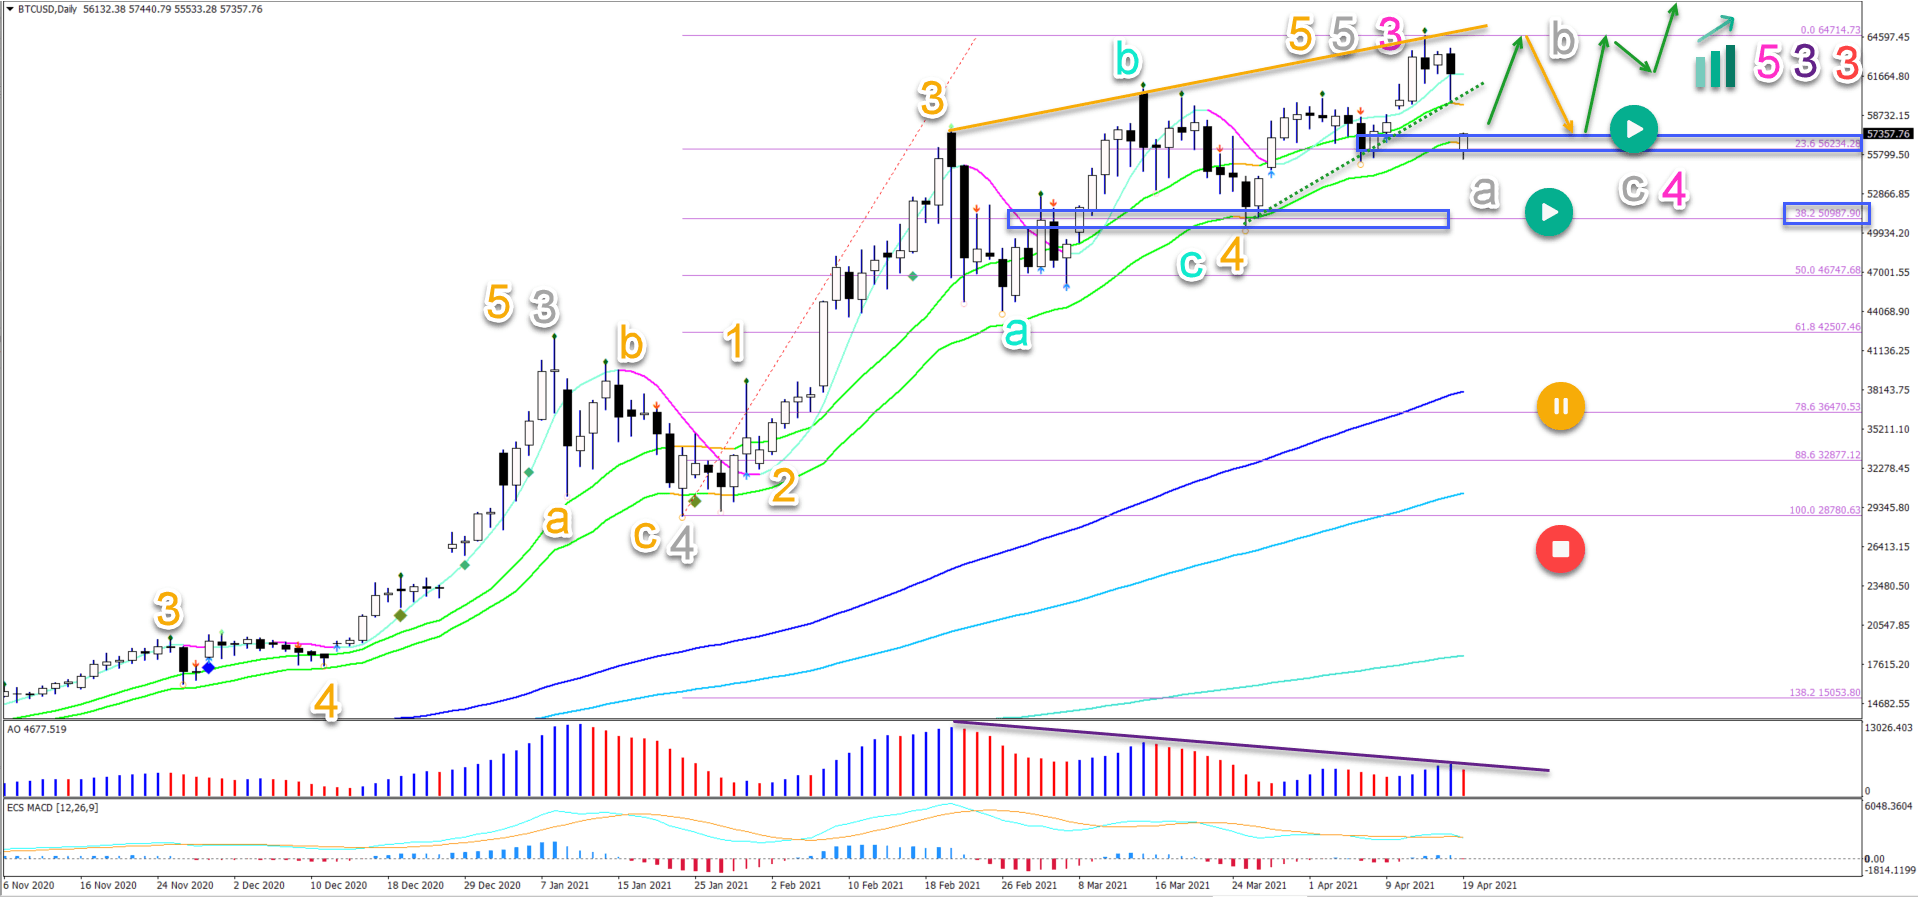
Bitcoin’s weekend decline finds support at shallow Fibonacci levels
-
Bitcoin (BTC/USD) made a strong decline during the weekend. The price drop occurred after breaking the 60k resistance last week and reaching the first $65k target.
-
Although the bearish correction was impulsive, this article will analyse why the uptrend still has better odds than a reversal. Let’s start.
-
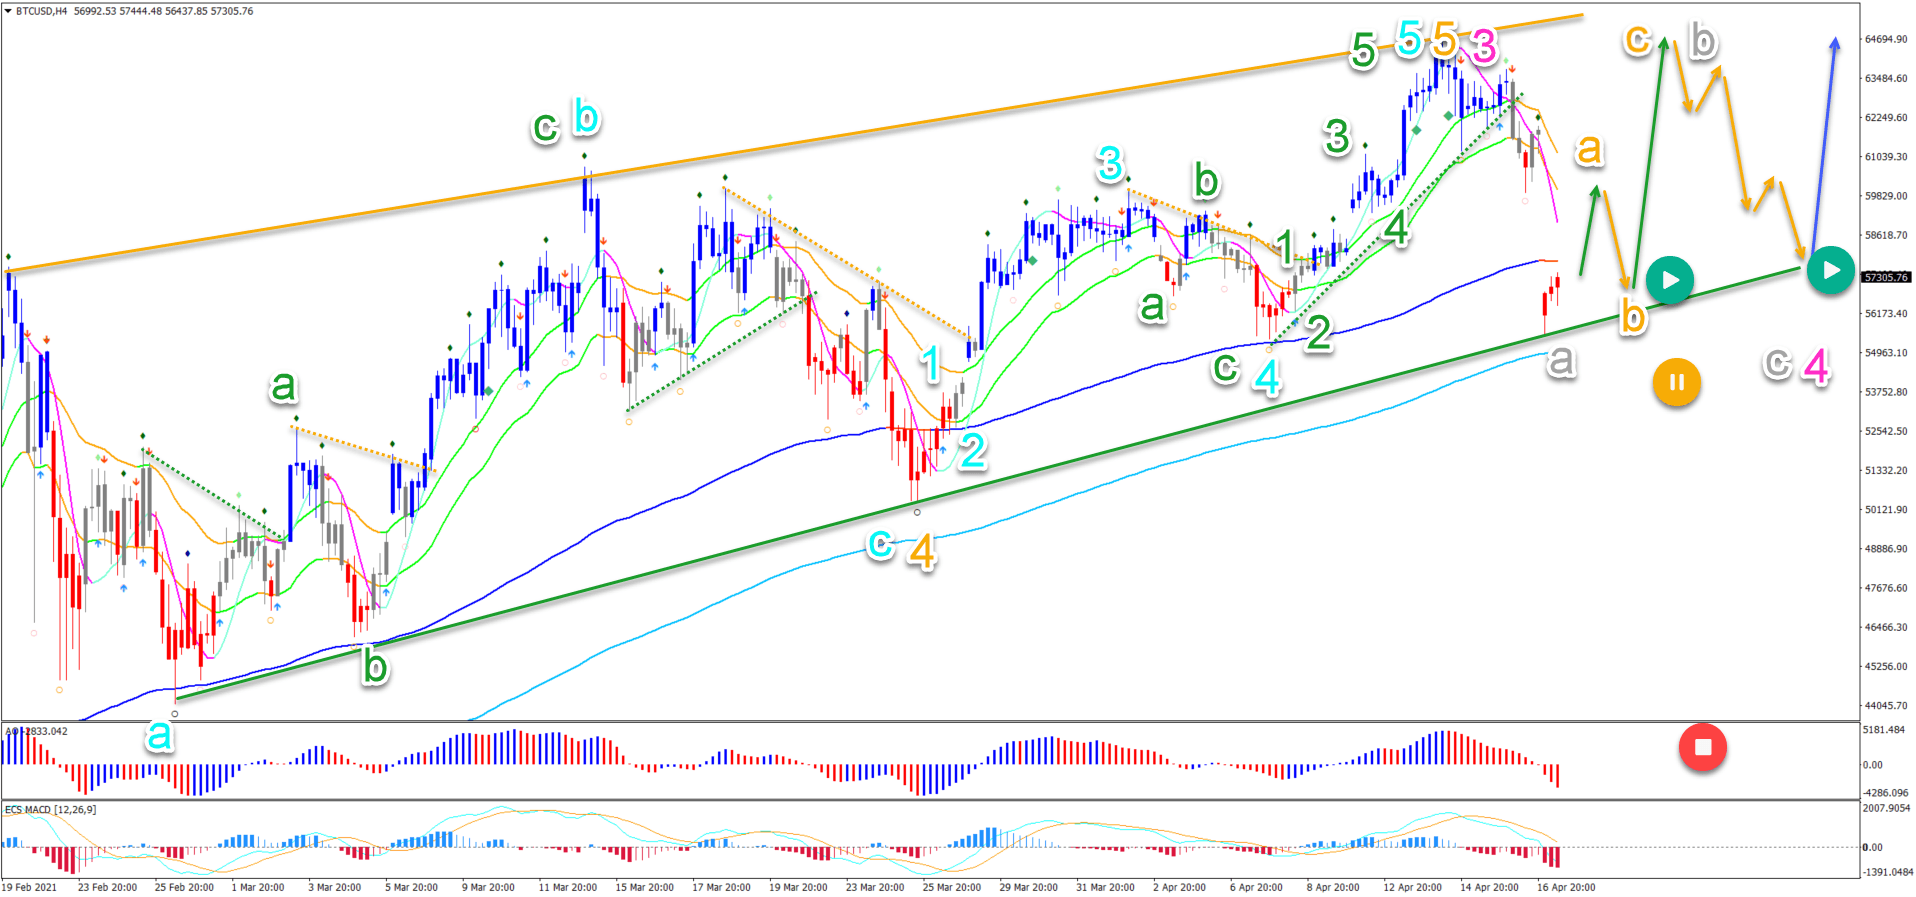
On the 4 hour chart, we can see the bearish correction took price action from the top of the channel back down to the bottom of the channel and the long-term moving averages.

Price charts and technical analysis
The BTC/USD completed the wave 4 (orange) as mentioned last time. We considered the next push up as a wave 5 (orange):
-
This wave 5 did not move up that far and high, but it is quite normal for the uptrend to lose some momentum in a wave 5 (purple line in the AO). There was a small rising wedge pattern that probably supported the slow move up.
-
The wave 5 (orange) of wave 5 (grey) probably completed a larger wave 3 (pink). The wave 3 is showing overall a lot of momentum (strong AO bars).
-
The bearish correction, even though price dropped a lot during the weekend, does not change the overall uptrend because price action is respecting the shallow 23.6 and 38.2% Fibonacci retracement levels (blue boxes).
-
The bounce at the Fibs is typical for a wave 4 (pink). Another correction could take place via an ABC (grey) pattern.
-
The first breakout above the 21 ema zone is therefore risky because price could make a higher low first. But a 2nd breakout above the 21 ema zone and the 60-62.5k resistance zone followed by the top at 65k should create another strong push up later in April, May or June.
-
The next targets are located at the round levels of $70k, $75k, and even $100k.
-
A break below the support at 50k would certainly place the uptrend on hold and perhaps even indicate an early end.
On the 4 hour chart, we can see the bearish correction took price action from the top of the channel back down to the bottom of the channel and the long-term moving averages:
-
A bullish bounce could indicate that the bearish decline is just a correction.
-
The uptrend, however, might take a small pauze as price action creates a potential wave 4 (pink).
-
A retest of the previous top and bearish bounce could indicate a wave B (grey). An ABC (orange) correction could emerge within wave B (grey).
-
If there is a 5 wave pattern moving up, then the uptrend might be immediately taking place.
-
A retest of the support trend line could take place within wave B (orange) and after wave C (grey).This could indicate the end of the correction.
-
The analysis has been done with the ecs.SWAT method and ebook.
Author

Chris Svorcik
FS method
Chris Svorcik is a trader, analyst, and educator with over 15 years of experience in financial markets, specializing in moving averages, market structure, and price patterns.


