World Liberty Financial recovers as community votes to unlock treasury funds for USD1 adoption
- World Liberty Financial recovers over 3% on Friday, holding ground at a key support trendline.
- Community begins voting to unlock roughly 5% WLFI treasury funds to incentivize USD1 stablecoin adoption.
- Derivatives data remains mixed as futures Open Interest rises amid negative funding rates.

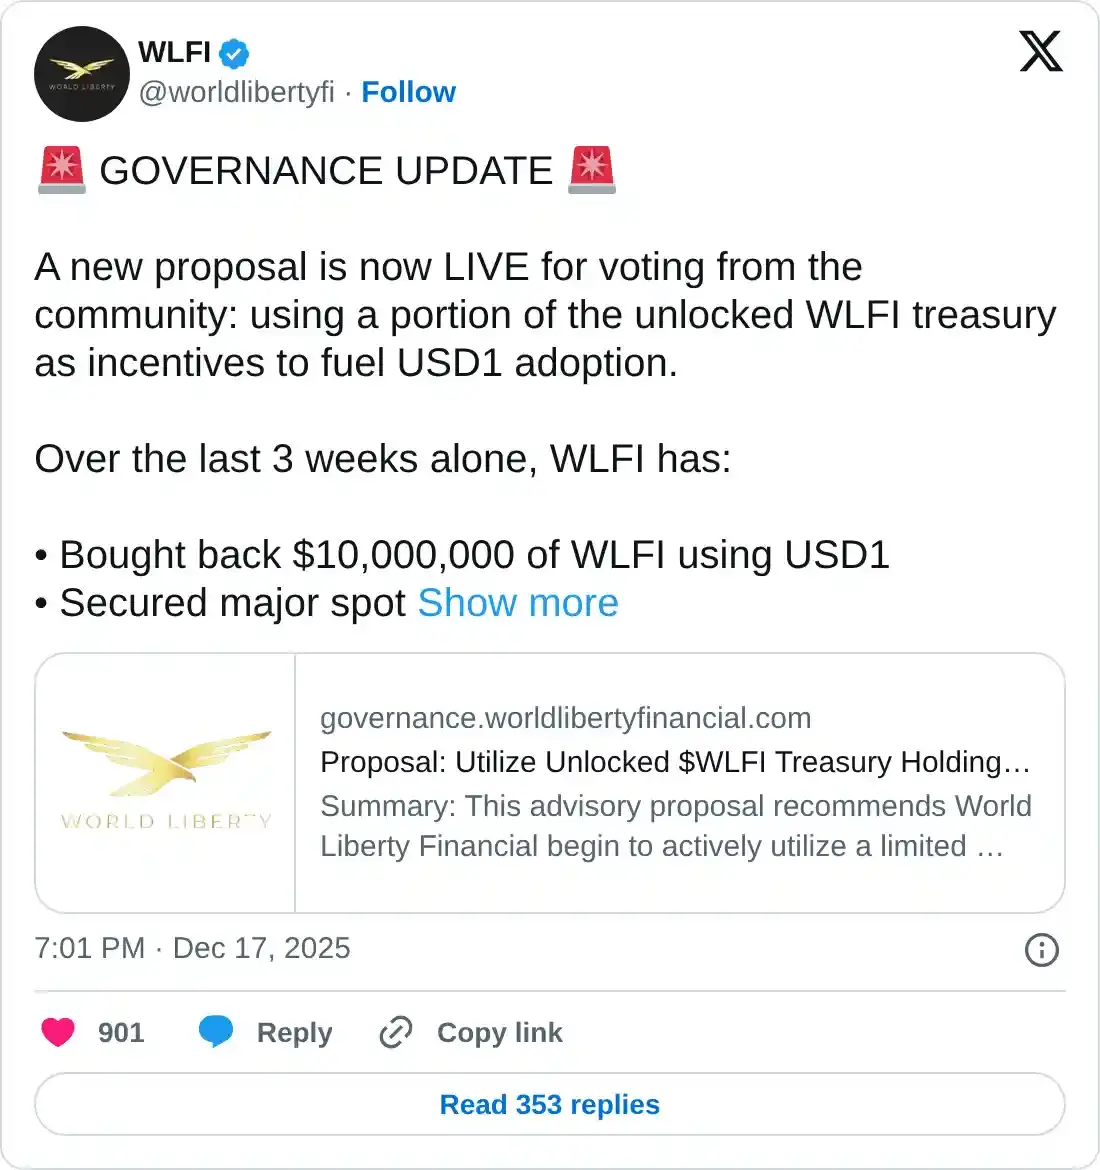
World Liberty Financial (WLFI) trades around $0.13 at press time on Friday, with a nearly 3% bounce back from a key support trendline. The recovery aligns with the ongoing community voting on WLFI treasury funds to boost the USD1 stablecoin adoption. Still, retail sentiment around WLFI remains mixed, as capital inflows surge while bearish sentiment persists.
Retail demand stalls as voting on treasury unlock for USD1 adoption begins
The World Liberty Financial community is voting on a new proposal to boost USD1 stablecoin growth, which considers to utilize almost 5% of the unlocked WLFI treasury as incentives. Higher adoption rates of USD1 on centralized and decentralized platforms would boost integrations, usage, and inflows into the WLFI ecosystem.
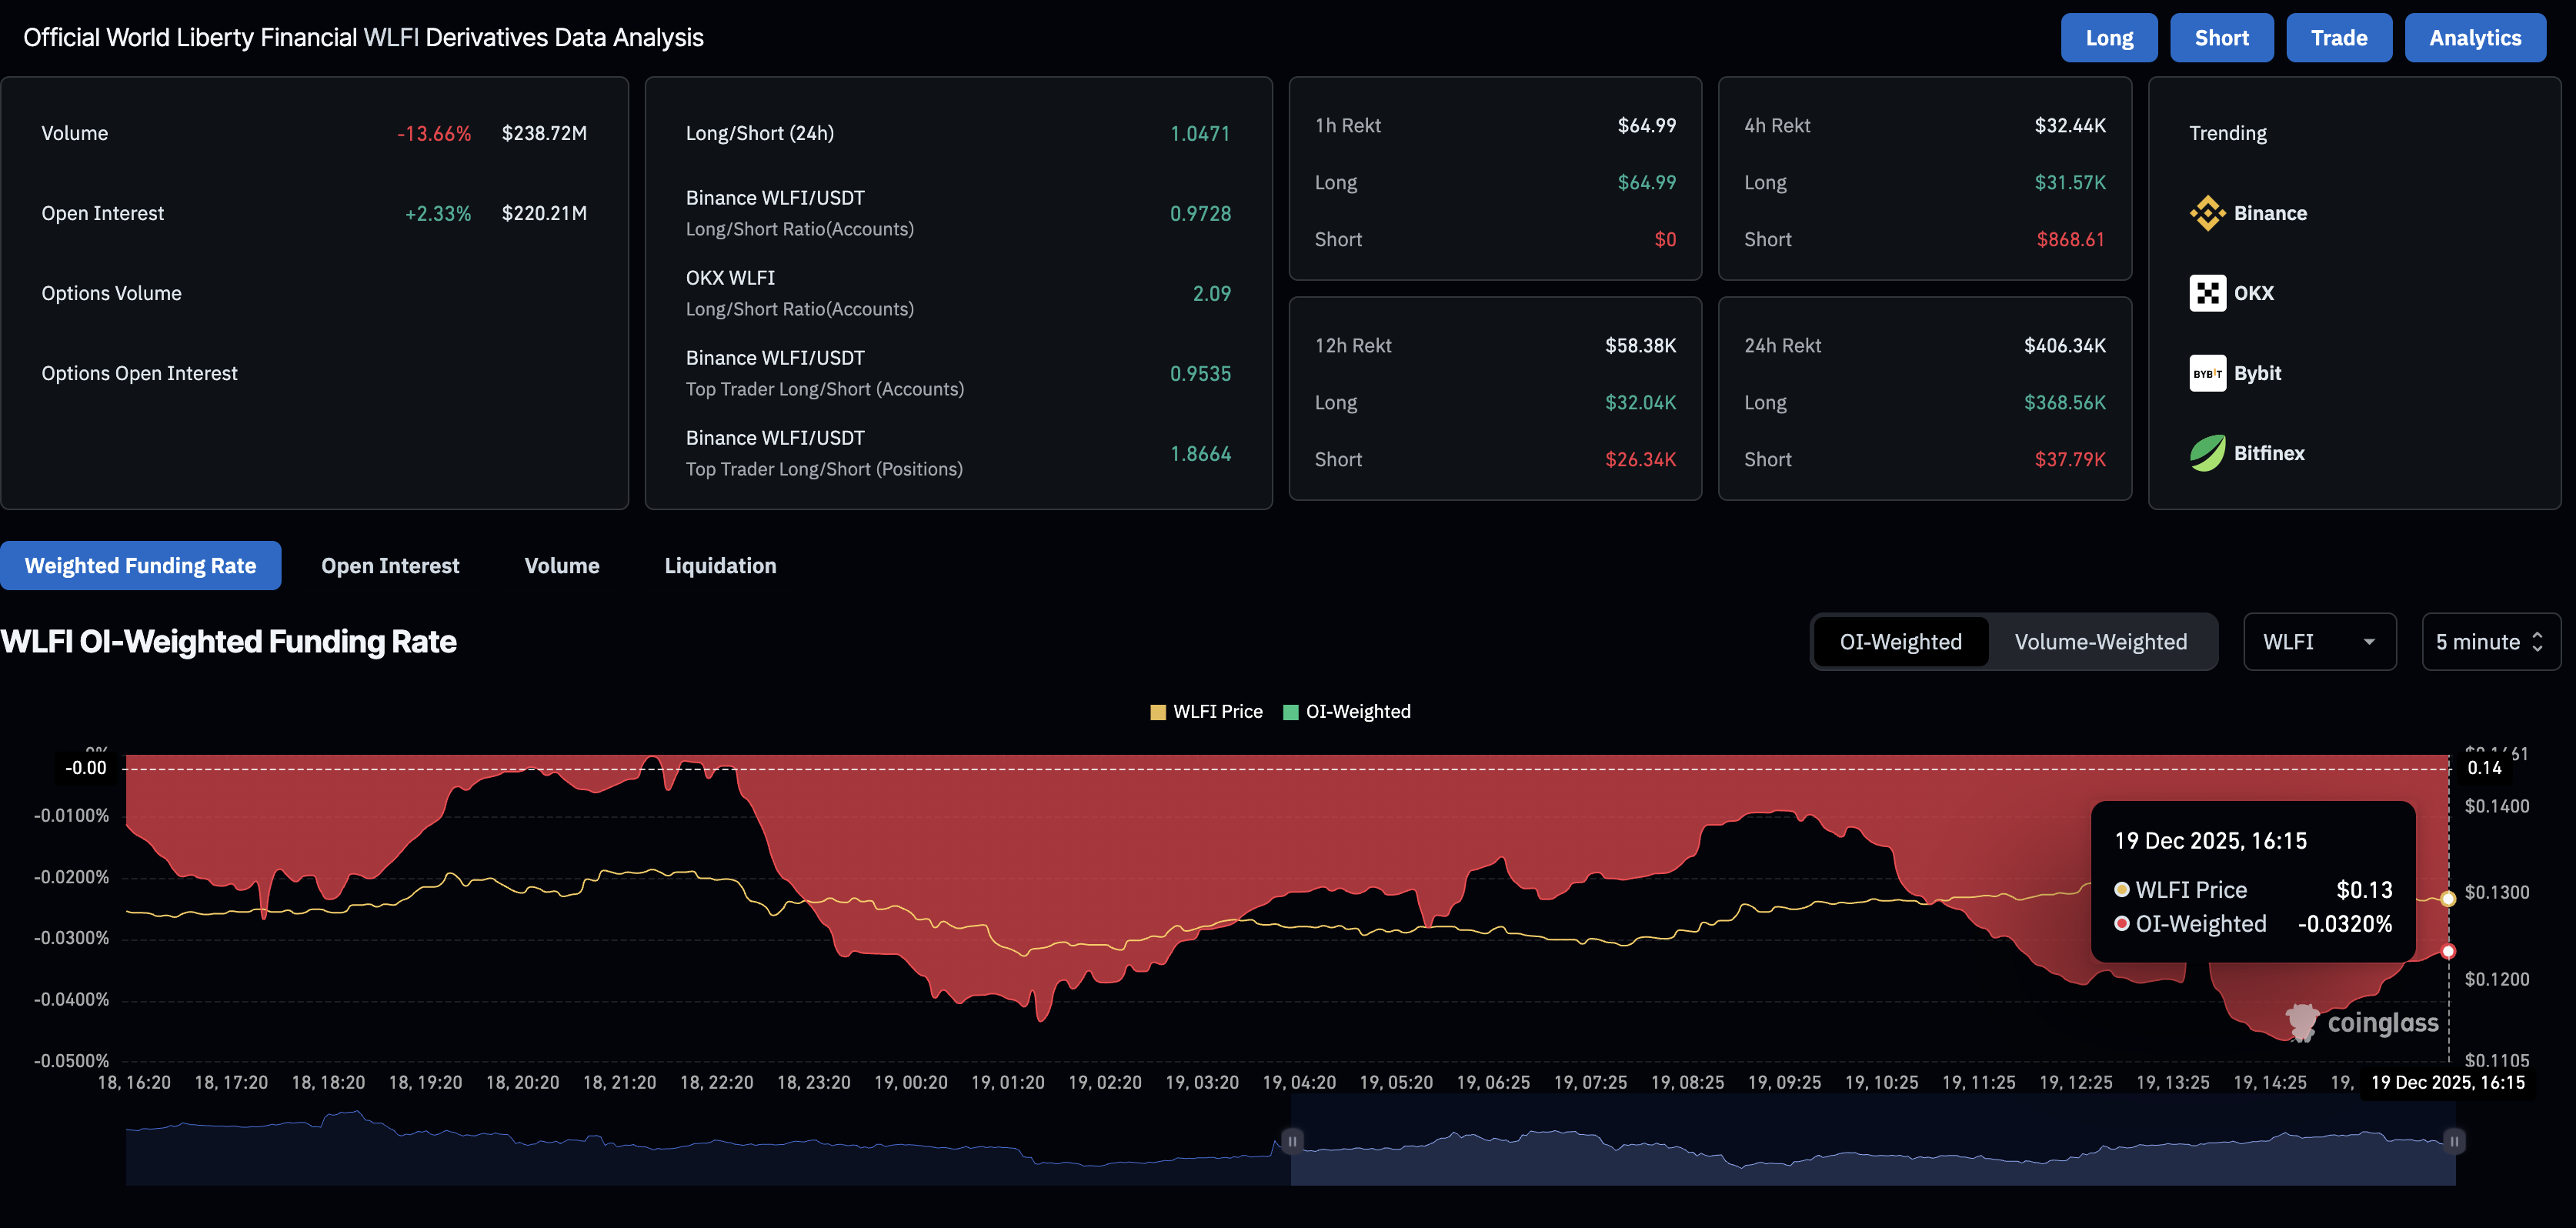
CoinGlass data shows that the WLFI futures Open Interest (OI) stands at $220.21 million, up 2.33% over the last 24 hours, suggesting an increase in both long and short positions. However, the bearish sentiment persists, as the OI-weighted funding rate of -0.0320% indicates that bears are paying a premium to hold short positions.
World Liberty Financial token prepares to lift off
WLFI edges higher by over 3% at press time on Friday, rising after a steady decline over the past week. The rebound sprouts from a support trendline connecting the November 4 and 21 lows, improving the odds of an extended upcycle.
Alongside the recovery, the momentum indicators suggest a sudden drop in selling pressure. The Relative Strength Index (RSI) reverses to 37 from the oversold boundary on the daily chart, while the Moving Average Convergence Divergence (MACD) nudges to the upside toward the signal line.
If WLFI exceeds $0.1337, marked by the October 28 low, it could aim for the 50-day Exponential Moving Average (EMA) at $0.1484.
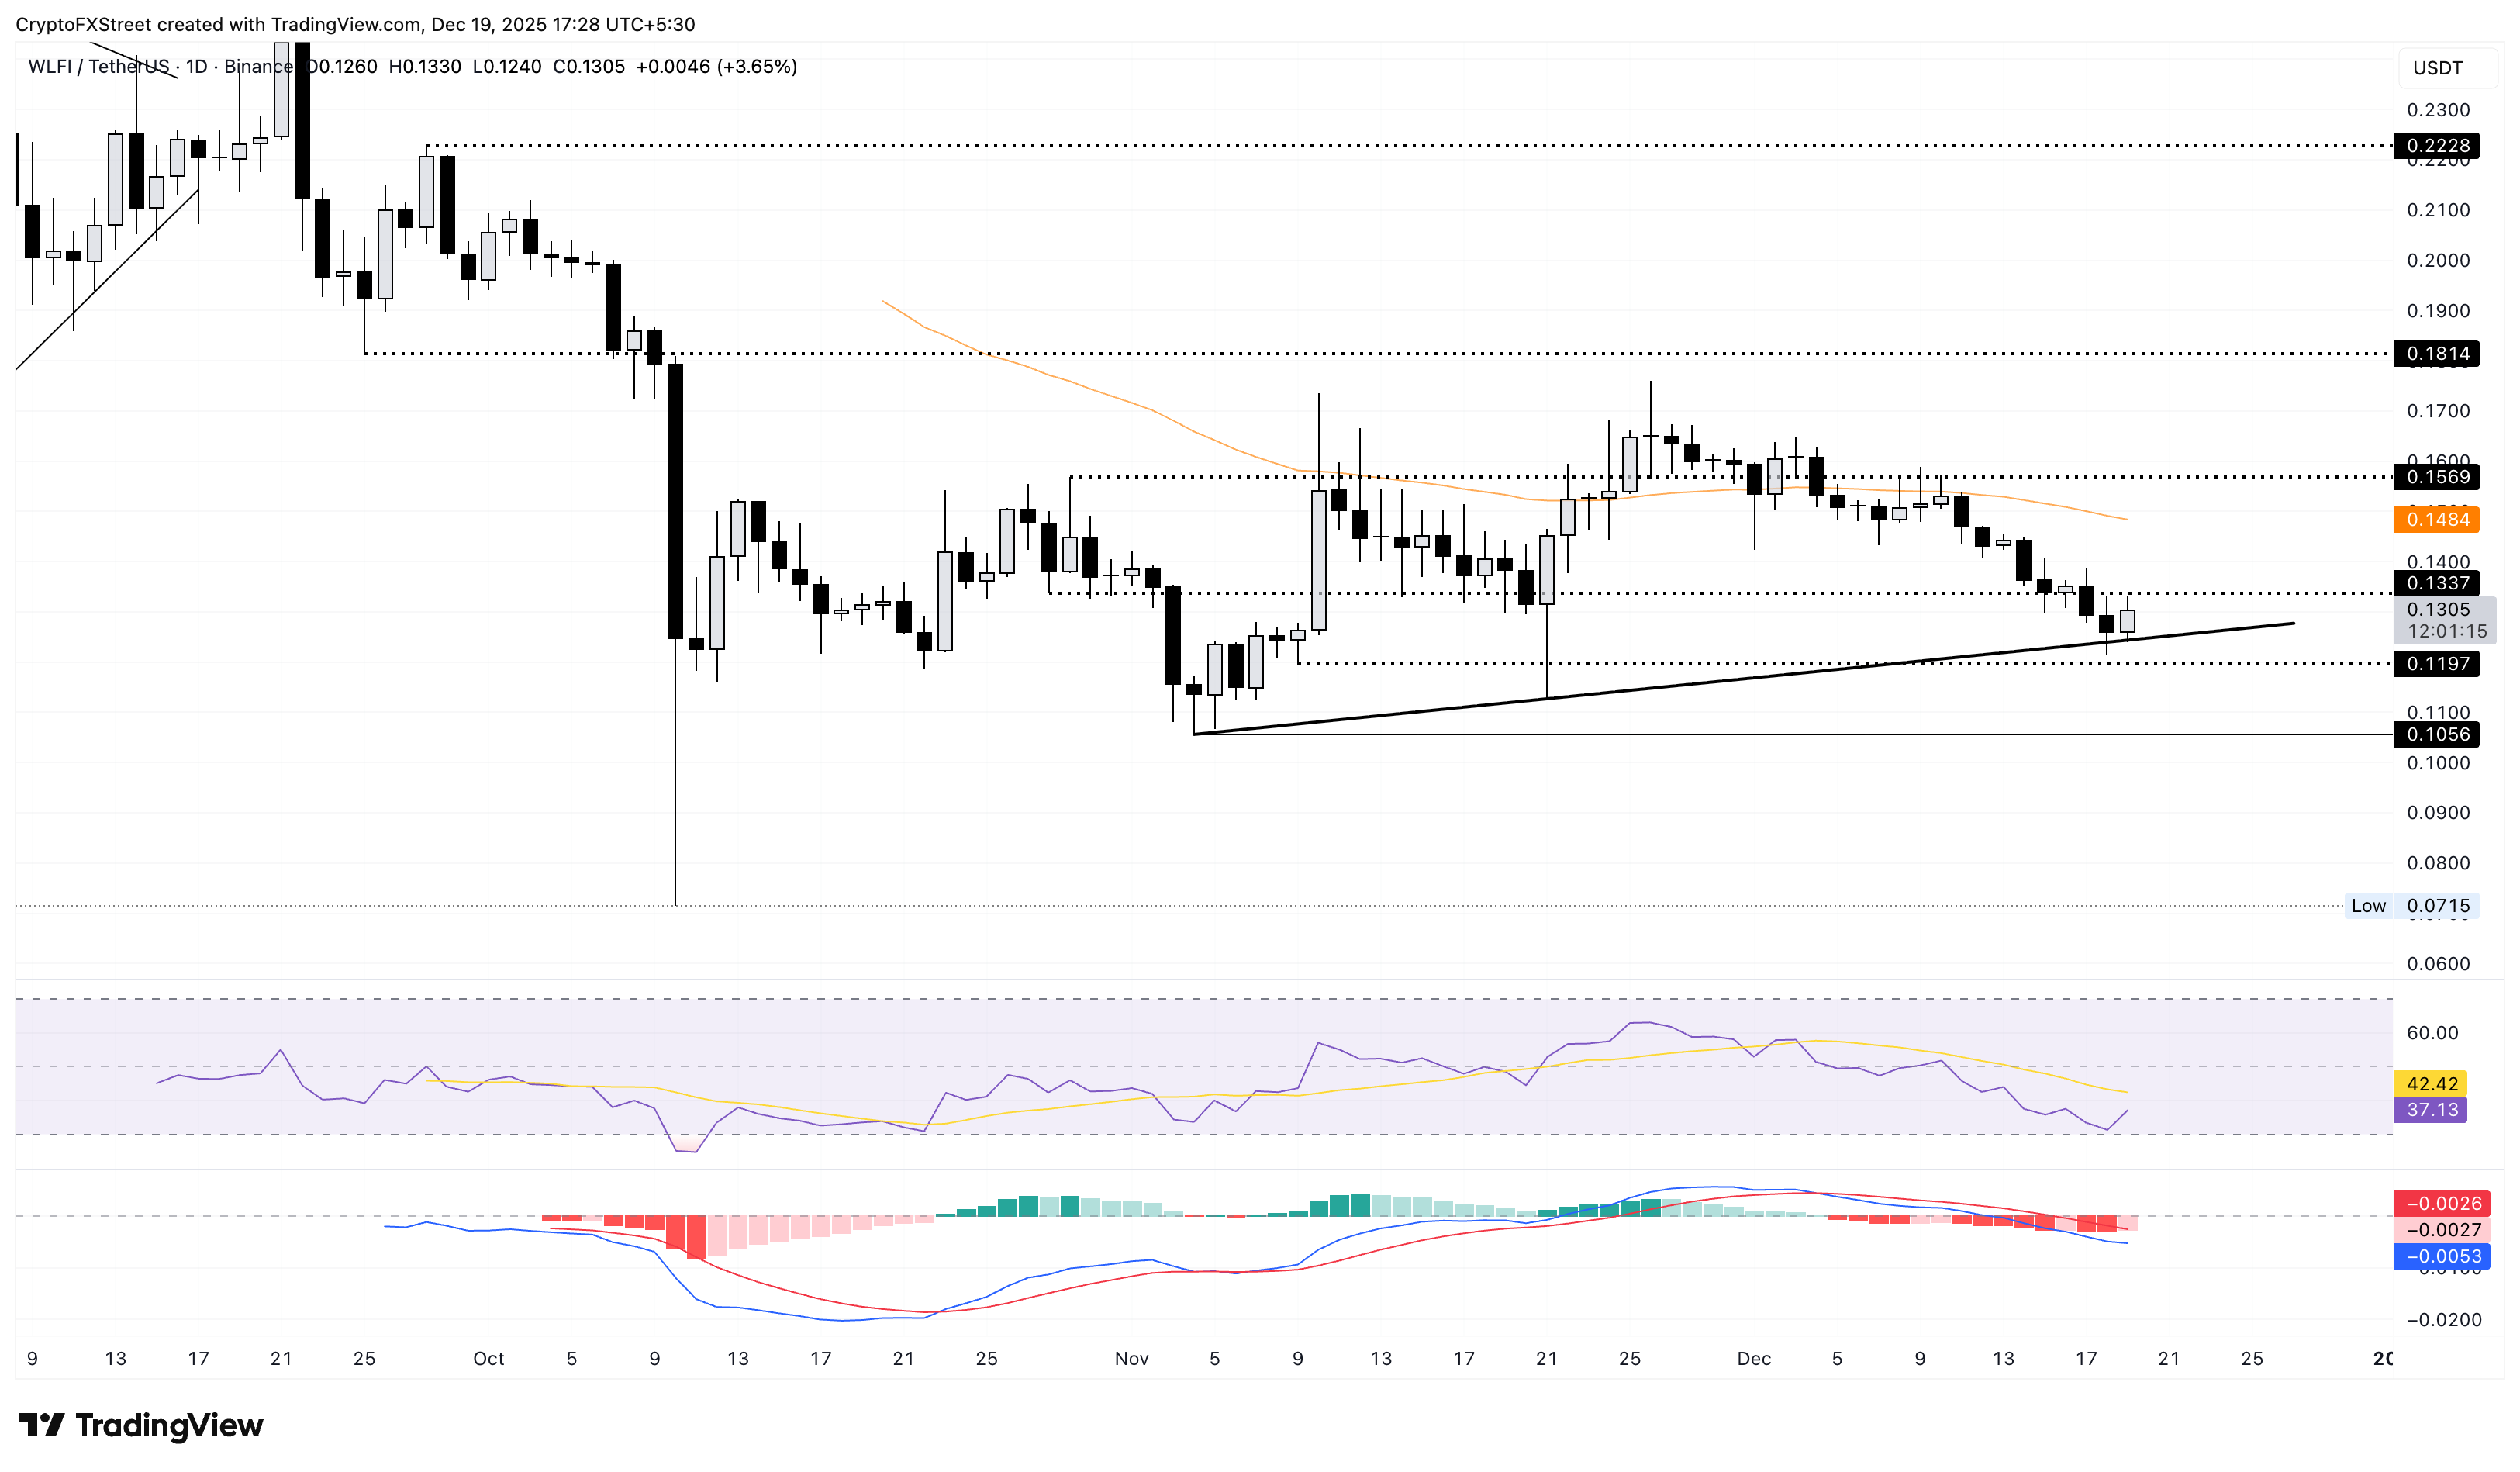
However, if the token slips below the November 9 low at $0.1195, it could target the November 4 low at $0.1056.
Author

Vishal Dixit
FXStreet
Vishal Dixit holds a B.Sc. in Chemistry from Wilson College but found his true calling in the world of crypto.