Top 3 Price Prediction Bitcoin, Ethereum, Ripple: ETH seizes spotlight as BTC and XRP contemplate retracement
- Bitcoin price shows a correction in play after the MRI flashed a red ‘one’ cycle top signal.
- Ethereum shows a strong trend continuation while the rest of the market experiences a minor pullback.
- Ripple faces retracement from Wednesday’s trading session, looks to continue until retesting support at $1.56.

The hype around Coinbase’s IPO was matched by Bitcoin and Ethereum, which surged to new all-time highs. On the other hand, Ripple price faced an abrupt stop as investors began booking profits.
While the pioneer crypto and remittances token struggle to maintain their bullishness, the smart contracts token shows no sign of stopping.
Bitcoin lacks momentum despite breaking out from bullish setup
Bitcoin price action since March 15 has produced three distinctive swing lows known as the inverse head-and-shoulders pattern. This setup contains a central dip referred to as the head, while the other two of comparable depth are known as shoulders.
The swing highs of these peaks have seen a sell-off at the neckline at $60,100, which was breached successfully on April 13, signaling a 16% upswing to $69,860. This target is determined by measuring the head’s depth and adding it to the breakout point.
While the technical formation is bullish, the Momentum reversal indicator’s (MRI) reversal signal in the form of a red ‘one’ candlestick on the 4-hour chart has deterred the advance.
A potential spike in buying pressure could end the sell-off and restart the upward move to the intended target at $69,860.
If the bullish momentum persists beyond this point, investors can expect Bitcoin price to tap the 127.2% Fibonacci extension level at $70,779.
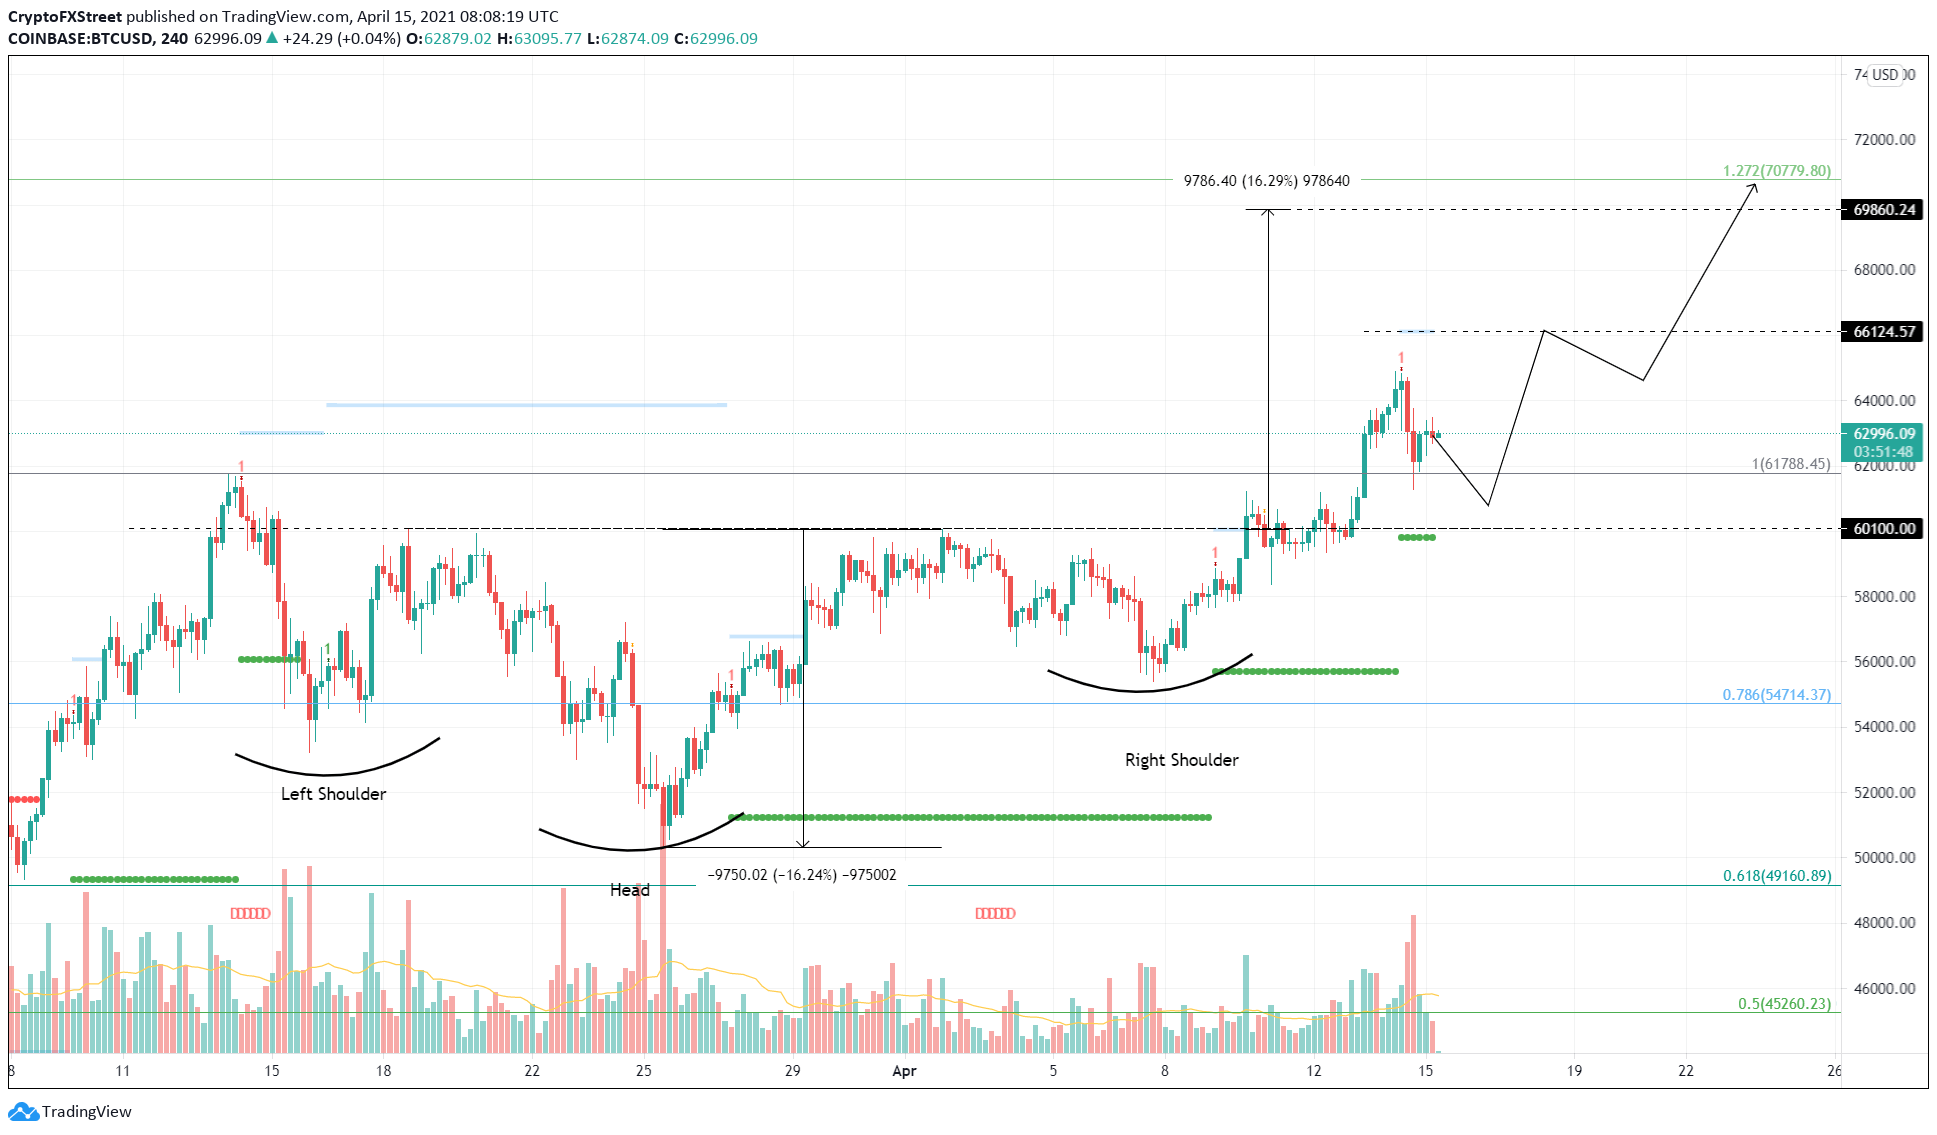
BTC/USD 4-hour chart.
Regardless of the optimism, if the retracement produces a decisive close below the previous all-time high at $61,788, it would significantly discourage buyers from placing bid orders.
However, a breakdown of the neckline at $60,100 would invalidate the bearish thesis and trigger a 5.4% drop to $56,791.
Ethereum price continues its carefree ascent
Ethereum price has surged nearly 25% since it broke out of a symmetrical triangle on April 1. This technical formation contains ETH getting squeezed between two converging trend lines, resulting in lower highs and higher lows.
The setup’s target is determined by measuring the distance between the pivot high and low and adding it to the breakout point at $1,863. Unlike Bitcoin, ETH bulls have disregarded the recently spawned red ‘one’ reversal signal by the MRI.
Additionally, the MRI has also produced an extension C, which paints an overextension of the bull rally on the 6-hour chart.
While these signs indicate that a retracement is nigh, the buyers might push the smart contracts token to a new all-time high at $2,546 before allowing a full-blown retracement.
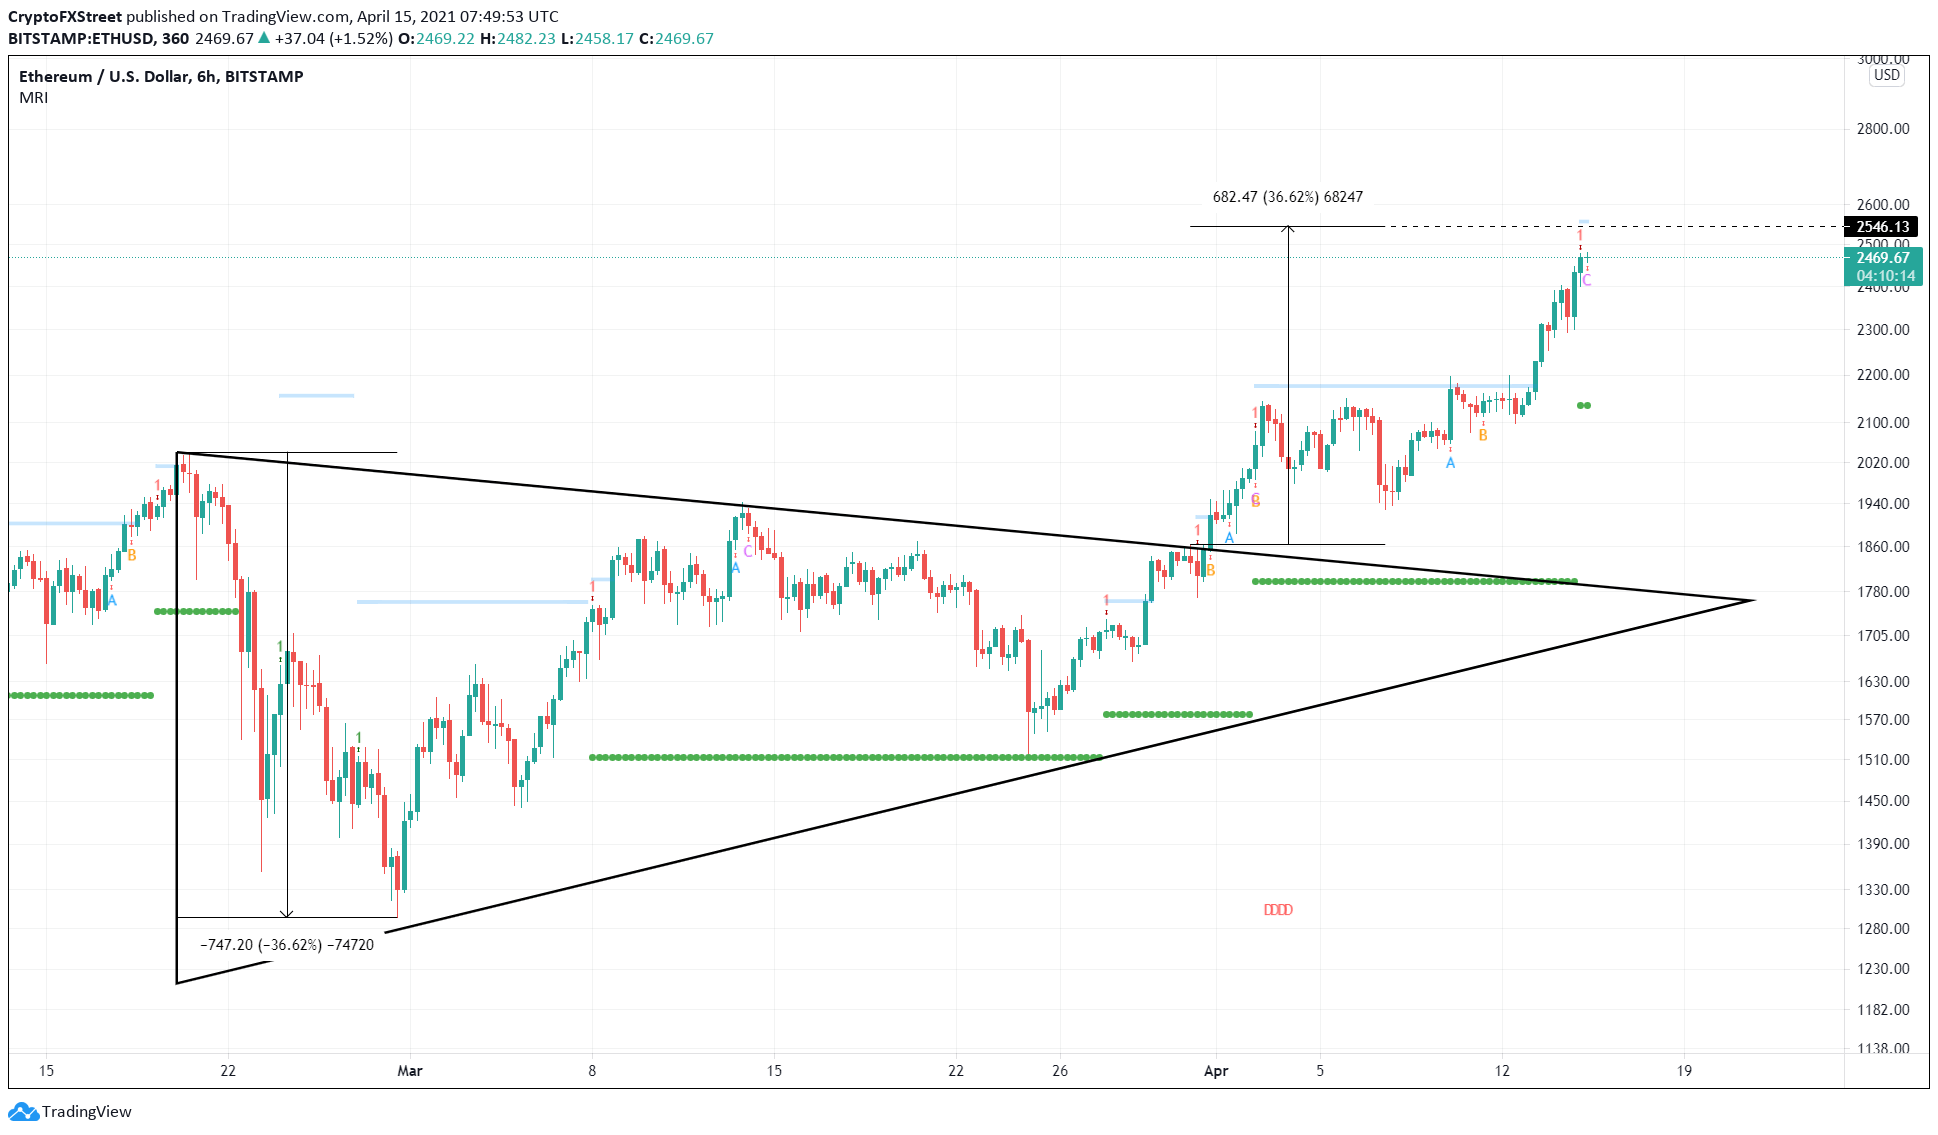
ETH/USD 6-hour chart
If investors fail to prop up Ethereum price, then it is evident that a retracement will ensue. In such a case, an 11% sell-off to $2,177, coinciding with the MRI’s breakout line, is likely.
Ripple buyers book profits, sending XRP price into tailspin
XRP price has moved from one bullish technical formation to another, appreciating from $0.63 to almost $2. Such a hyperbolic move, although impressive, met a blockade in Wednesday’s trading session that resulted in a sudden 20% wick to the crucial demand barrier at $1.56.
XRP price seems to have recovered almost all of the losses, but the pullback scare has not vanished yet. Additionally, the MRI has also flashed a red ‘A’ candlestick, suggesting that Ripple price has overextended its rally.
If the sellers continue to keep booking profits, XRP price could initially drop 9% to the immediate support level at $1.56. If this barrier is breached, the remittance token could sell off nearly 15% to MRI’s State Trend Support and hit $1.33.
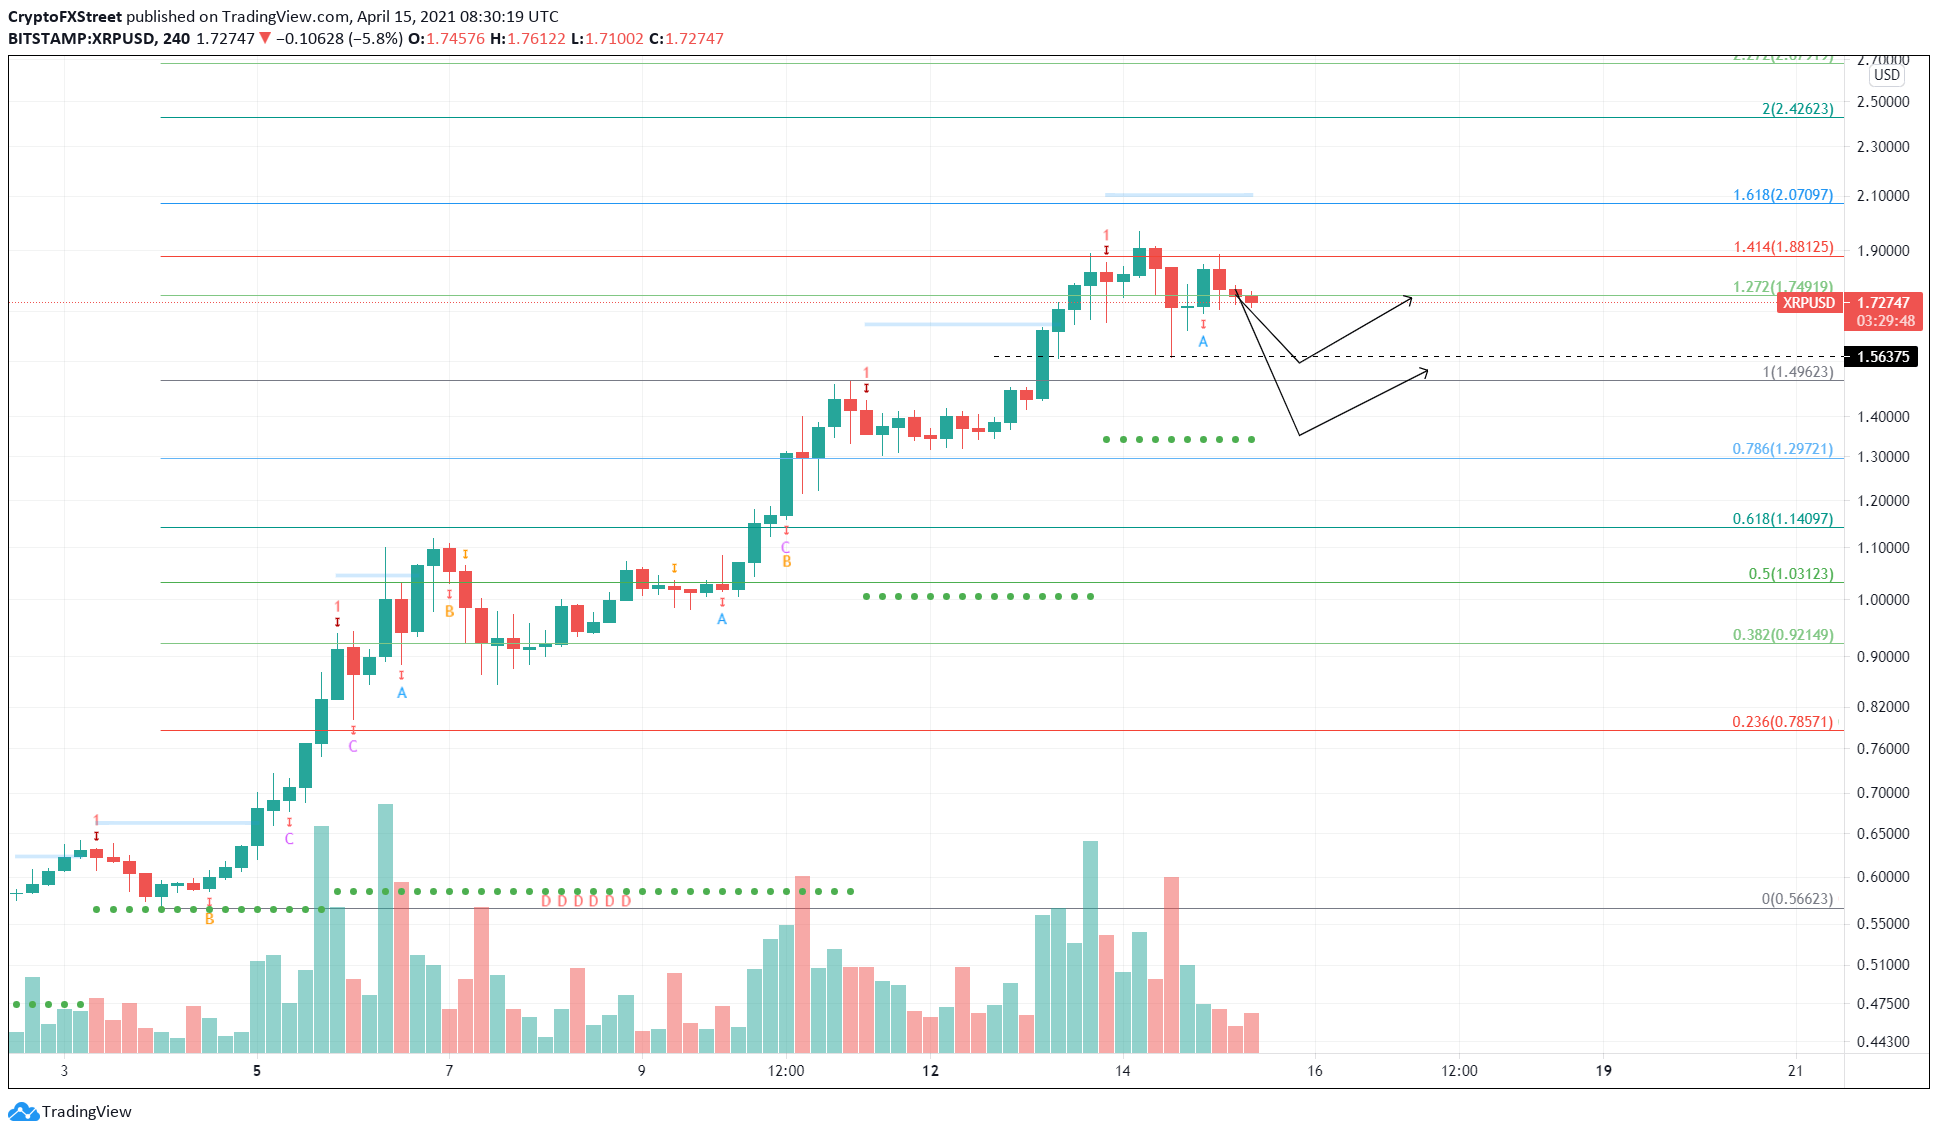
XRP/USD 4-hour chart
On the contrary, if the buyers make a comeback, XRP price could bounce off the MRI’s breakout line at $1.66 and head to retest its recent highs at $1.97 and perhaps even $2.07, coinciding with the 161.8% Fibonacci extension level.
Author

Akash Girimath
FXStreet
Akash Girimath is a Mechanical Engineer interested in the chaos of the financial markets. Trying to make sense of this convoluted yet fascinating space, he switched his engineering job to become a crypto reporter and analyst.


