![]() Lorenzo Stroe
Lorenzo Stroe
Independent Analyst
- Bitcoin price tries to rebound from a critical support level on the daily chart.
- Ethereum follows BTC closely but has more strength in the short-term and remains trading around $2,000.
- Ripple price outperformed every other big crypto after a massive 100% rally to new three-year high at $1.19.
The cryptocurrency market has recovered slightly from a $150 billion dip, gaining back around $80 billion, but the top three cryptocurrencies are not out of danger just yet. XRP took the lead in the past week and maintains a significant advantage over the rest. Ripple gained $22 billion in market capitalization in less than two days.
Bitcoin price defends critical support level
On the daily chart, Bitcoin has managed to hold above the 50 EMA support level which has been a strong support point since the beginning of October 2020. However, this moving average is currently located at $53,300, which means BTC can still see further downside action.
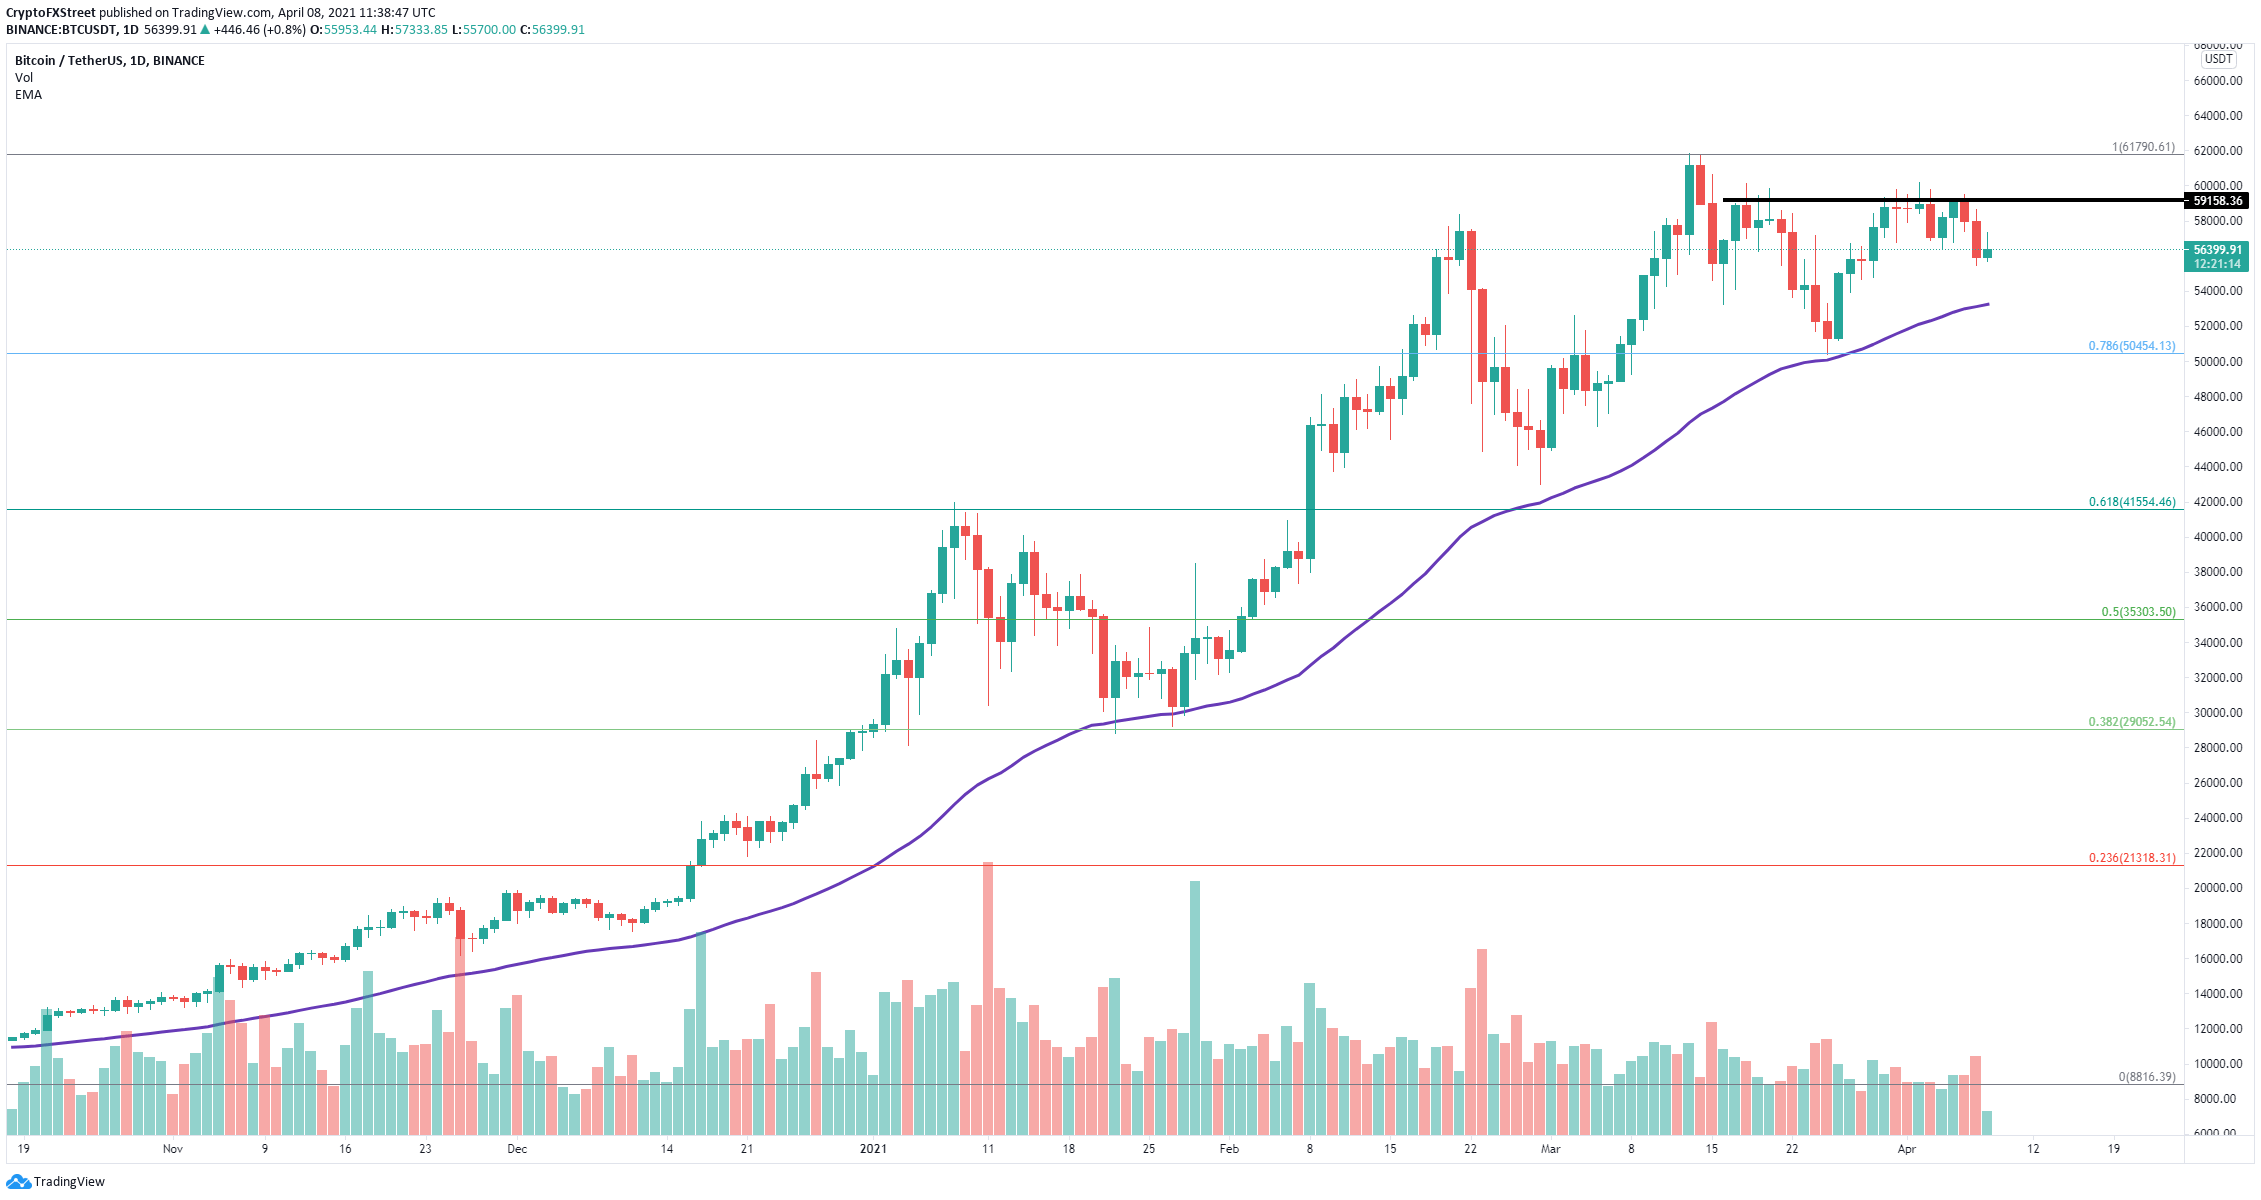
BTC/USD daily chart
The most significant resistance level on the way up is located at $59,000. A breakout above this key point should drive the Bitcoin price toward the previous all-time high of $61,844. However, it seems that BTC whales have been selling for the past month.
%20[13.39.35,%2008%20Apr,%202021]-637534813170623593.png)
BTC Holders Distribution chart
The number of whales with 10,000 to 100,000 BTC decreased by 10 in the past month. Similarly, the number of large holders with 1,000 to 10,000 BTC also dropped significantly from 2,274 to 2,158 since March.
Losing the 50 EMA support level will quickly drive the Bitcoin price down to $50,450 at the 78.6% Fibonacci retracement level, which coincides with the low of March 25.
Ethereum’s uptrend is at no risk according to technicals
On the daily chart, Ethereum established a robust support trend line since the beginning of January. This boundary is currently located at $1,700, which means that anything above this level poses no threat to the bulls.
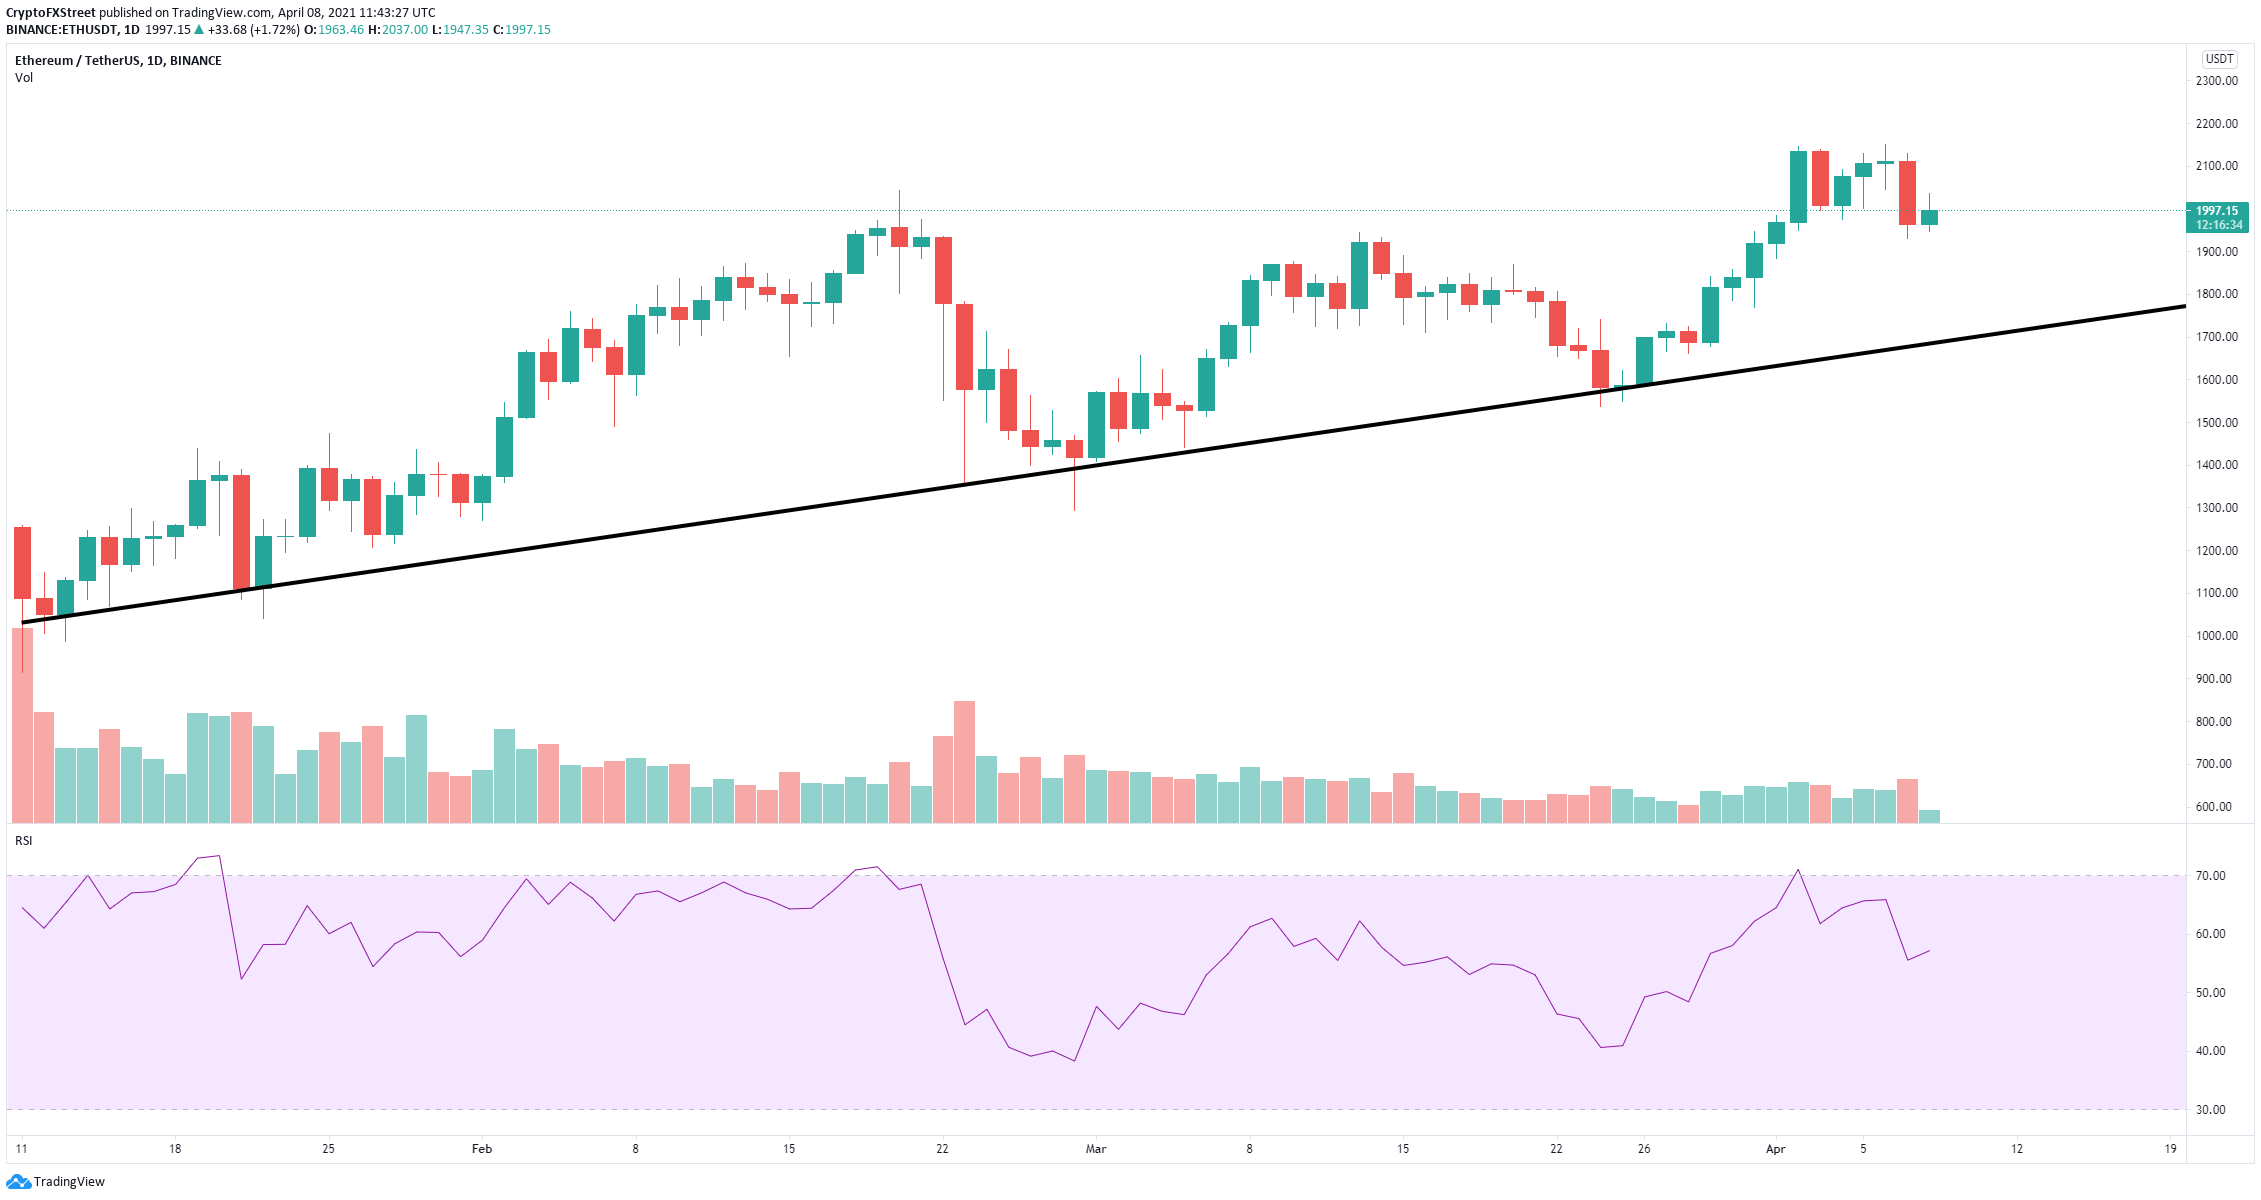
ETH/USD daily chart
Additionally, the RSI, which was overextended, has cooled off notably to about 56 points, which means ETH has a lot of room for a new leg up above the all-time high of $2,151.
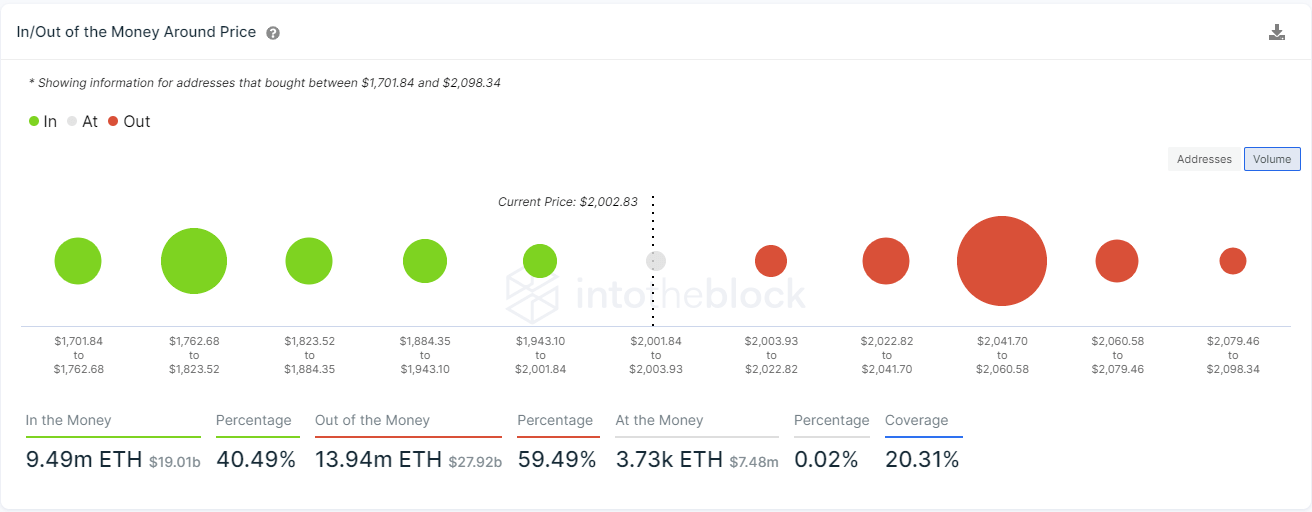
ETH IOMAP chart
The most significant resistance area is located between $2,041 and $2,060 where 152,000 addresses purchased over 10.8 million ETH. This is shown by the In/Out of the Money Around Price (IOMAP) chart. A breakout above this point should push Ethereum into new all-time highs.
However, at the same time, there is weak support below the current price until the robust trend line at $1,700.
Ripple price faces massive selling pressure after 100% rally
On the daily chart, the TD Sequential indicator has just presented a sell signal and a green ‘8’ candlestick on the 3-day chart, which is often followed by a sell signal as well. This comes as no surprise due to the recent massive 100% rally that XRP experienced.
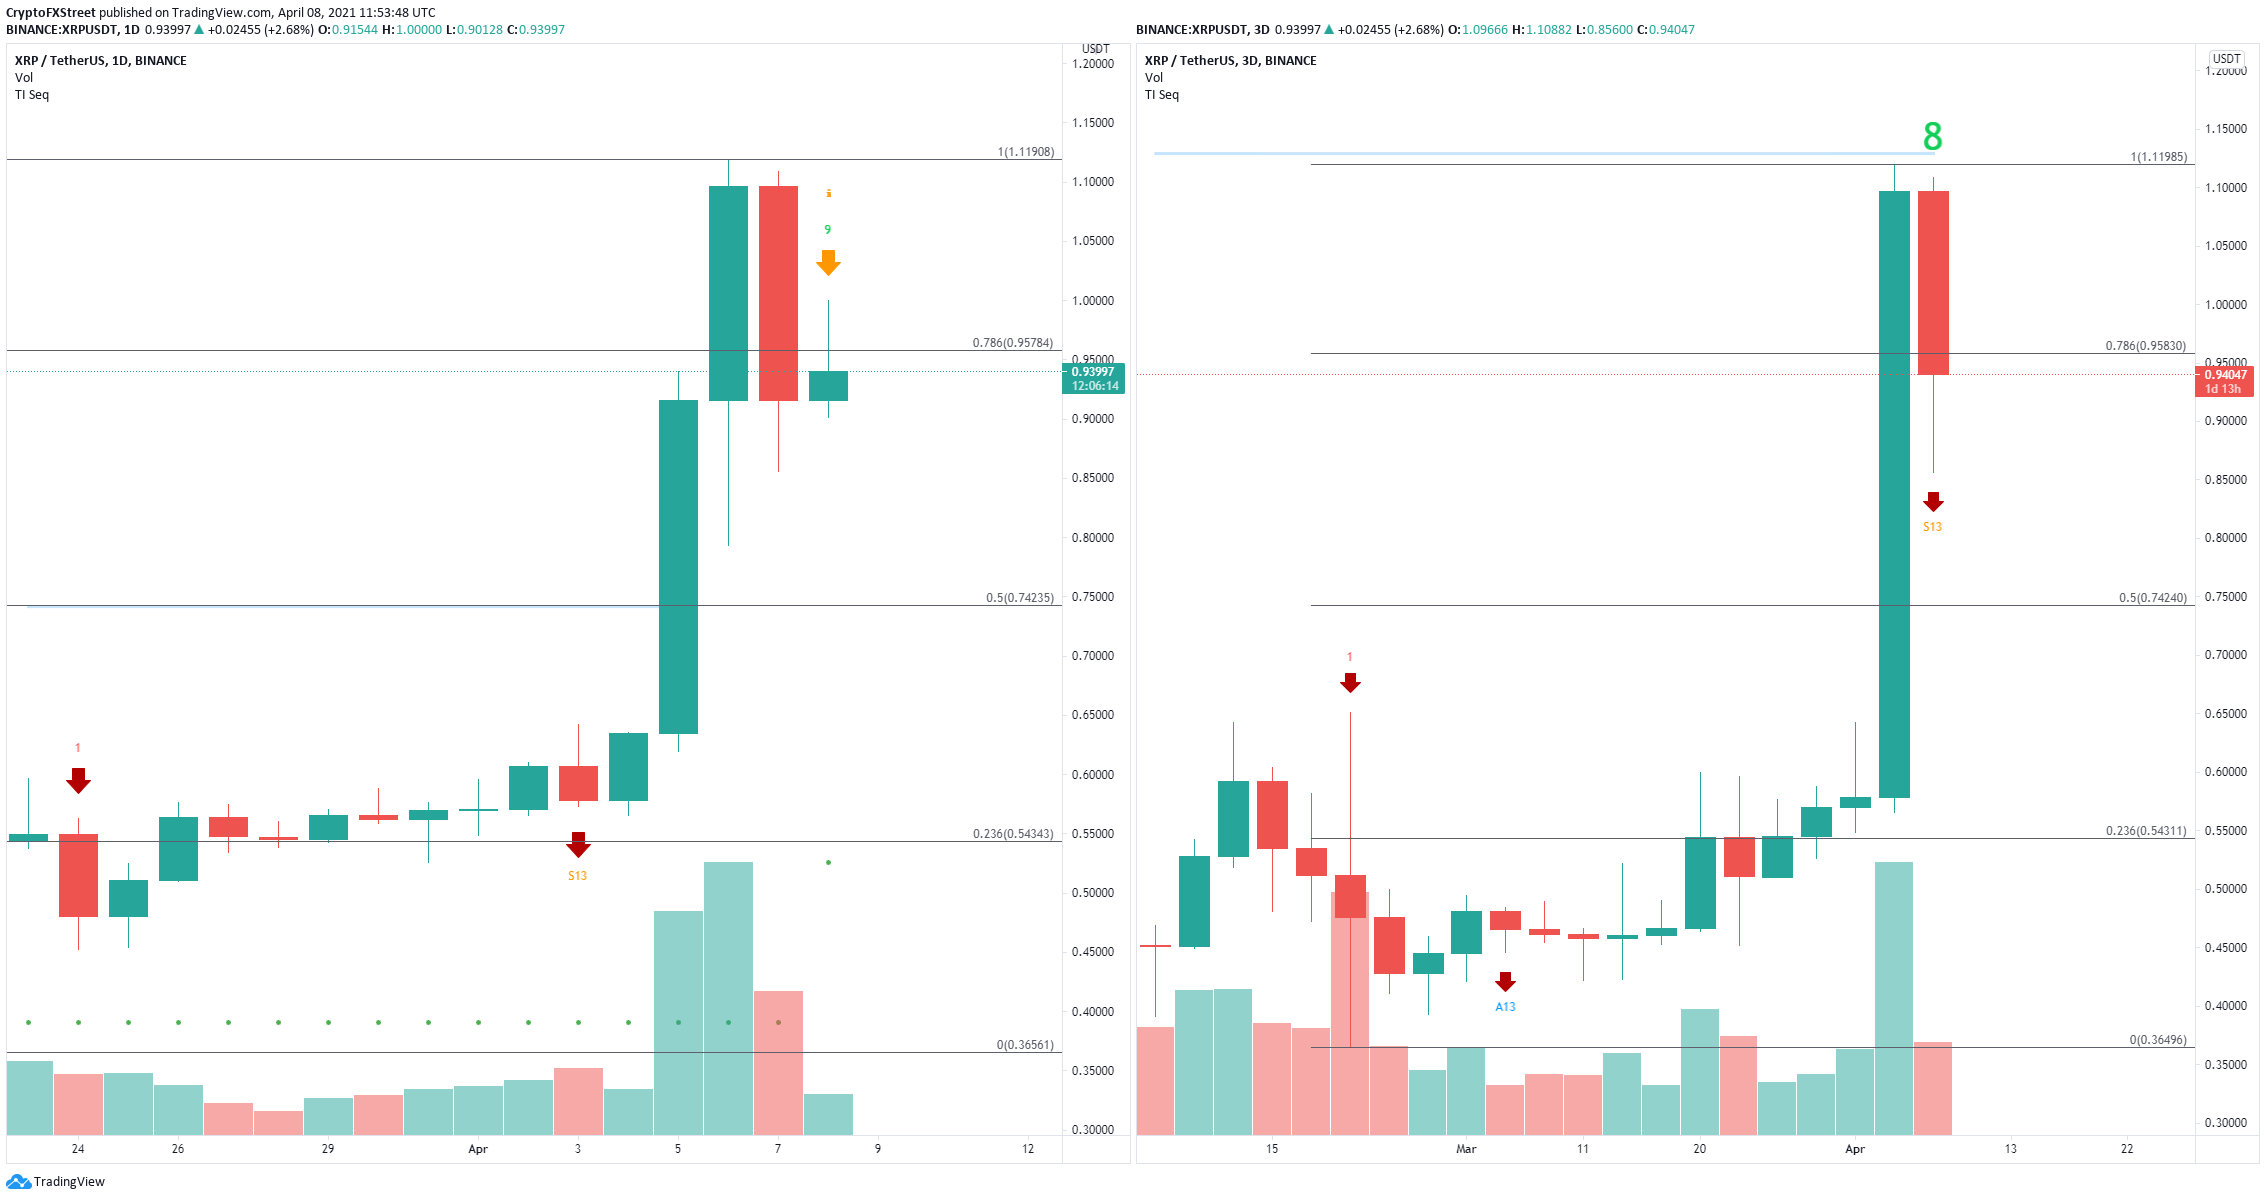
XRP Sell Signals
XRP has lost the 78.6% Fibonacci Retracement level at $0.958, and it is at risk of falling toward the 50% level at $0.742 if both sell signals are confirmed.
Note: All information on this page is subject to change. The use of this website constitutes acceptance of our user agreement. Please read our privacy policy and legal disclaimer. Opinions expressed at FXstreet.com are those of the individual authors and do not necessarily represent the opinion of FXstreet.com or its management. Risk Disclosure: Trading foreign exchange on margin carries a high level of risk, and may not be suitable for all investors. The high degree of leverage can work against you as well as for you. Before deciding to invest in foreign exchange you should carefully consider your investment objectives, level of experience, and risk appetite. The possibility exists that you could sustain a loss of some or all of your initial investment and therefore you should not invest money that you cannot afford to lose. You should be aware of all the risks associated with foreign exchange trading, and seek advice from an independent financial advisor if you have any doubts.
Recommended Content
Editors’ Picks
Chainlink social dominance hits six-month peak as LINK extends gains
-637336005550289133_XtraSmall.jpg)
Chainlink social dominance surged to a six-month peak on Friday as LINK holders increased their activity. LINK traders started taking profits, on-chain data trackers show. LINK price added 6% on Friday, extending its gains from mid-week.
Binance helps Taiwan crack a virtual asset money laundering case, BNB sustains above $570

Binance’s Financial Crimes Compliance (FCC) department joined forces with Taiwan’s Ministry of Justice and helped resolve a case of money laundering worth NT$200 million, or $6.2 million.
Bitcoin Weekly Forecast: Is BTC out of the woods? Premium

Bitcoin price shows signs of continuing its uptrend, providing a buying opportunity between $64,580 to $63,095. On-chain metrics forecast a bullish outlook for BTC ahead. If BTC clears $70,000, the chances of resuming the uptrend would skyrocket.
XRP trades steady at $0.50 as Ripple shares plan to expand services in Africa

Ripple hovers close to $0.51 on Friday, above the psychologically important $0.50 level, as traders await the court ruling of the lawsuit against the US Securities and Exchange Commission and amid new commitments from the firm to expand its services in Africa.
Bitcoin: Is BTC out of the woods? Premium
Bitcoin (BTC) price action in the past two days has confirmed the resumption of the bull run. However, BTC needs to clear a few key hurdles before investors can go all-in.