Top 3 Price Prediction Bitcoin, Ethereum, Ripple: Cryptos to confirm bullish retest for the rally to continue
- Bitcoin price retests the 50-day SMA at $40,560, confirming the persistence of bullish momentum.
- Ethereum price faces selling pressure after a retest of the $2,927 to $3,413 supply zone.
- Ripple price ignores the noise and continues to climb higher with $1 in its sights.

Bitcoin price is consolidating whilst threatening a move to the downside, causing all altcoins to pause in their rallies. In a way, BTC is controlling the crypto market’s moves, but a second look at the big crypto suggests that a minor uptrend is actually likely.
Also read: Gold Price Forecast: XAUUSD could soon recover its shine
Bitcoin price at inflection point
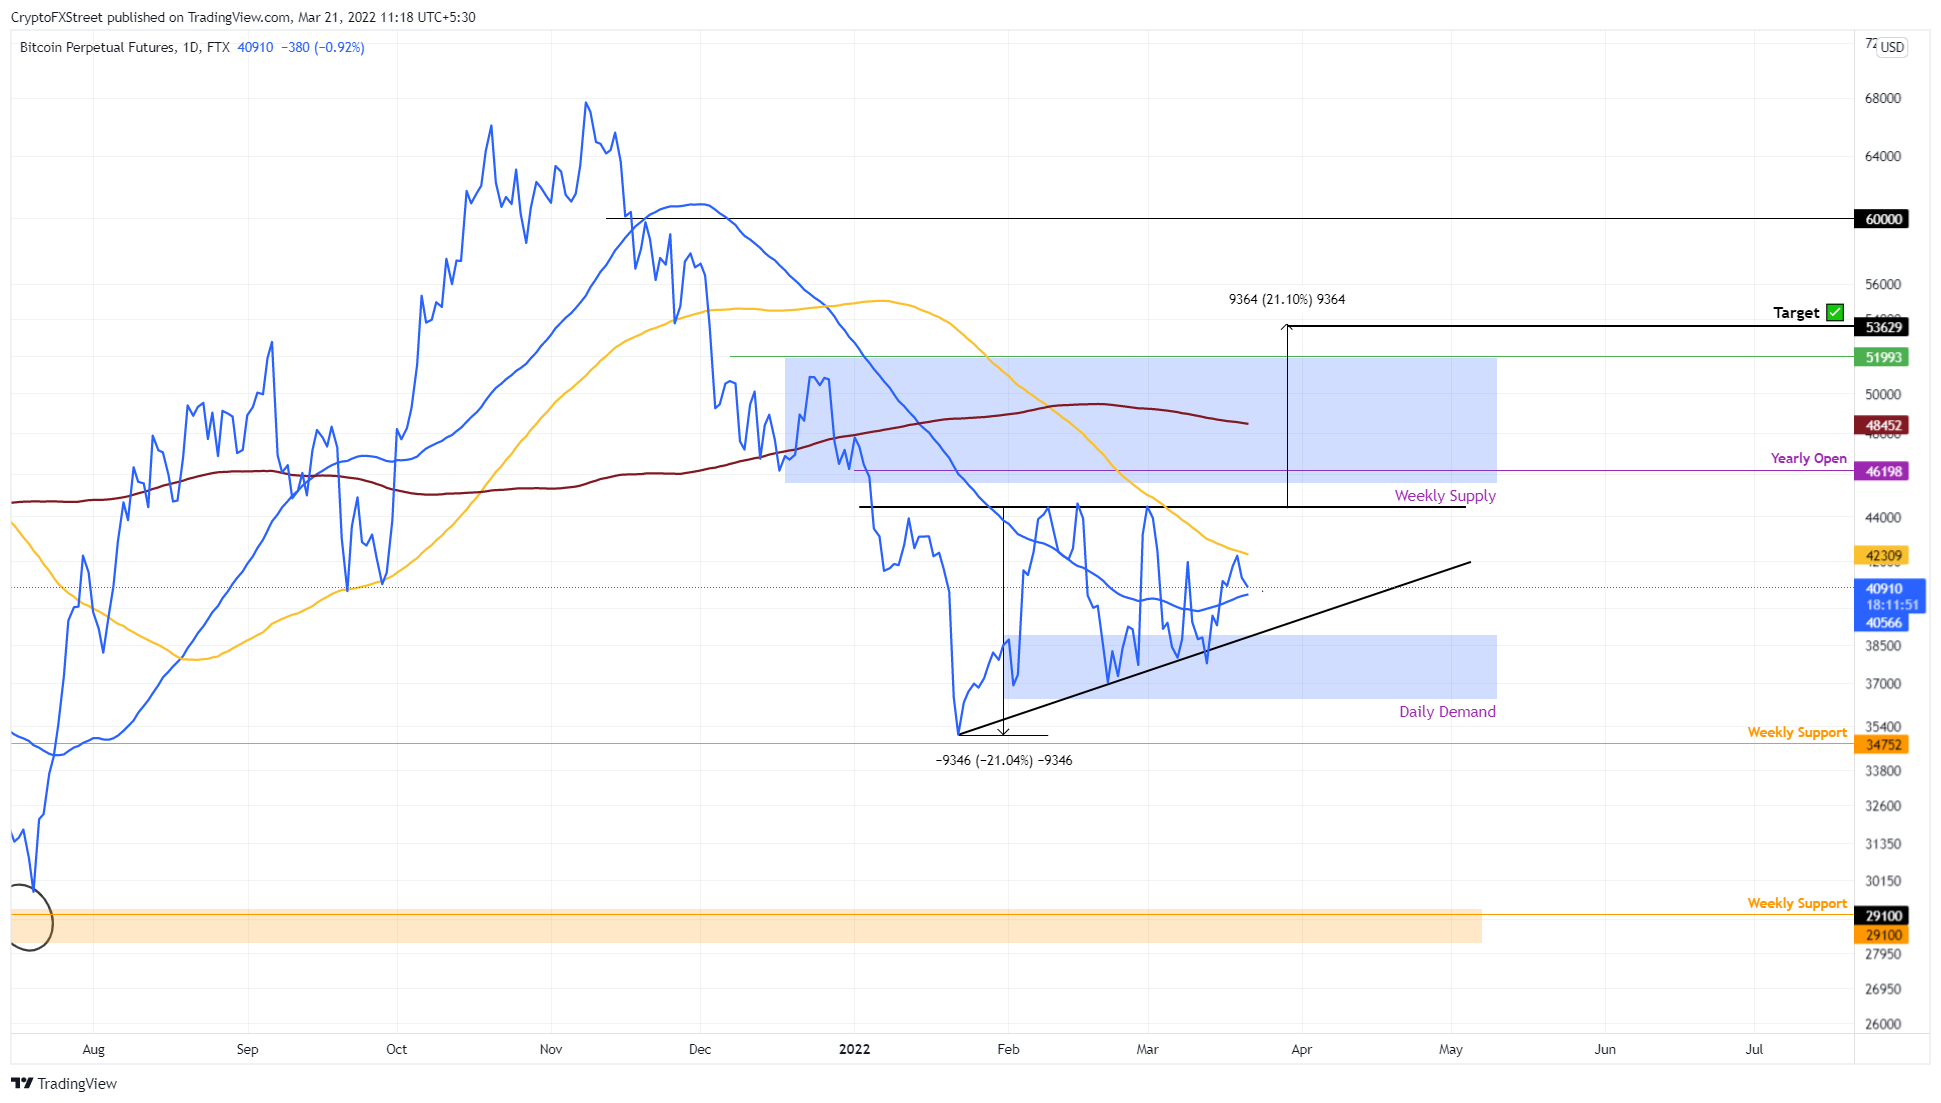
Bitcoin price rallied 12% over the past week, pushing through the 50-day Simple Moving Average (SMA). This move comes as BTC bounced off the hypotenuse of an ascending triangle pattern.
This technical formation forecasts a 21% ascent to $52,000, obtained by measuring the distance between the first swing high and low and adding it to the breakout point at $44,381. While the recent uptick is bullish, BTC bulls need to hold above the 50-day SMA to confirm a move higher.
Failing to do so might result in a steep correction to the daily demand zone, extending from $36,398 to $38,895.
BTC/USD 1-day chart
While the outlook for Bitcoin price looks bullish, a failure to hold above the $34,752 support level will invalidate the ascending triangle pattern and forecast a crash to $29,000 and lower.
Ethereum price waits for cues
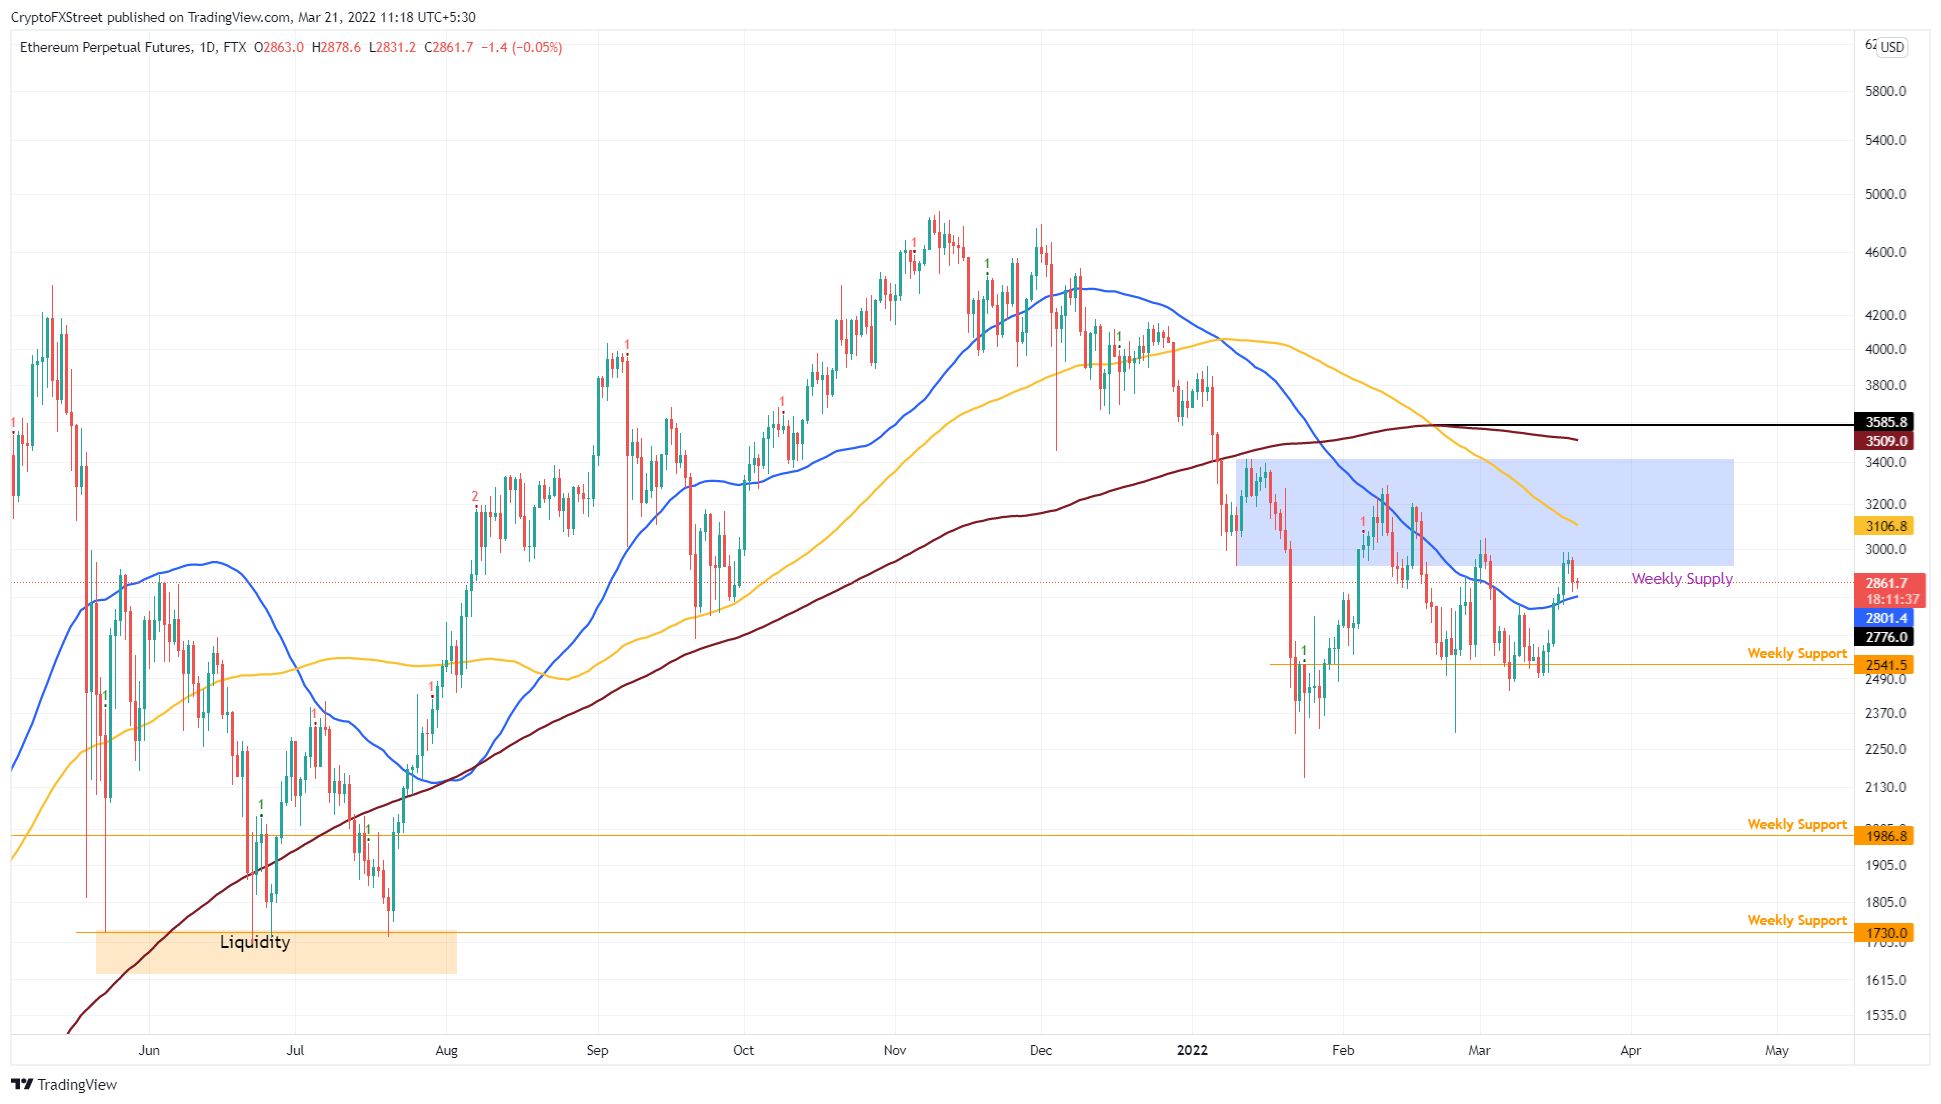
Ethereum price is highly correlated with BTC and has seen a dearth of volatility for quite some time now. Regardless, ETH has managed to gain over 19% in the last week and shows signs of heading higher.
ETH has also pushed above the 50-day SMA at $2,801 after four failed attempts in 2021. Therefore, it is crucial for the uptrend to hold the said support level. Assuming the bulls maintain the momentum, the Ethereum price is likely to shatter the 100-day SMA at $3,106 and make a run at the 200-day SMA at $3,509.
ETH/USD 1-day chart
On the other hand, if Ethereum price fails to stay above the 50-day SMA at $2,801, it will reveal a weakness among buyers and trigger a correction lower to the weekly support level at $2,541. A daily candlestick close below this barrier will invalidate the bullish thesis for ETH.
Ripple price continues to soar
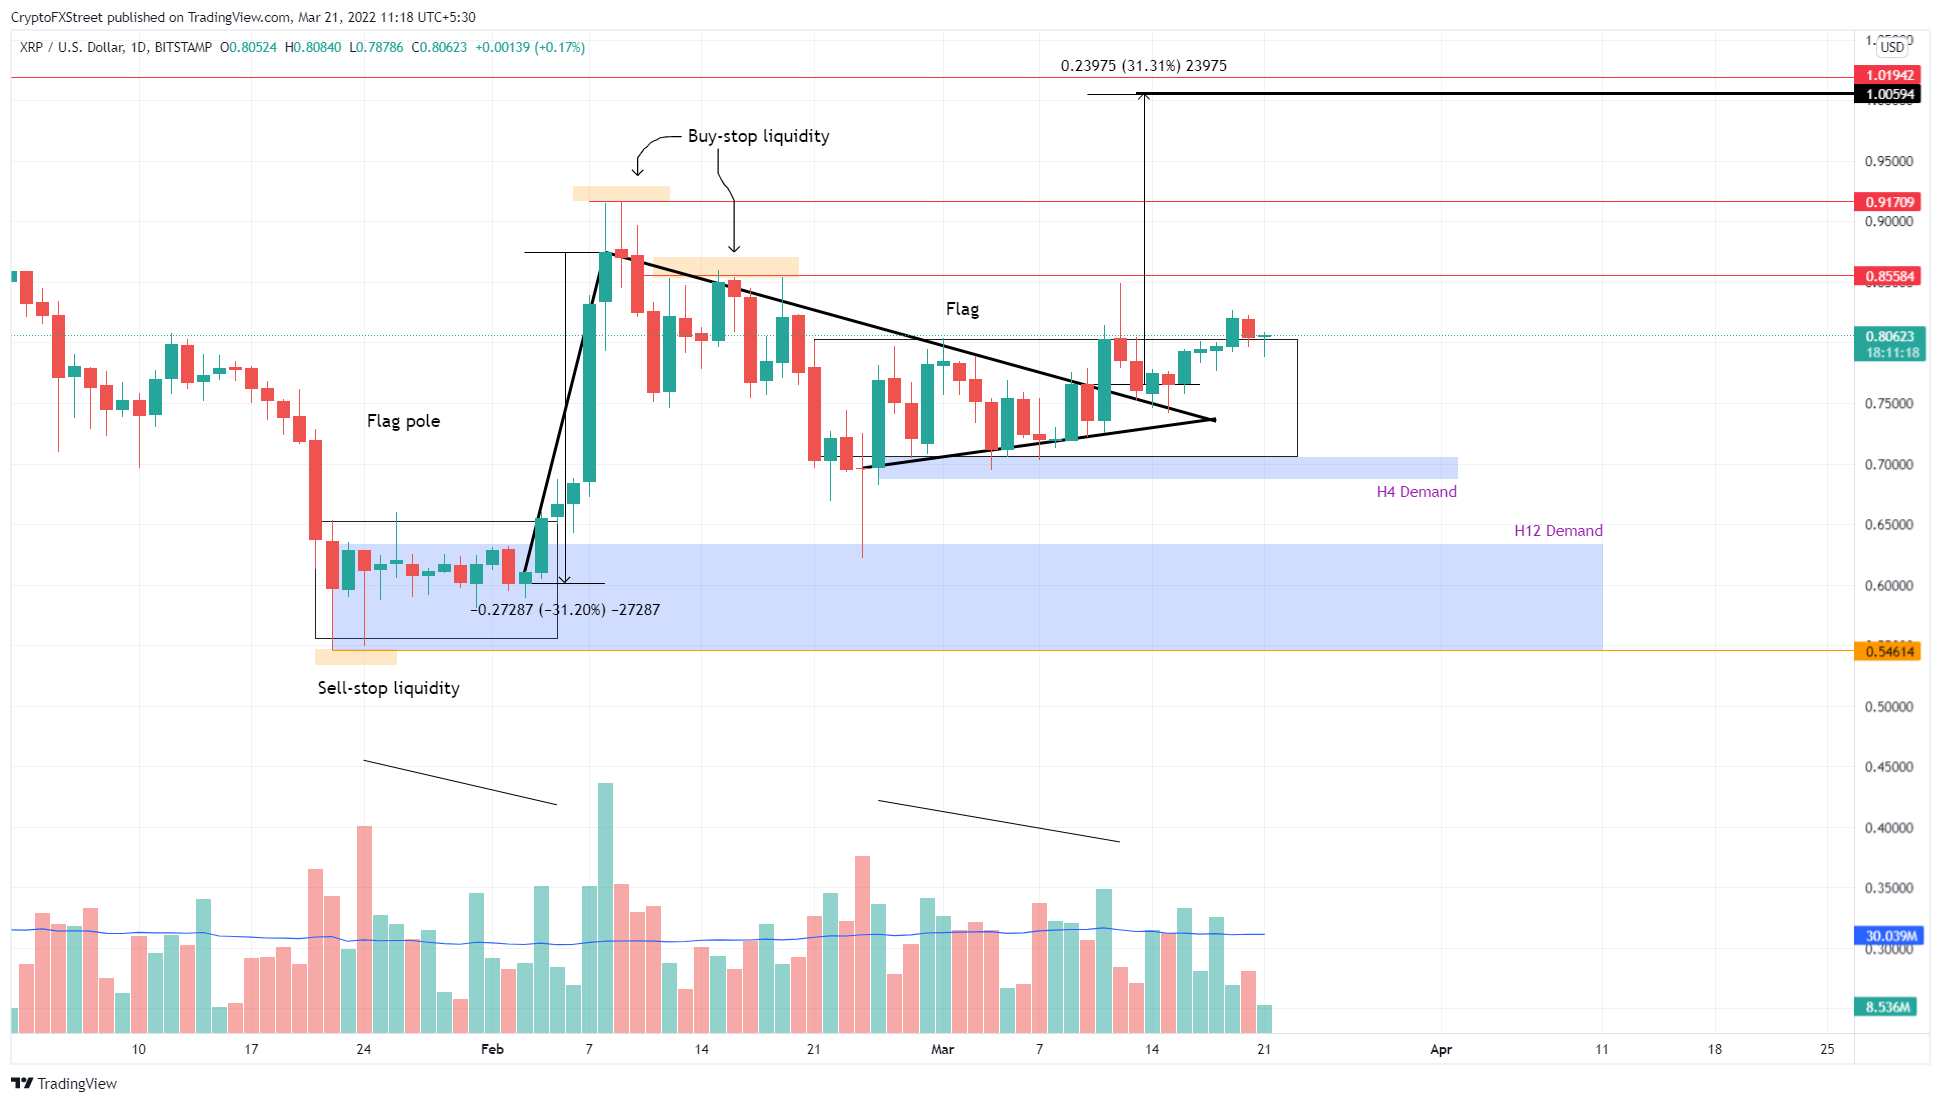
Ripple price breached out of a continuation pattern on March 10 that forecasted a 31% gain. Since the breakout, XRP price has reached the quarter-way point and is currently trading at $0.808.
Going forward, market participants can expect Ripple price to face the $0.856 and $0.917 resistance barriers. A flip of these hurdles will open the path for the remittance token to tag the $1 psychological level.
XRP/USD 1-day chart
The upside for XRP price is a no-brainer, especially after the recent breakout. However, things could quickly turn sour if the Ripple price produces a decisive close below the $0.686 to $0.705 demand zone.
This development would create a lower low and invalidate the bullish thesis. Such a situation could see bears knock XRP price to $0.633, where buyers could regroup for a new leg-up.
Author

Akash Girimath
FXStreet
Akash Girimath is a Mechanical Engineer interested in the chaos of the financial markets. Trying to make sense of this convoluted yet fascinating space, he switched his engineering job to become a crypto reporter and analyst.


