Can the rise of the market continue next week?

Bulls have faced bears' resistance on the last day of the week as most of the coins have come back to the red zone.
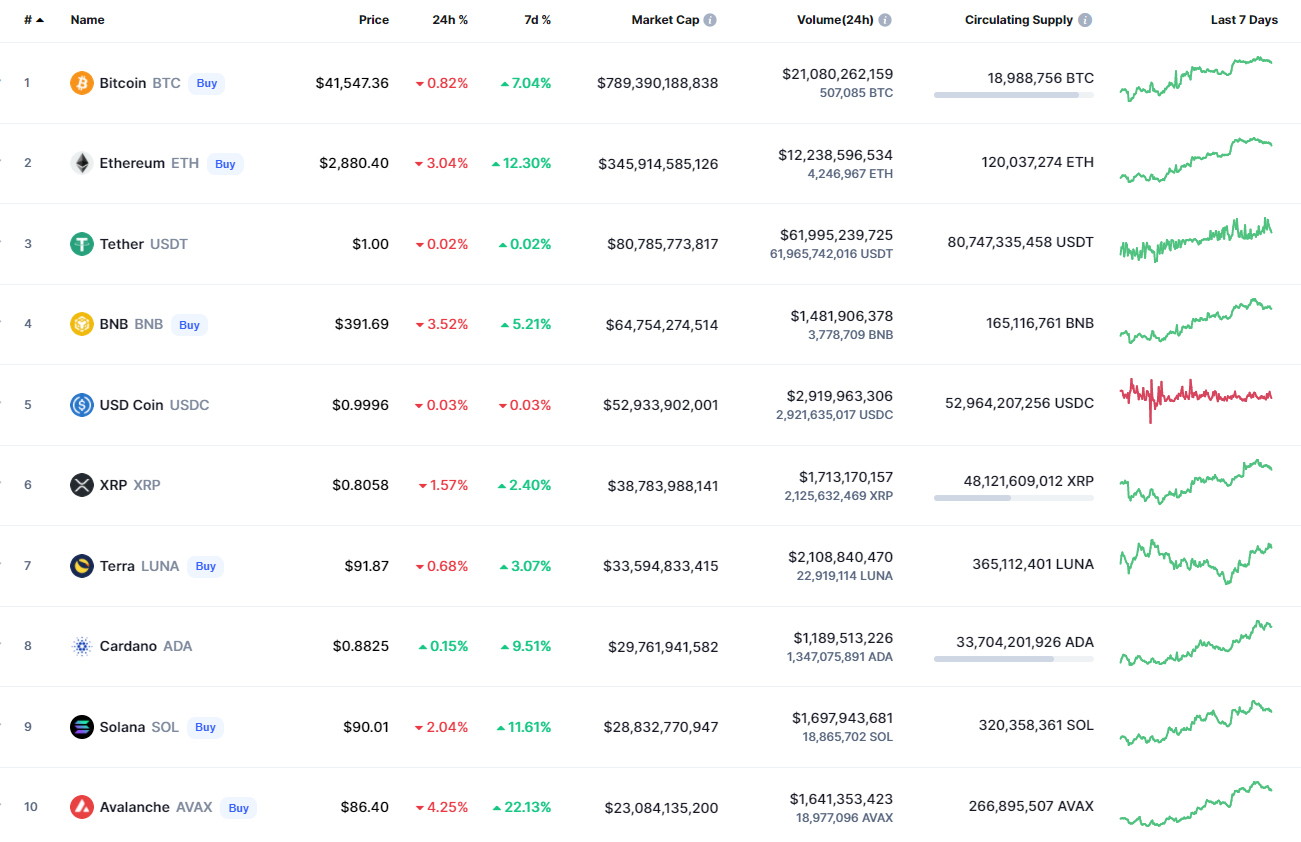
Top coins by CoinMarketCap
BTC/USD
Even though Bitcoin (BTC) has gone down by 0.85% since yesterday, it has grown by 7%.
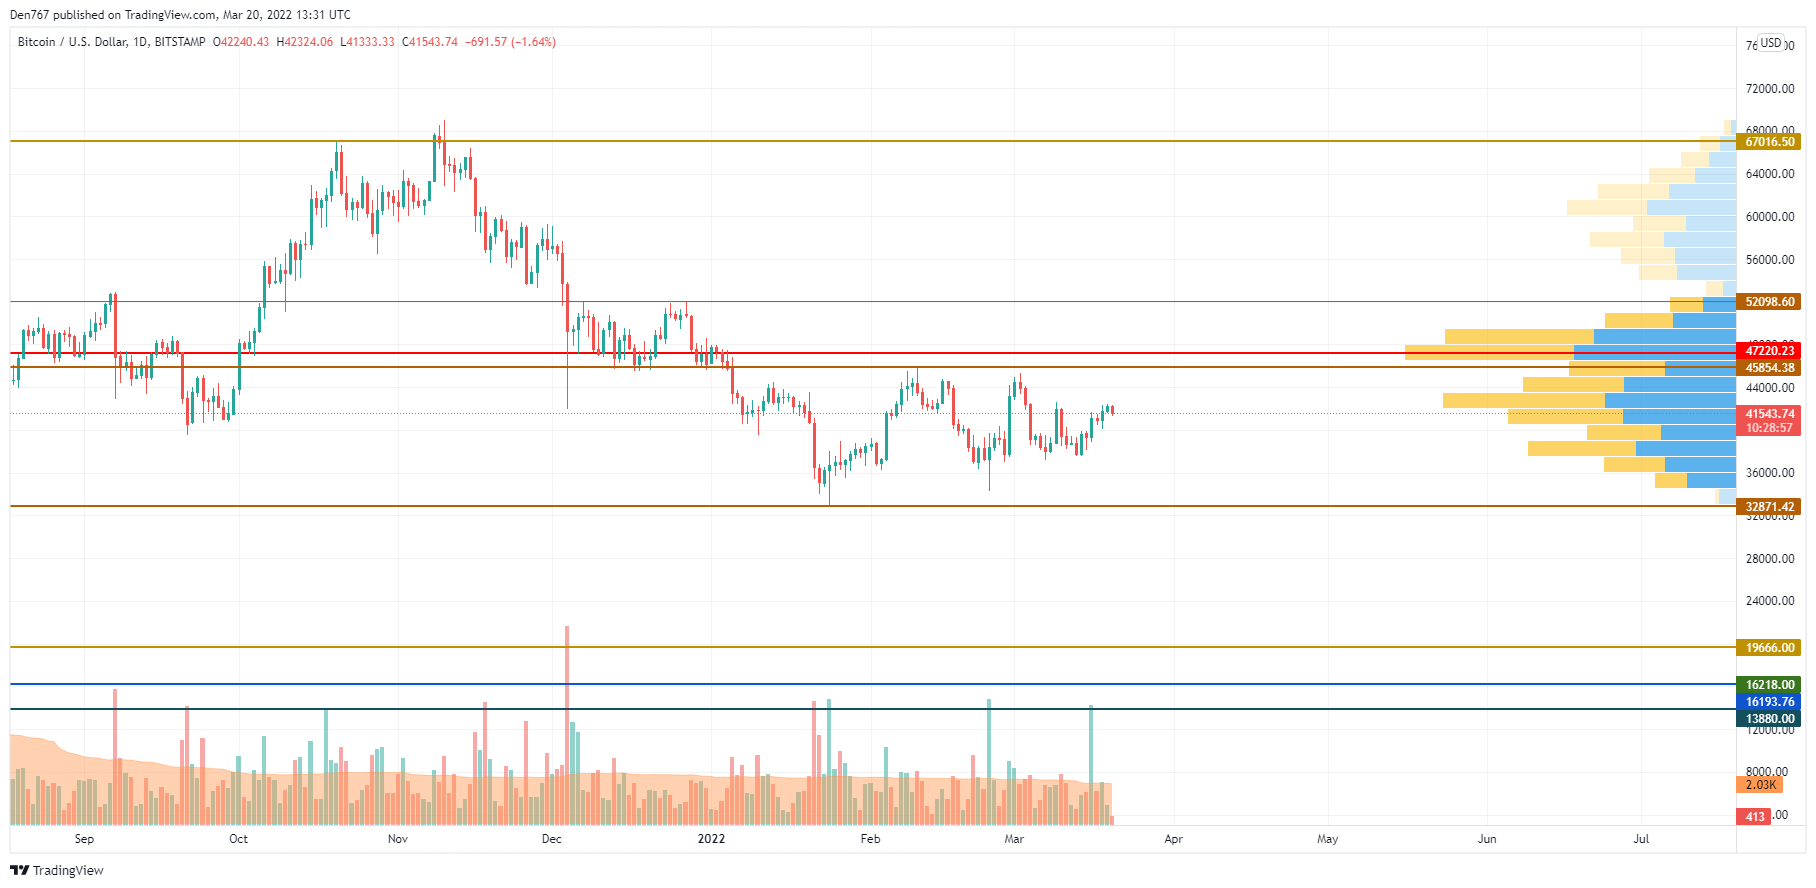
BTC/USD chart by TradingView
Despite today's fall, Bitcoin (BTC) remains bullish as it keeps trading above the vital mark of $41,000. Thus, the rate is approaching the resistance level at $45,854 on the daily chart, which confirms buyers' power.
If the weekly candle fixes around the current levels, there is a chance to see further growth to the zone of $44,000-$45,000 next week.
Bitcoin is trading at $41,546 at press time.
ETH/USD
Ethereum (ETH) has lost more than Bitcoin (BTC) as the main altcoin has declined by 2.78%.

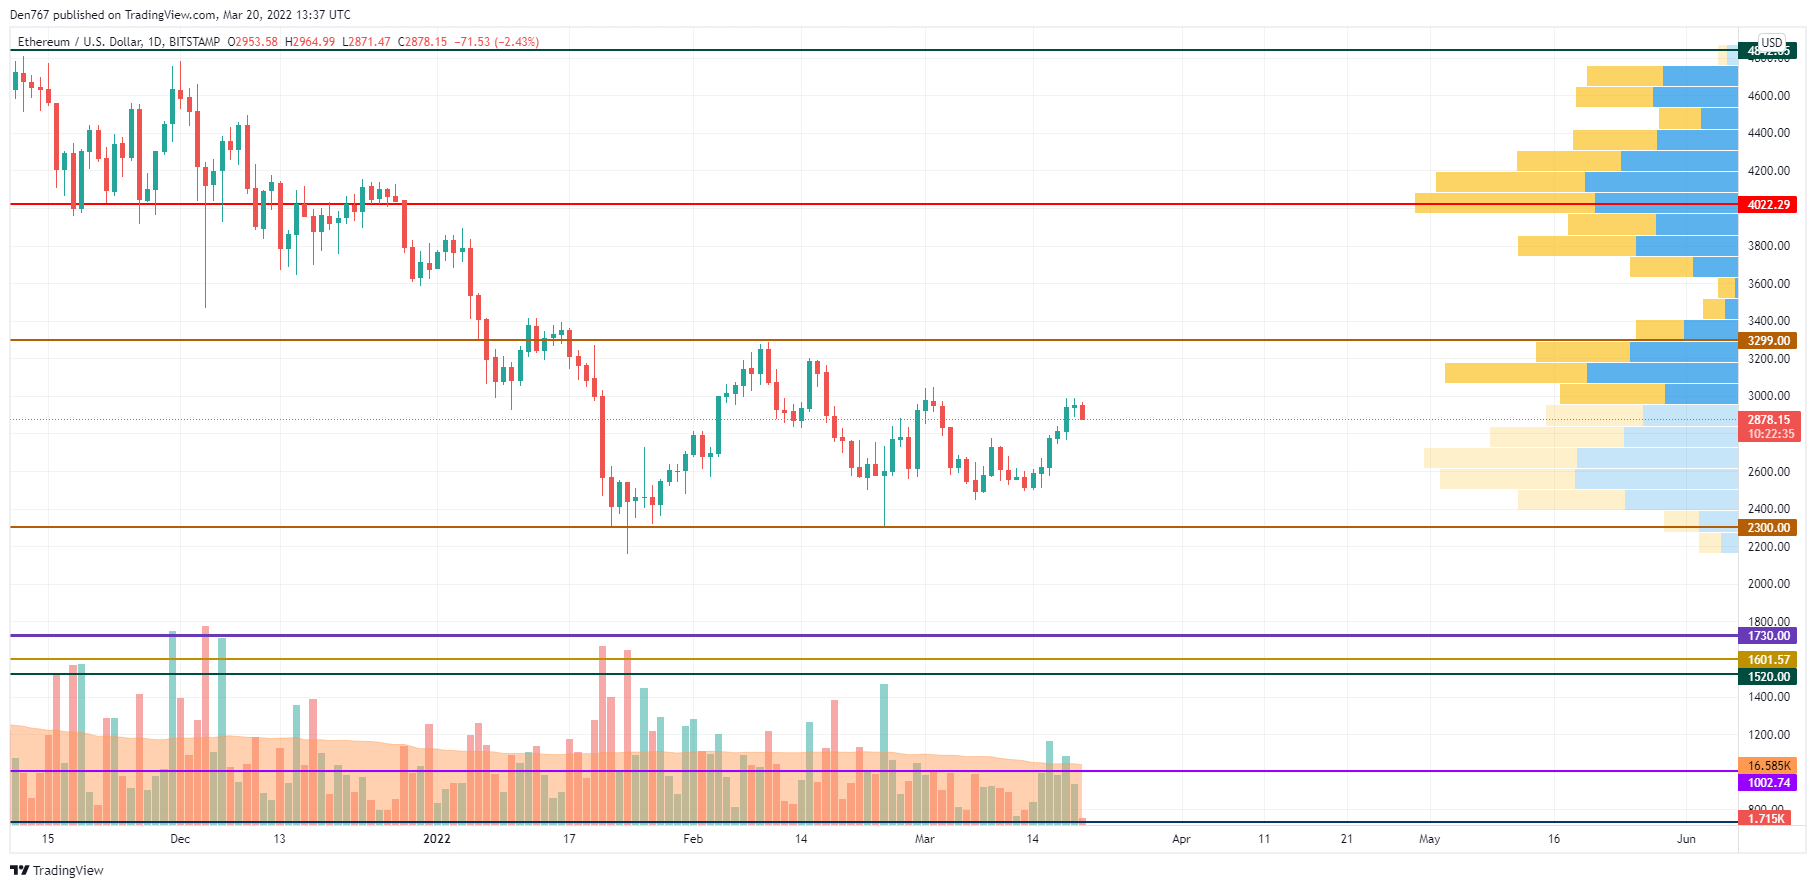
ETH/USD chart by TradingView
Ethereum (ETH) is less bullish than Bitcoin (BTC), as it could fix above the vital mark of $3,000. Until the rate is below this level, sellers are more powerful than bulls. However, if a breakout happens, growth may lead the price to the resistance at $3,300 shortly. Such a scenario is relevant until the end of the month.
Ethereum is trading at $2,881 at press time.
XRP/USD
XRP is no exception to the rule, falling by 1% over the last day.
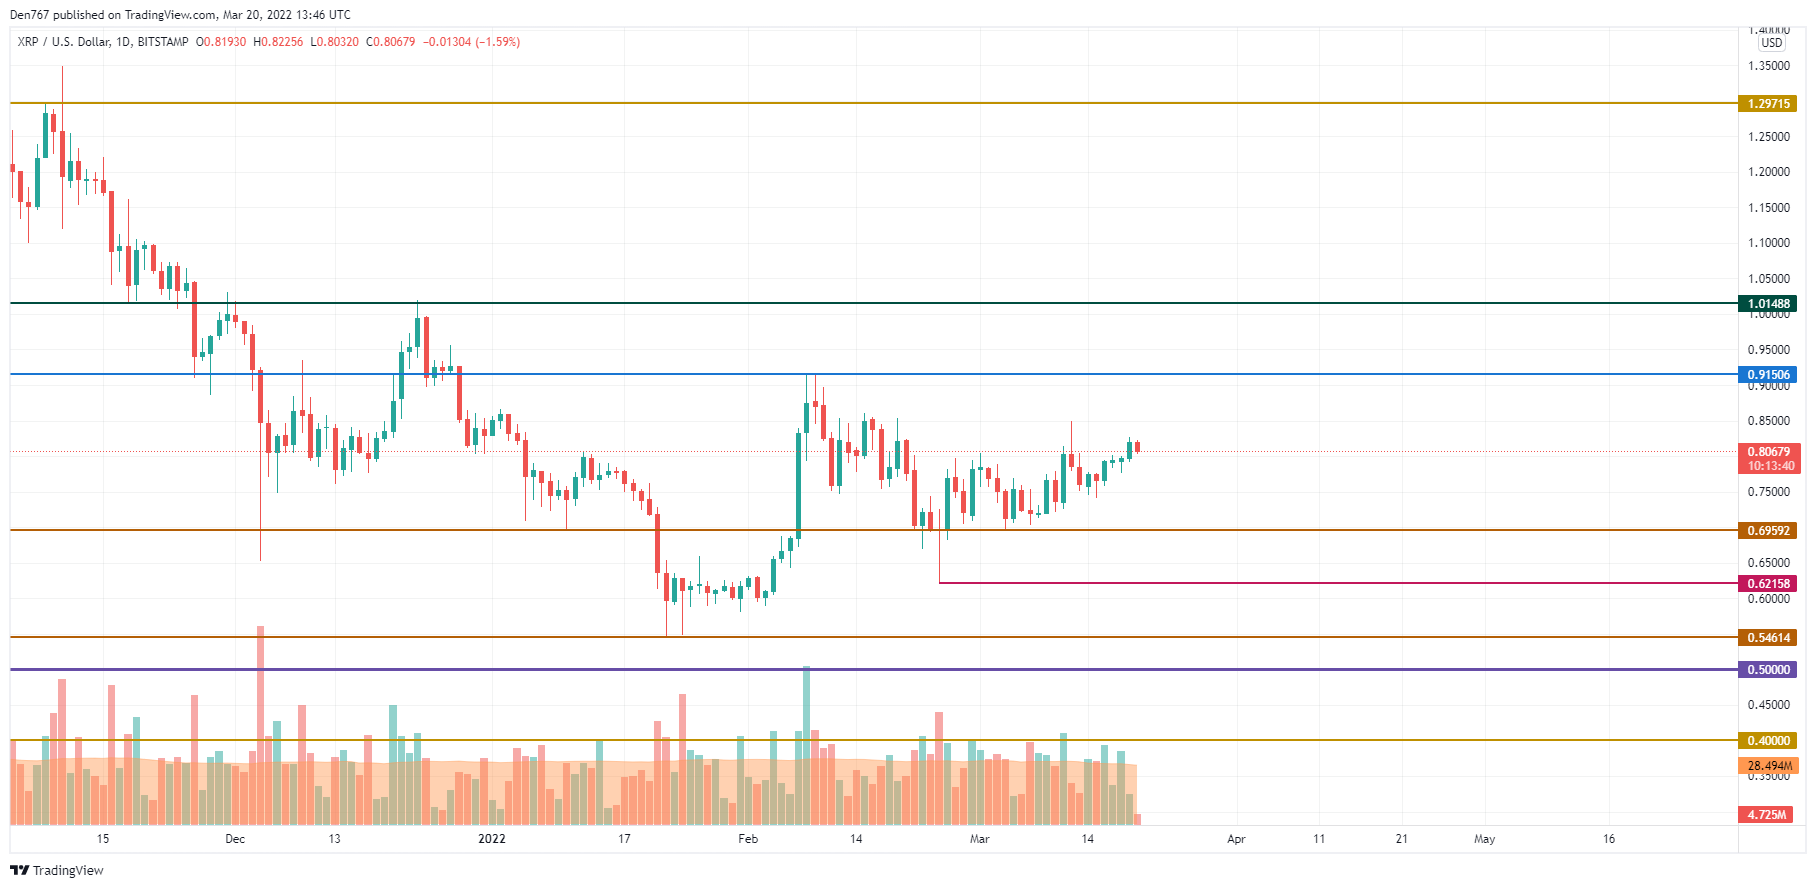
XRP/USD chart by TradingView
XRP is neither bullish nor bearish as the price is far away from its important levels. One can consider any possible growth only if buyers can get the rate back to $0.85. If they fail to do that, there is a likelihood of seeing a short-term drop to the zone around $0.75-$0.77 within the next few days.
XRP is trading at $0.8067 at press time.
BNB/USD
The price of Binance Coin (BNB) has decreased by 2.63% since yesterday.
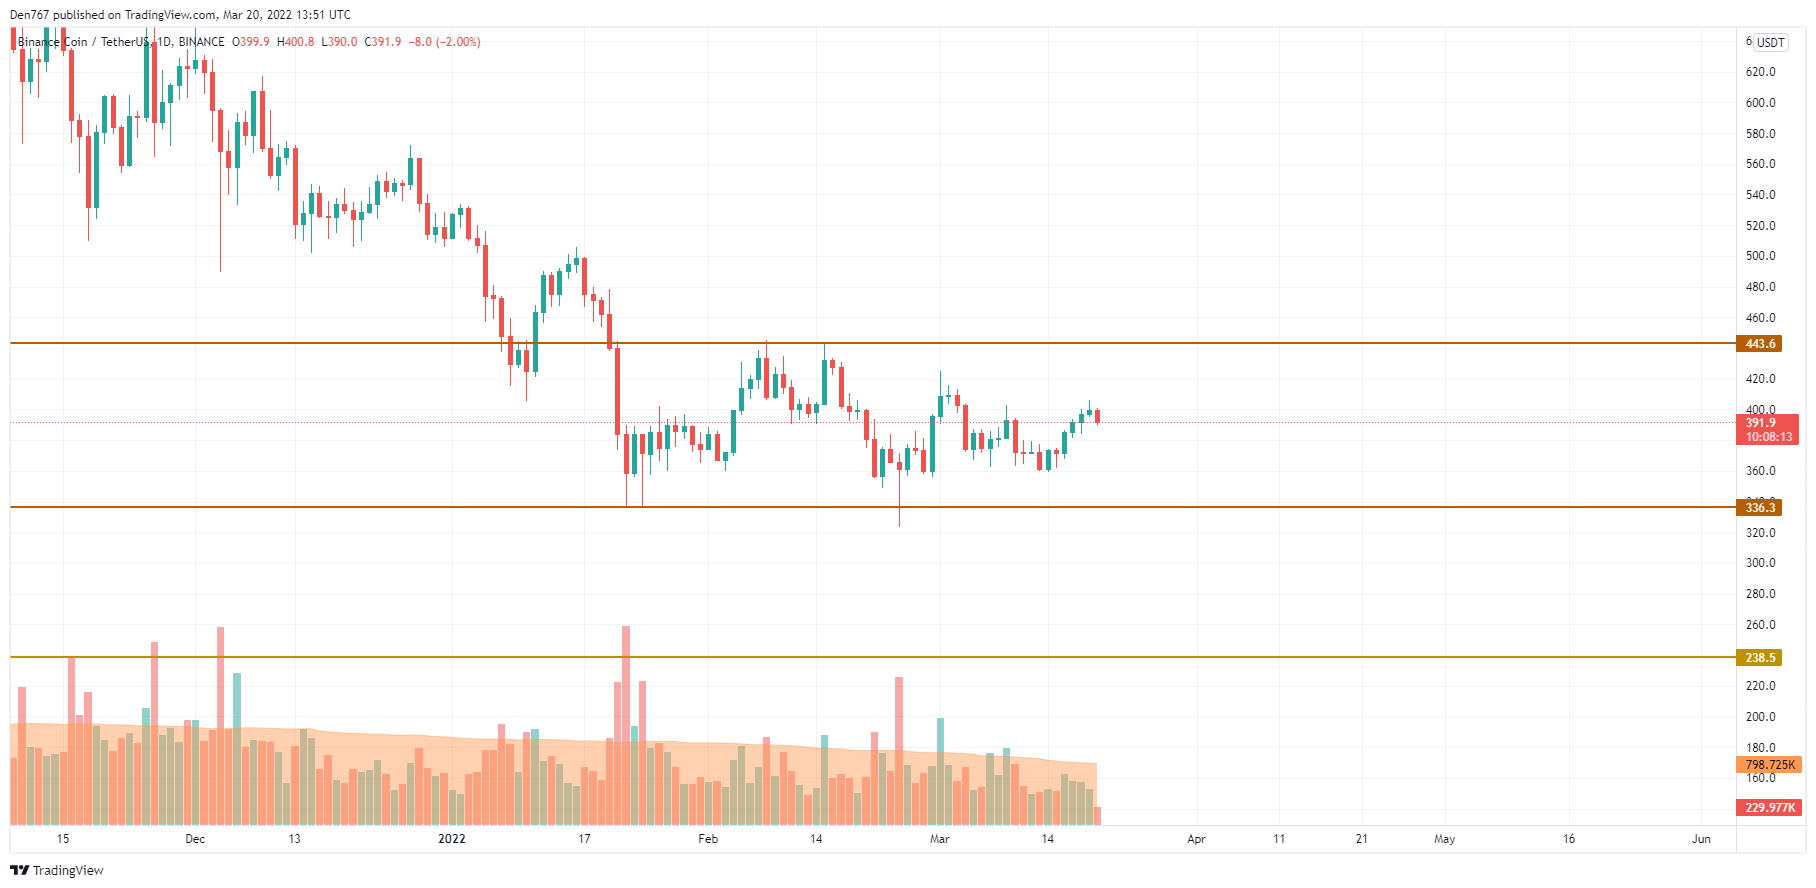
BNB/USD chart by TradingView
Binance Coin (BNB) is trading similarly to XRP as the price is trading sideways. At the moment, one needs to pay close attention to the vital $400 mark, which is a critical level for a further rise. if bulls can fix above it, the growth may continue to the resitance at $443 soon.
BNB is trading at $391.8 at press time.
ADA/USD
Cardano (ADA) is the only gainer from the list today as its rate has gone up by 0.68%.
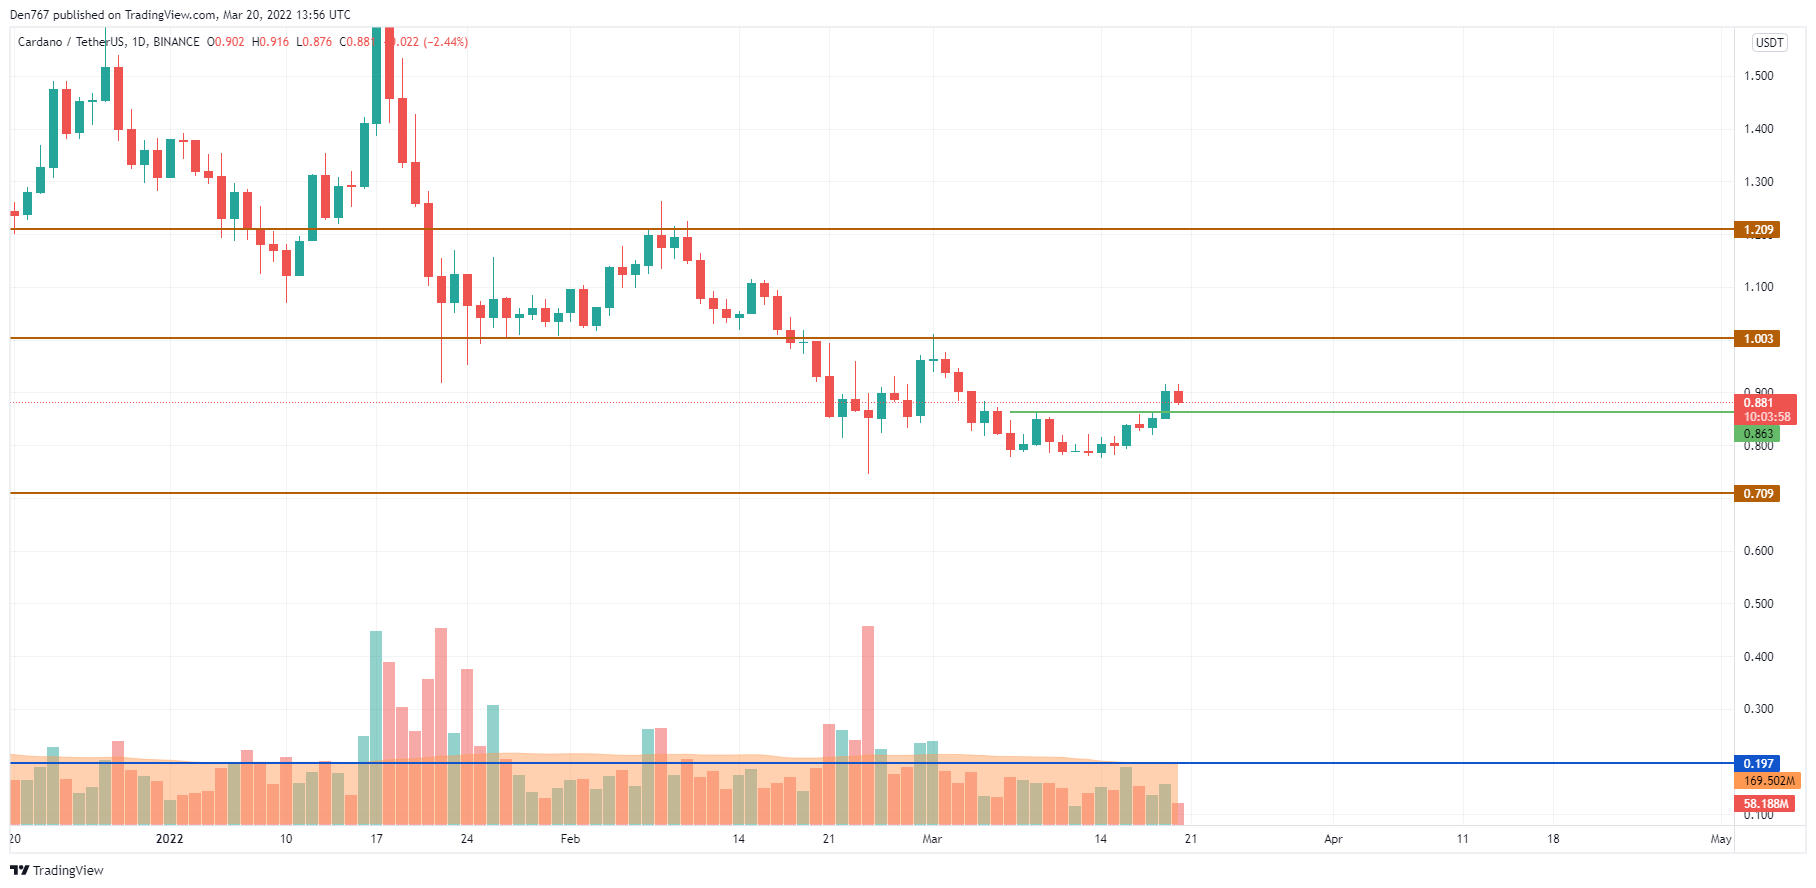
ADA/USD chart by Trading View
From the mid-term point of view, the rate of Cardano (ADA) is going down after the false breakout of the $0.90 mark. Currently, there is a chance to see the bounceback from the mirror level at $0.863. However, if bears break it, the fall may continue to the area around $0.80.
ADA is trading at $0.882 at press time.
Read full original article on U.Today
Author

Denys Serhiichuk
U.Today
With more than 5 years of trading, Denys has a deep knowledge of both technical and fundamental market analysis.


