Top 3 Price Prediction Bitcoin, Ethereum, XRP: Cryptos maintain bullish structure despite growing anxiety
- Bitcoin price action now has the easiest time moving higher since October 2020.
- Ethereum price pushes towards $3,000 with strong buying momentum.
- XRP price is tentative about moving higher, bulls and bears cautious.

Bitcoin price is hanging just below a very thing Ichimoku Cloud on the daily chart, indicating weak resistance ahead. Ethereum price action leads altcoins higher, with ETH testing major resistance. XRP price is at the cusp of confirming a powerful bullish entry setup but needs one more condition to trigger.
Bitcoin price may explode towards $45,000
Bitcoin price is, perhaps, in the most favorable position for an explosive breakout since October 2020. The primary justification for this bullish bias is related to where Bitcoin is at within the Ichimoku Kinko Hyo system.
Thin Ichimoku Clouds represent weakness and ease of movement. Although Senkou Span B represents the strongest support or resistance level in the Ichimoku Kinko Hyo system, it is almost as if Senkou Span is closer to Senkou Span B, the weaker Senkou Span B is. Because Bitcoin is above the Tenkan-Sen and the Kijn-Sen, even a small bullish momentum will likely power Bitcoin price above the Ichimoku Cloud. If that occurs, then an Ideal Bullish Ichimoku Breakout is confirmed.
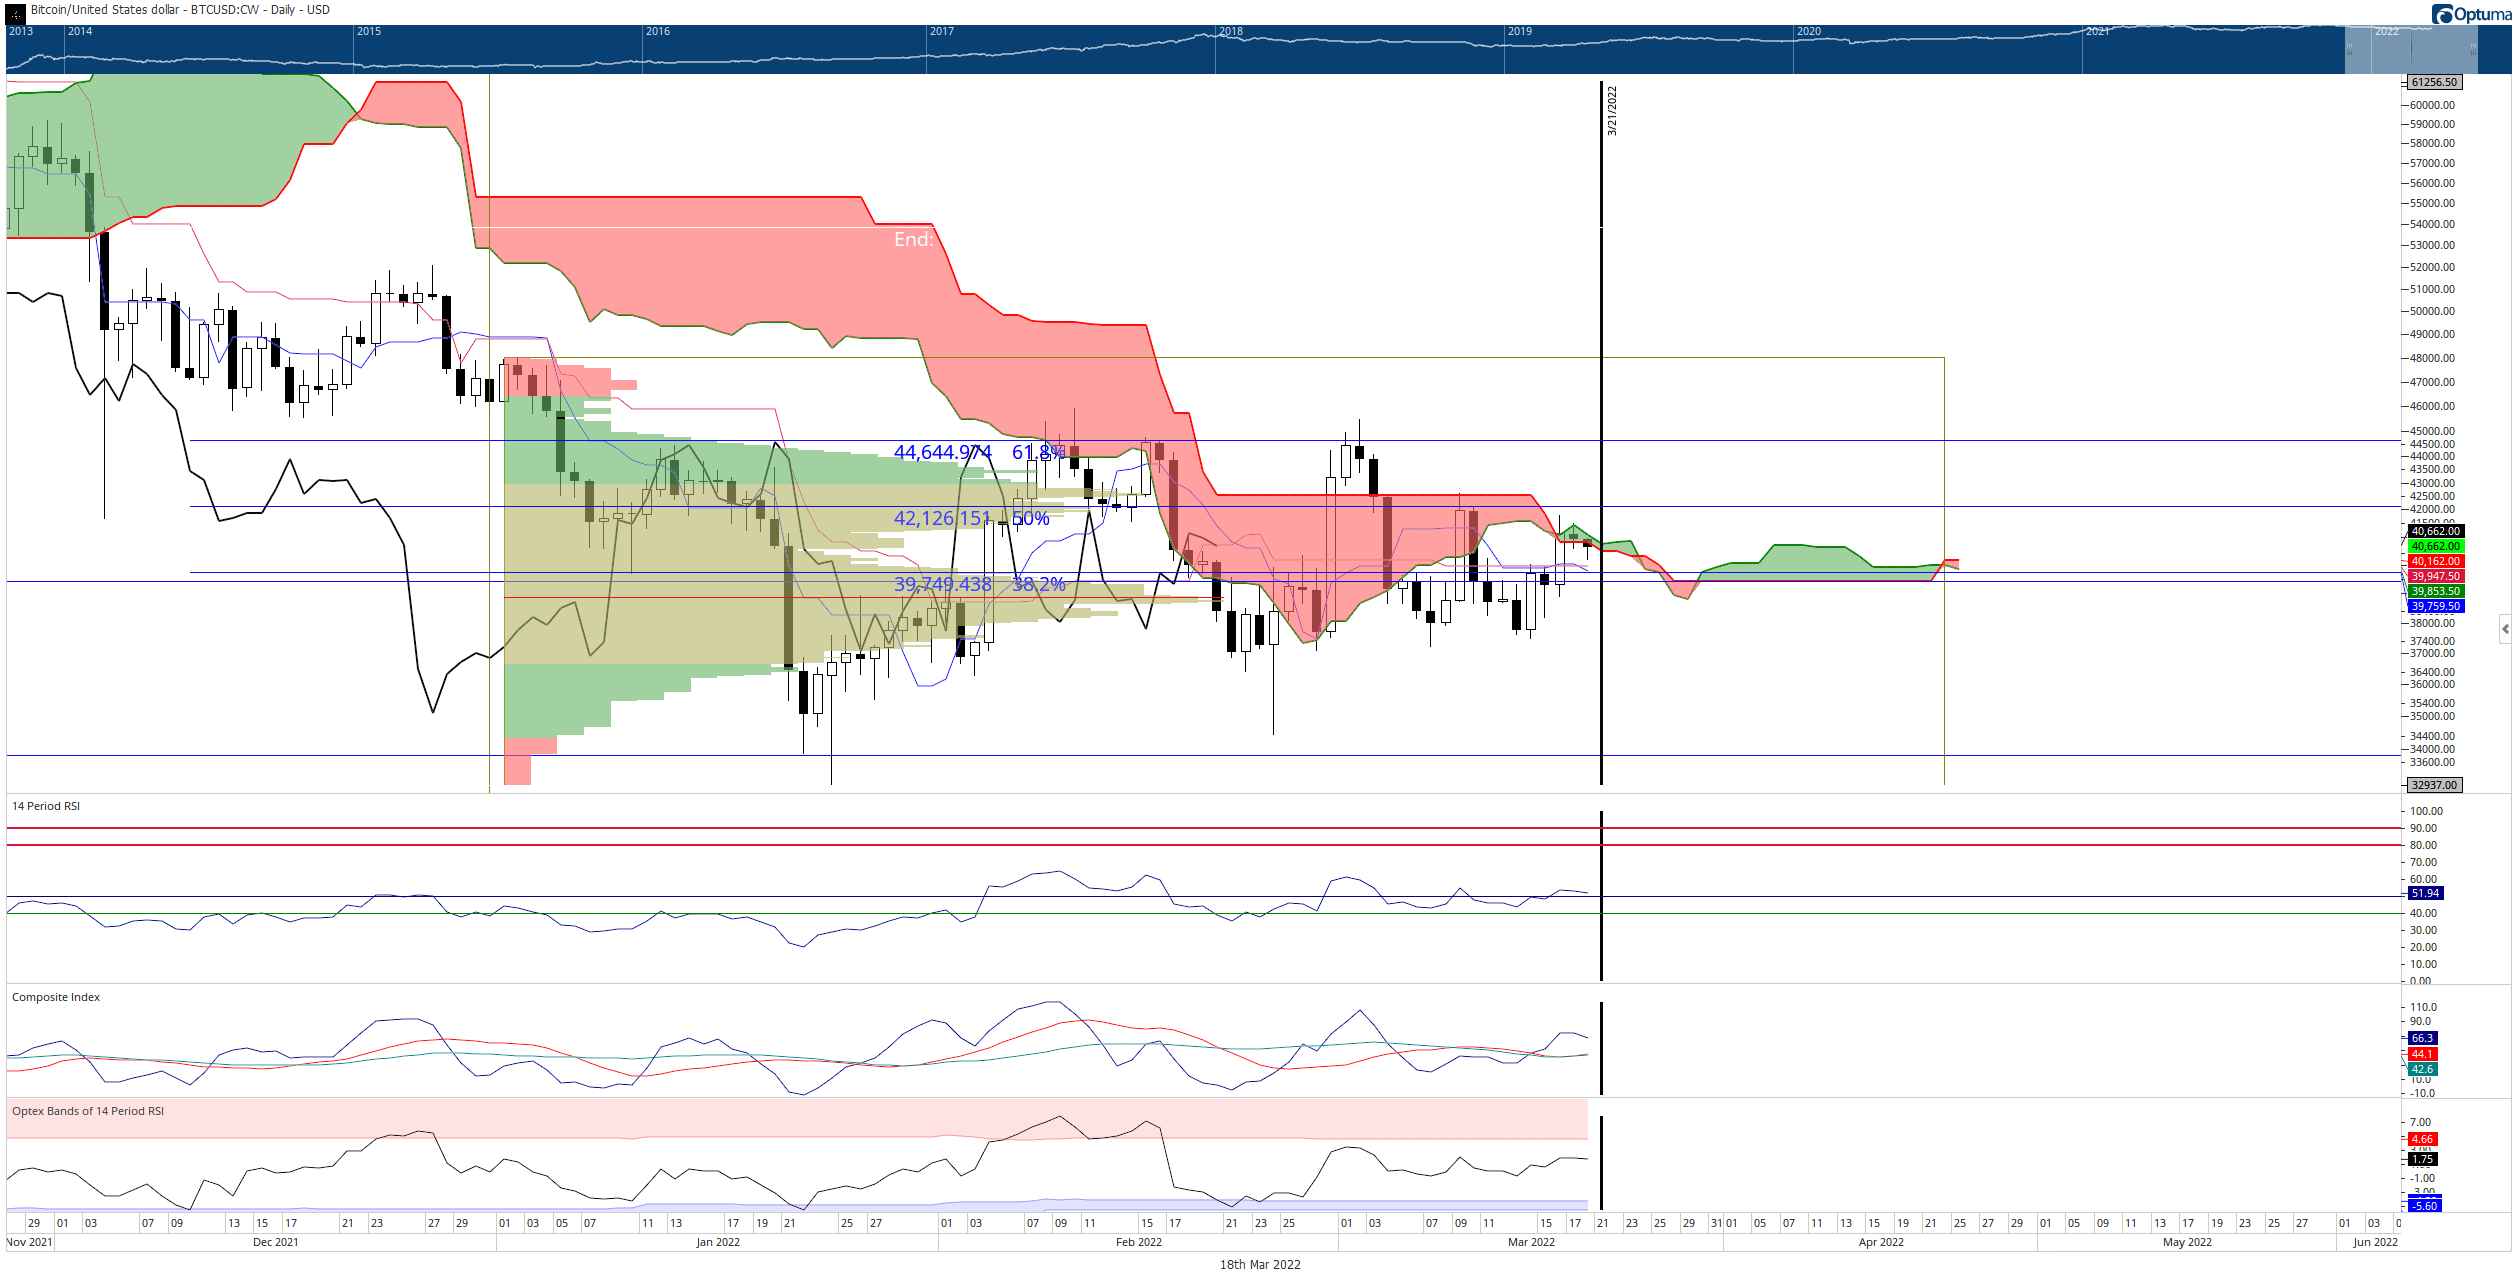
BTC/USD Daily Ichimoku Kinko Hyo Chart
Upside potential for Bitcoin price is likely limited to the 61.8% Fibonacci retracement at $44,600. However, downside risks remain very likely as well. Any daily close below $37,600 may trigger massive selling pressure and return BTC to the $30,000 value area.
Ethereum price testing the first of many major resistance clusters
Ethereum price is on track to close its fifth consecutive bullish daily candlestick. At the time of publication, Ethereum was trading at $2,880, crossing above the bottom of the Ichimoku Cloud (Senkou Span A) and the top of the bull flag. ETH faces several resistance zones before its clear of any further bearish pressure.
The first resistance level Ethereum price must tackle is the 50% Fibonacci retracement at $2,900. Next is the top of the Ichimoku Cloud (Senkou Span B ) at $3,025. Senkou Span B is where Ethereum must close above to confirm an Ideal Bullish Ichimoku Breakout. Consequently, a close at or above $3,030 would put Ethereum above the weekly Ichimoku Cloud.
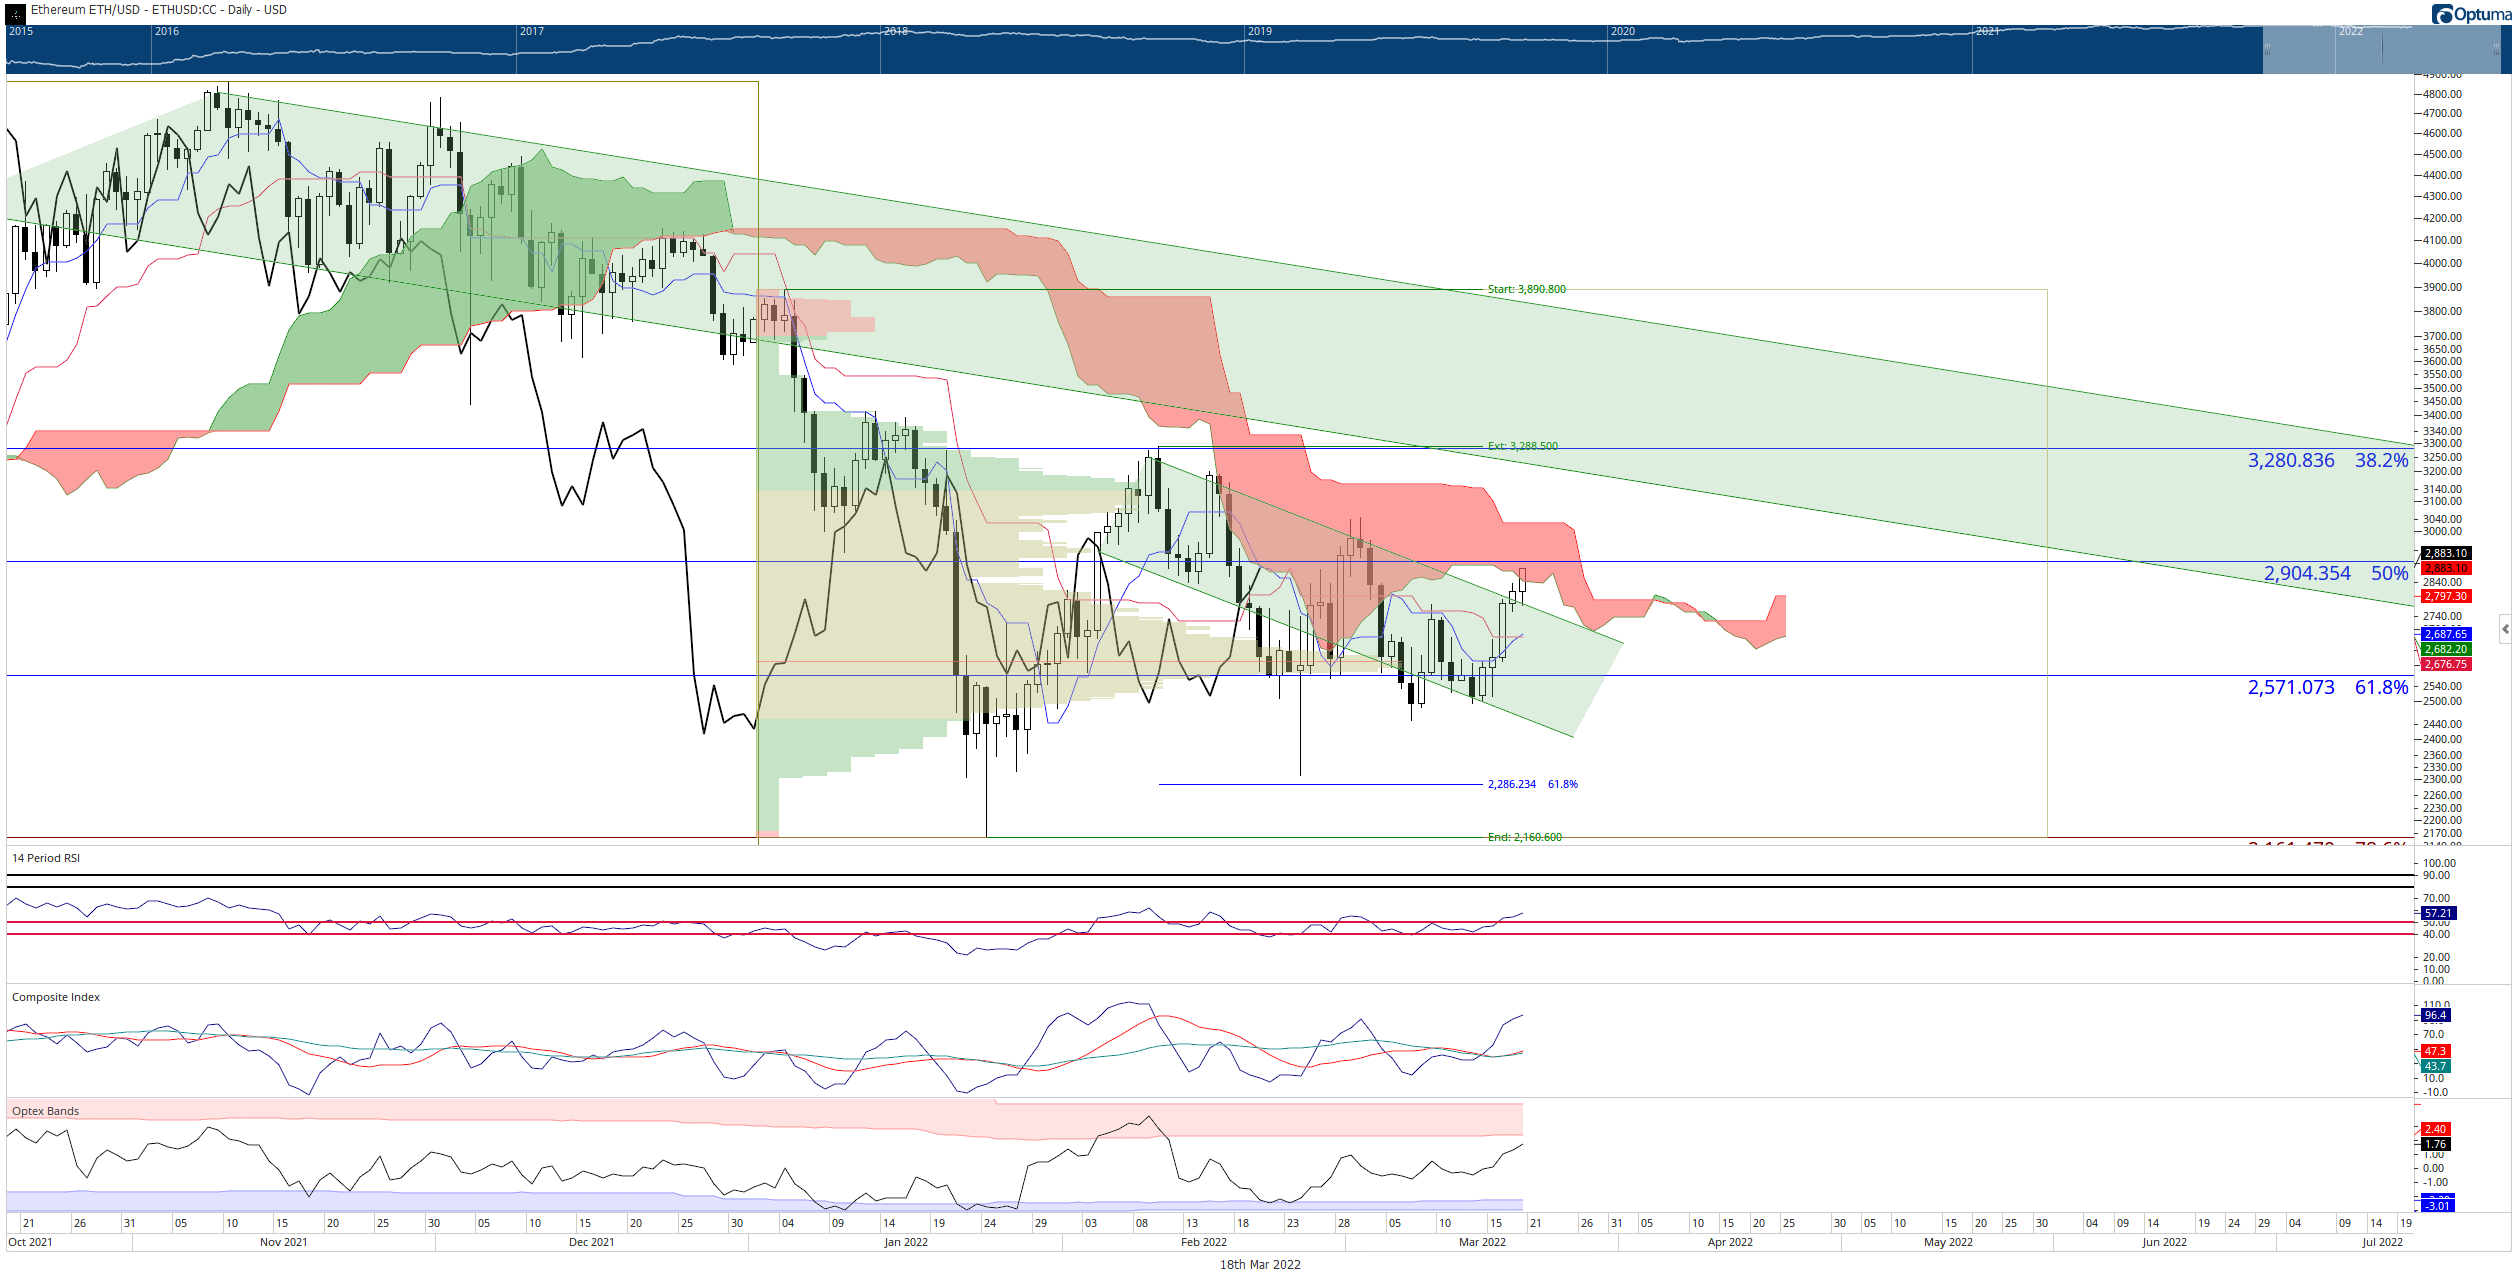
ETH/USD Daily Ichimoku Kinko Hyo Chart
Upside potential going into the weekend is likely limited to the bottom of a prior bull flag and the 38.2% Fibonacci retracement, which share the $3,280 value area.
For bears to remain in control of Ethereum price, they will need to push ETH to a close below $2,400. If that occurs, any near-term bullish outlook will be invalidated.
XRP price very close to confirming an Ideal Bullish Ichimoku Breakout
XRP price is annoyingly close to triggering an Ideal Bullish Ichimoku Breakout. If bulls can keep XRP above the Tenkan-Sen at or above $0.787, then when the next daily candlestick opens up, the Chikou Span will be above the bodies of the candlesticks and in open space: confirming the bullish entry. The target upon confirmation is likely the $1.05 to $1.07 value area.
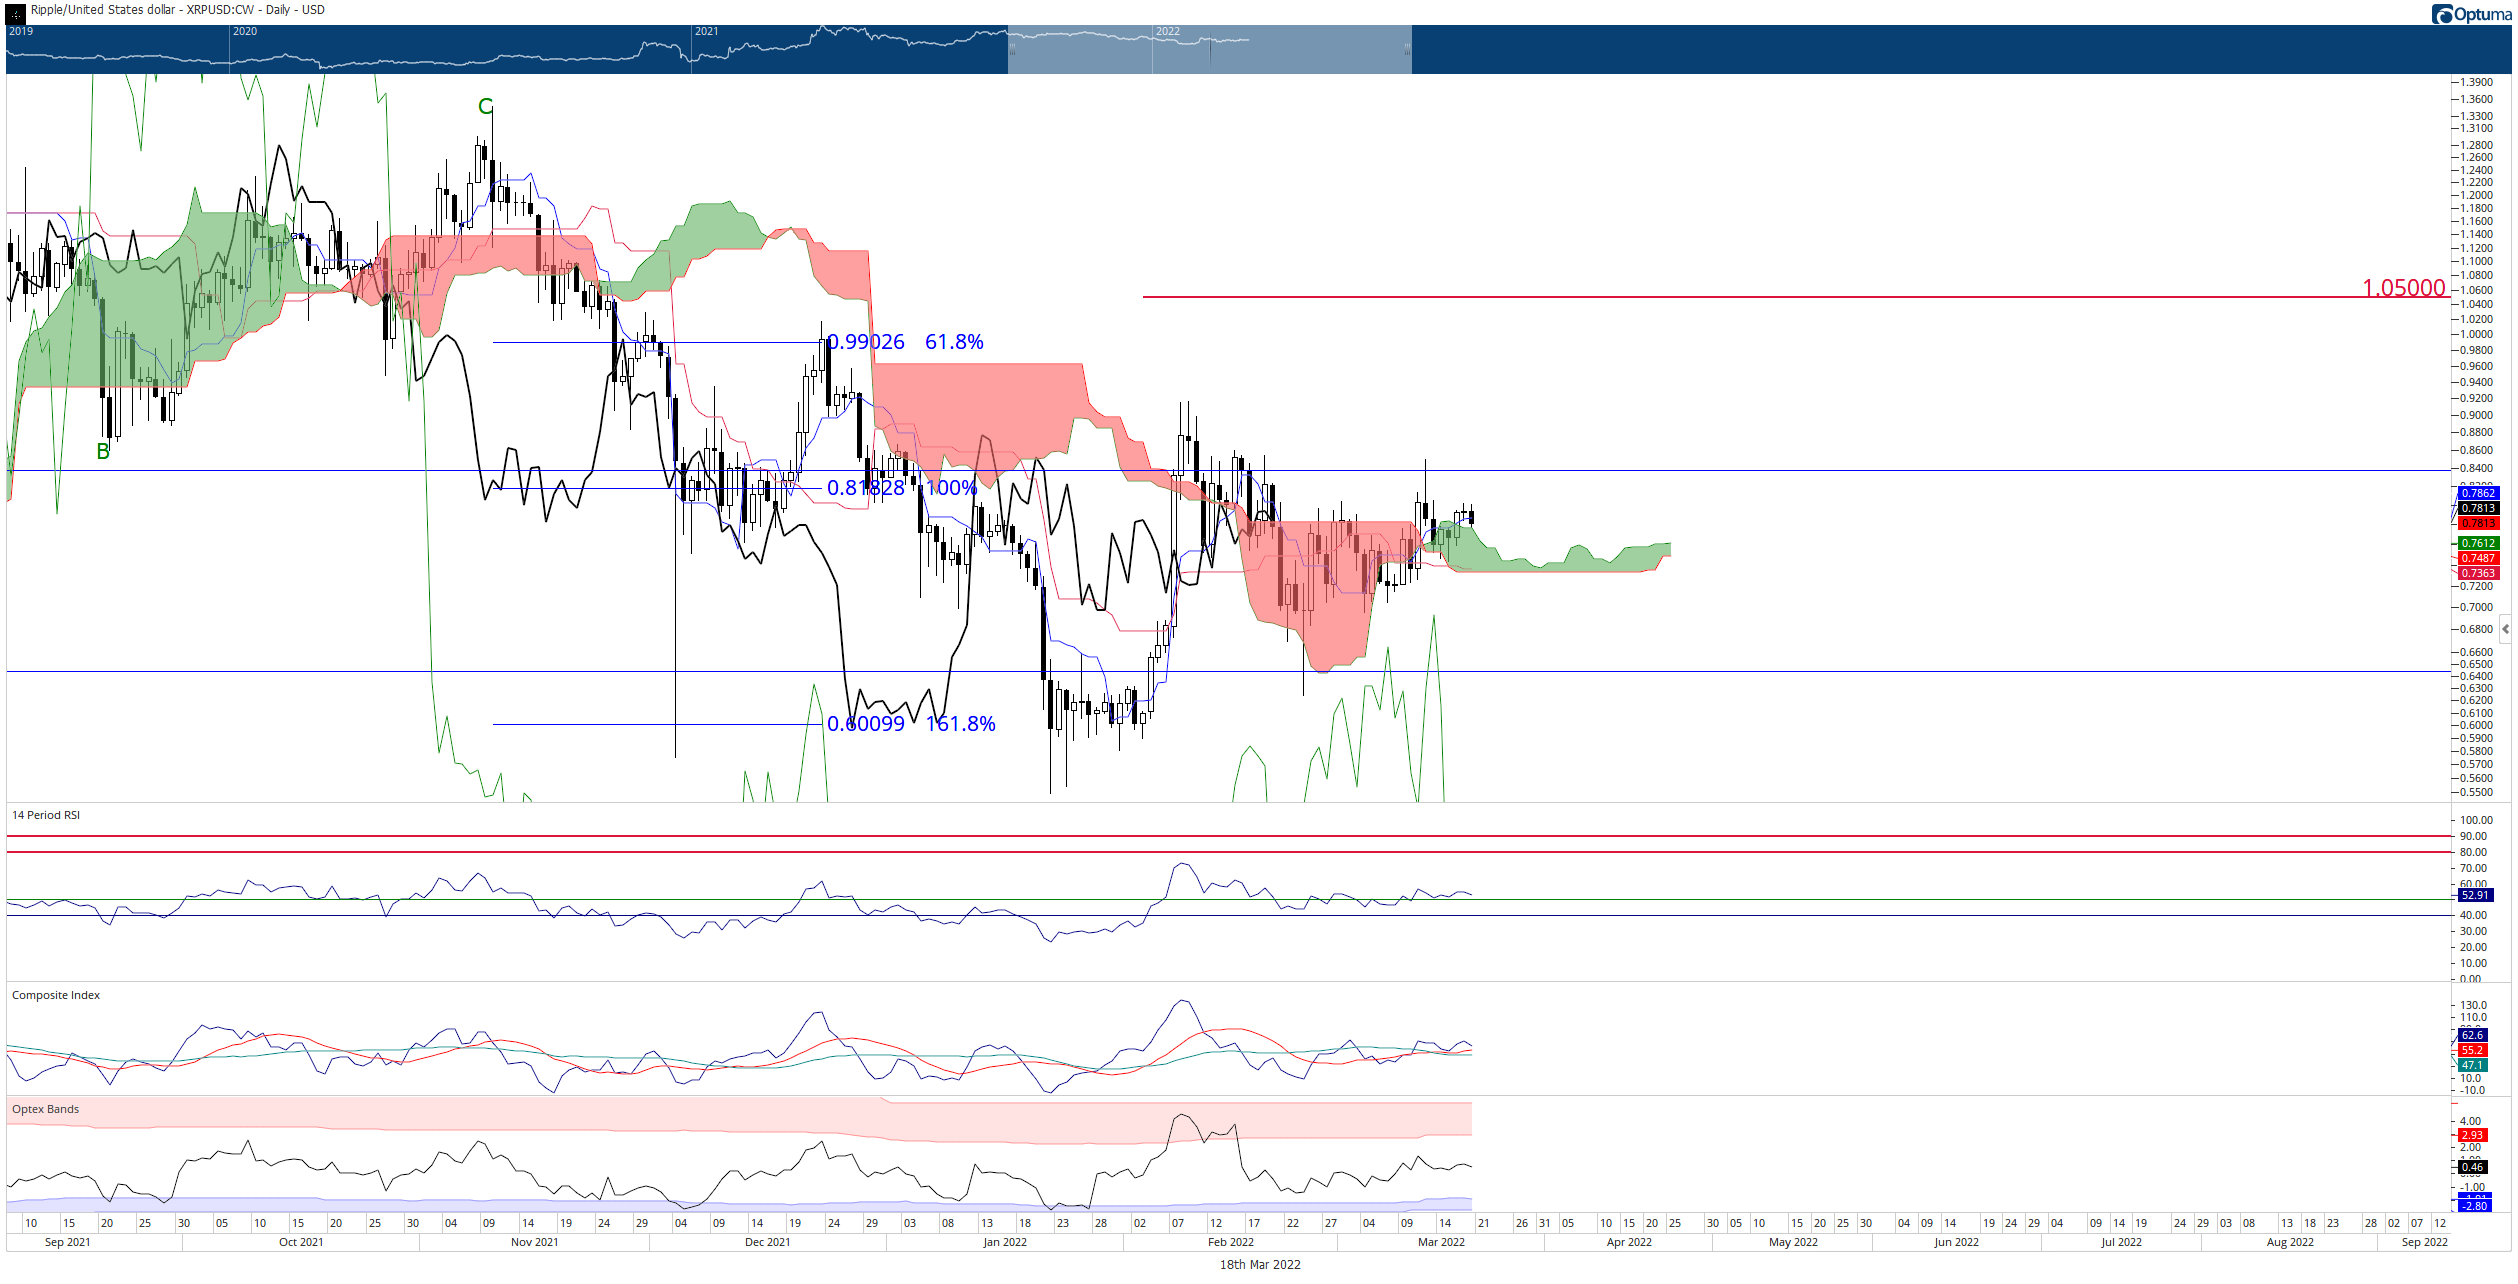
XRP/USDT Daily Ichimoku Kinko Hyo Chart
However, downside risks remain a major concern. Weekends are notoriously volatile, doubly so with Russia’s invasion of Ukraine. Bears could very easily push XRP price below the Ichimoku Cloud (Senkou Span B) at $0.73 and trigger a bearish continuation move to see XRP revisit the $0.50 value area.
Author

Jonathan Morgan
Independent Analyst
Jonathan has been working as an Independent future, forex, and cryptocurrency trader and analyst for 8 years. He also has been writing for the past 5 years.


