Top 3 Price Prediction Bitcoin, Ethereum, Ripple: Cryptos march to new highs with uptrend intact
- Bitcoin prices confirm the Fibonacci retracement with a rejection, and bulls are still on track for $100.000.
- Ethereum price fades in the wake of $5,000, but the rally's support still holds firm.
- XRP price sees bulls dipping their toes in the water near $1.37 before attacking $1.42.

Bitcoin price popped higher yesterday and made new all-time highs around $69,123.70, but then came under pressure from profit-taking in the US session as global markets got rattled by higher-than-expected inflation data. A similar pattern unfolded for both Ethereum and Ripple price action. With the US session closed today, investors will have a chance to reassess the situation and look beyond the inflation print to determine if markets will open in risk-off mode tomorrow or will shake off the inflation worries and focus back on the several bull runs that are ongoing.
Bitcoin price rattled by US inflation, but the uptrend is showing no significant signs of weakness
Bitcoin (BTC) price hit a new all-time high yesterday at $69,123.70. It should not come as a surprise that it is bang on the 23.6% Fibonacci level indicated on the graph, with a price target at $100,000. The test and rejection – almost to the tick – at this level indicate that many contributors in Bitcoin price are looking and using this Fibonacci retracement as a guide going forward in the rally.
BTC price’s rally, however, faced increasing headwinds from US inflation data. With inflation in the US rising above 6%, markets are questioning whether the Federal Reserve has sufficiently got behind the curve, and whether they have misestimated the fact that inflation will not be transitory but persistent. This made investors quickly reshuffle their portfolios after the numbers were published with a bid in risk-off assets like bonds and hefty selling in equities and cryptocurrencies.
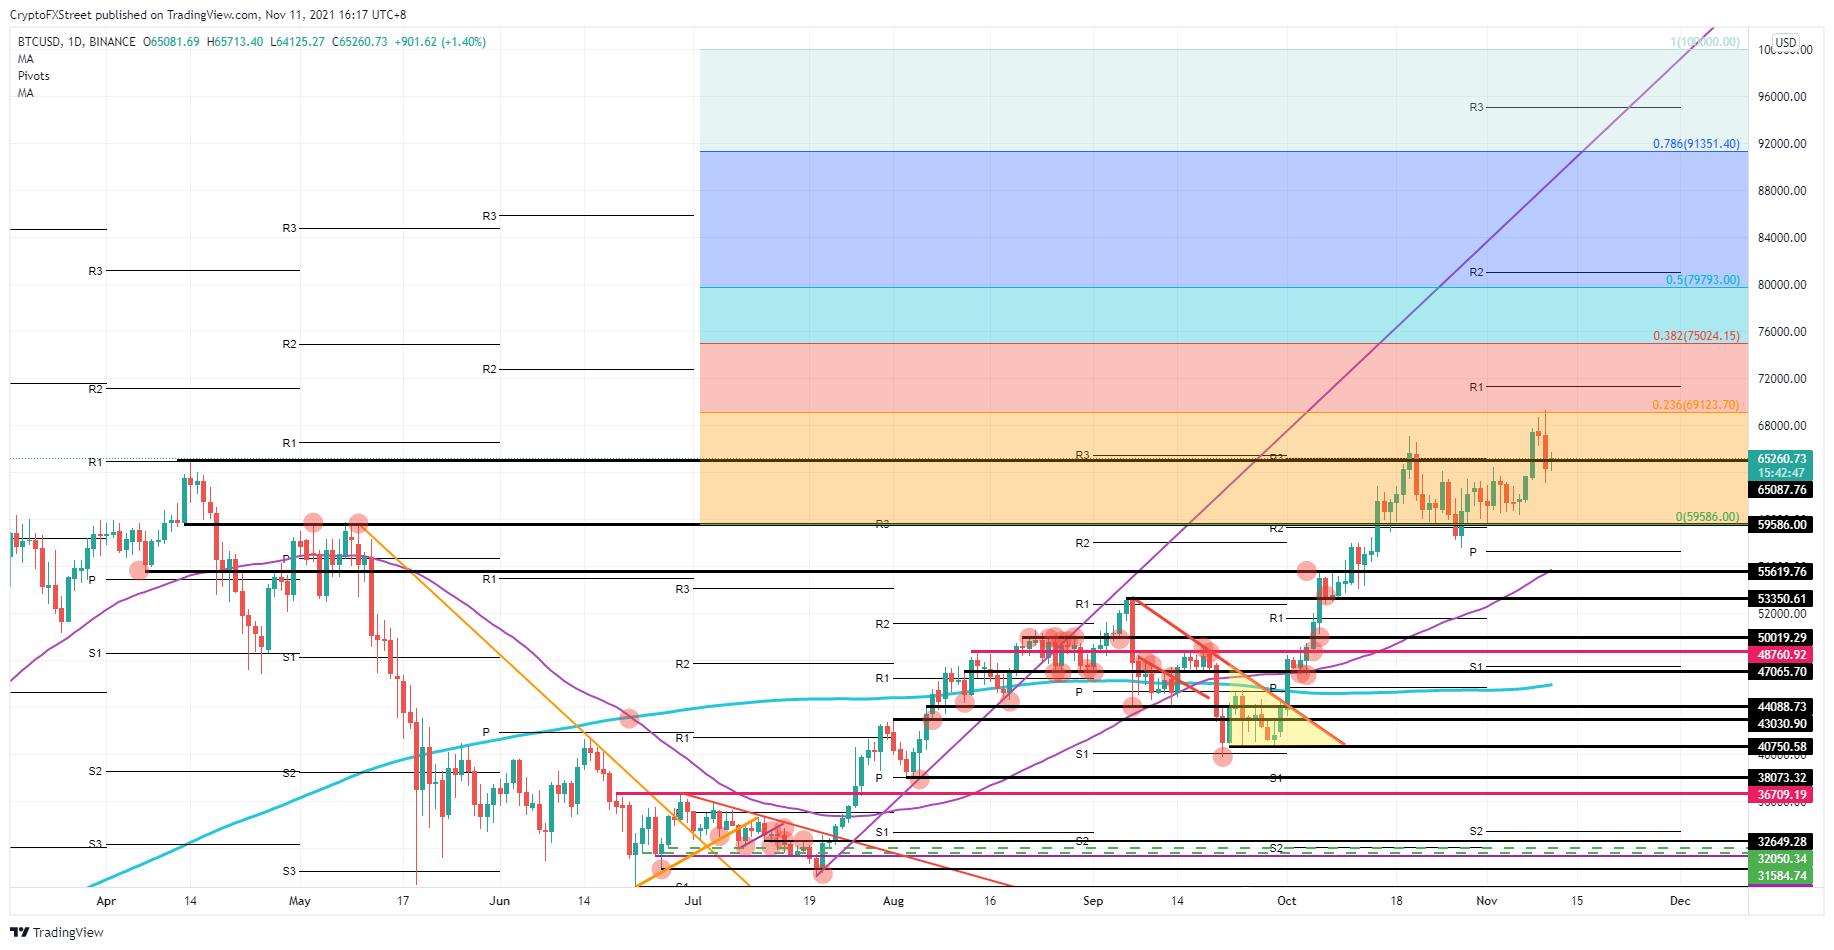
BTC/USD daily chart
The rejection of the 23.6$ Fibonacci level is no reason for panic, as the bandwidth between $59,586 and $69,123 is still respected for now and keeps the momentum going in favor of the uptrend. Any rally will see some profit-taking along the way, thus expect bulls to slowly but surely re-enter again and push price upwards as tailwinds are still present and the inflationary headwind will start to fade by the end of the week. Expect the following test to break above $69,123, making new highs and target $75,024, which is a key 38.2% Fibonacci retracement level.
Ethereum price hit a curb just shy of $5,000, with the uptrend still in good form
Ethereum (ETH) price seemed poised to hit $5,000 yesterday, but both the monthly R1 resistance level at $4,905 and the shift in market sentiment after US inflation data proved to be too much of a headwind and ETH price failed to hit its objective. With that said, the quick fade showed the soundness and healthiness of the rally as bears were unable to push price back down towards the green ascending trend line. Ethereum shorters got stopped in their tracks at $4,410 and did not even get to test the ascending trend line properly.
ETH price has been using that green ascending trend line to guide the uptrend since the beginning of October. The fact that bulls got in that quickly even before the trend line got tested shows that investors and participants keep an eye on Ethereum price action and will jump on any occasion they see to pick up some ETH coins on occasional dips. With ETH price opening around $4,660, quite a lot of shorters will be caught in a bear trap and see their positions stopped out or will be considering taking their losses, which should open the road towards $5,000 again and a possible break above.
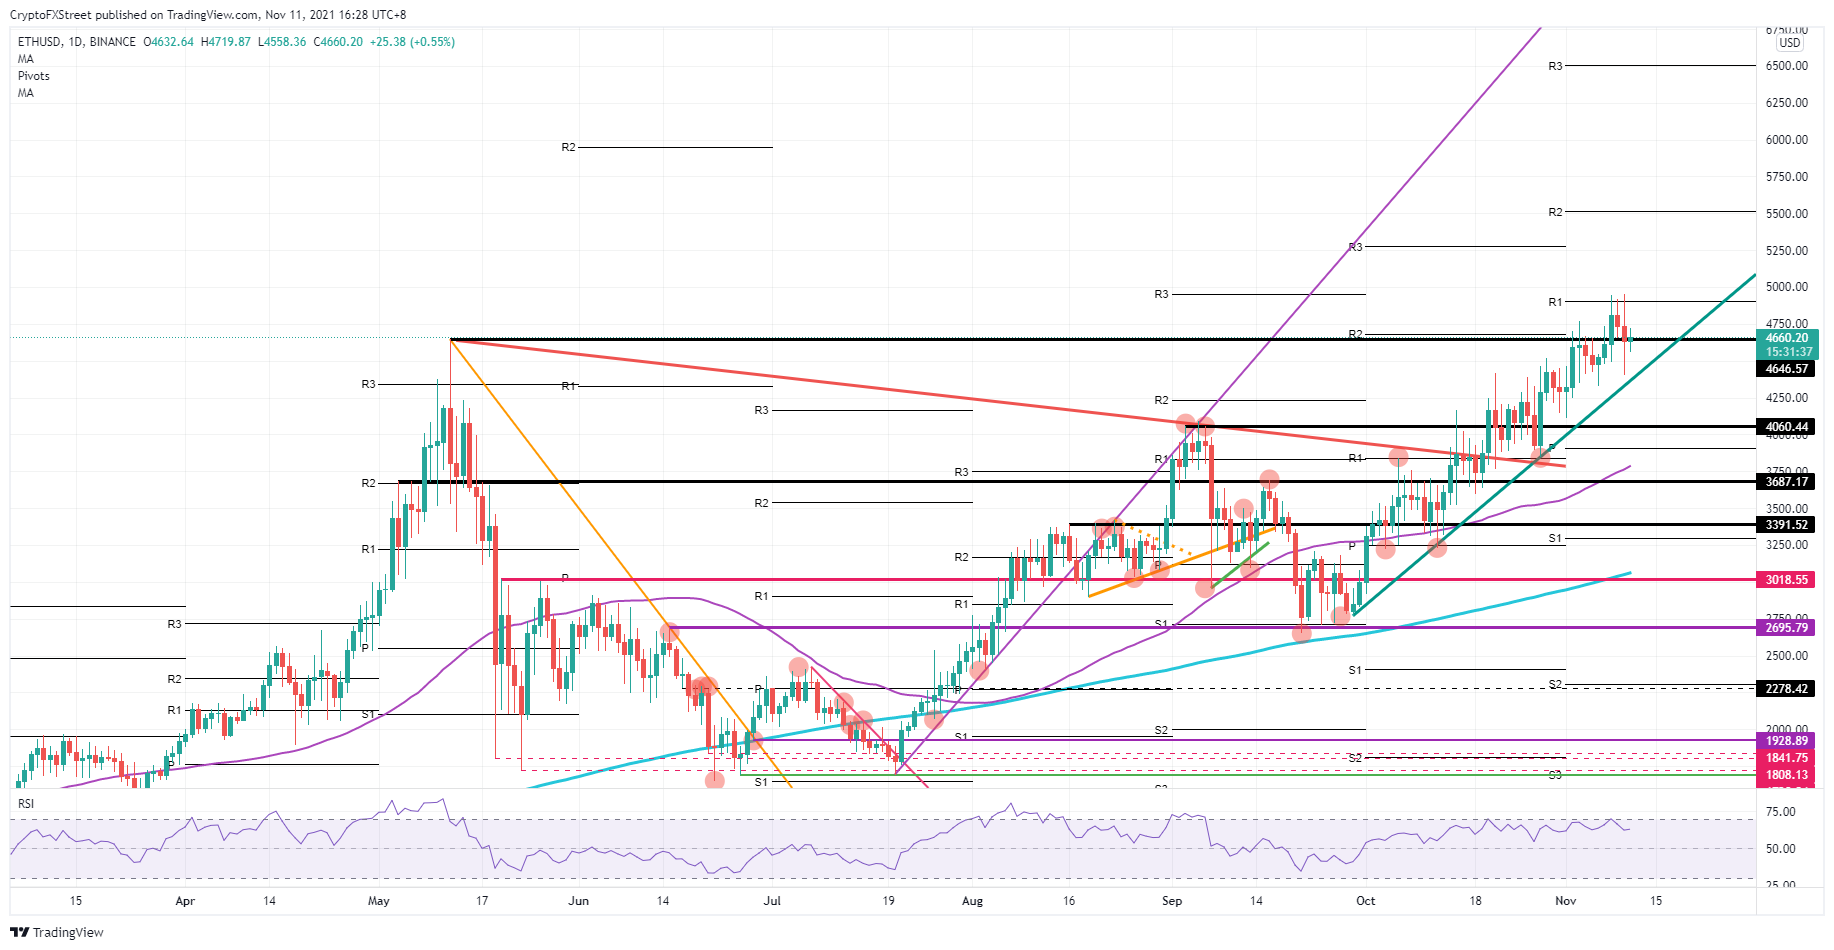
ETH/USD daily chart
As the dust settles in markets, expect the first ETH price to still favor the upside with a retest of the R1 resistance level at $4,905. Once bulls can push Ethereum price action beyond that point, the road looks paved for $5,500, but expect quite some resistance at that level as it falls in line with the monthly R2 resistance level. If global markets continue their downturn on Friday, expect a break of the green ascending trend line, with the first line of support coming in at $4,060.
XRP price correction shows resilient bulls back on track for break above $1.42
Ripple (XRP) price saw a violent correction on Wednesday despite bulls pushing XRP price above $1.36. Price action faded instantly in the wake of a heavy inflation printout and headwinds popping up for XRP price with a short-term shift in sentiment. Today XRP price is already trading back above the short-term green ascending trend line and could bring consolidation above $1.24 once and for all.
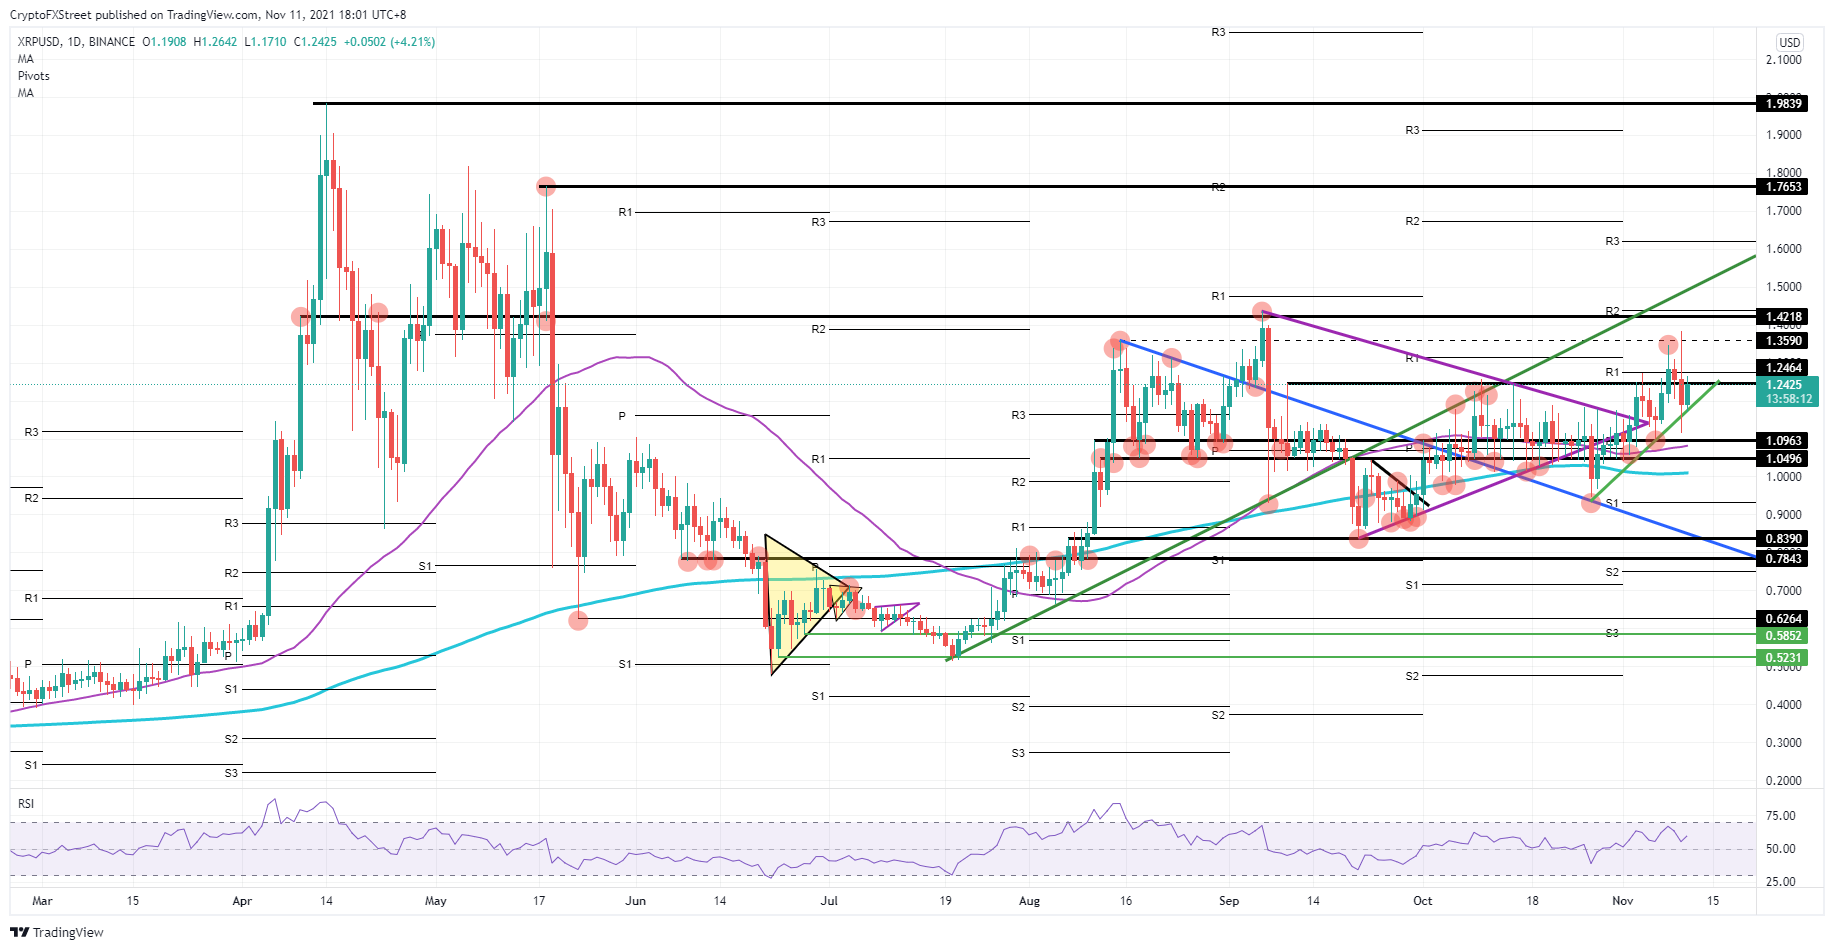
XRP/USD daily chart
When bulls can push XRP price above the monthly R1 at $1.27, expect more bulls to get in and ramp up price action towards $1.36. The reaction here might be different as markets will no longer be producing a headwind, and the favorable tailwinds out of Bitcoin and Ethereum should propel into more buy-side volume for Ripple. A pop above $1.42 would see significant bids from investors that want to ride the trend up to $1.76, which falls in line with the high from May 18.
Author

Filip Lagaart
FXStreet
Filip Lagaart is a former sales/trader with over 15 years of financial markets expertise under its belt.


