Top 3 Price Prediction Bitcoin, Ethereum, Ripple: XRP lags while BTC and ETH take lead
- Bitcoin price continues to set new highs as buyers come out of the woodwork.
- Ethereum price locks in on $5,000 and shows no signs of slowing down.
- Ripple price needs to flip $1.41 into support floor to revisit $2.

Bitcoin price is hovering inside a crucial demand zone that needs to hold for the upswing to continue. A resurgence of buying pressure that pushes BTC to produce a daily close above it will confirm the resumption of an uptrend and suggest new highs are incoming. Such a move will also cause Etheruem and Ripple to go higher as well.
Bitcoin price awaits bullish momentum
Bitcoin price has entered the $63,805 to $67,162 demand zone after setting up a new high at $68,778 on November 9. This descent was caused by investors booking profits and is likely to stabilize and reverse soon.
A daily close above $67,162 will confirm the start of a new uptrend and propel the big crypto to the 161.8% Fibonacci extension level at $77,908. This run-up would constitute a 17% surge from the current position
In a highly bullish and long-term scenario, BTC is likely to set up a high at $100,000 or the 261.8% trend-based Fibonacci. This development would be historic as Bitcoin price would enter the six-digit territory for the first time.
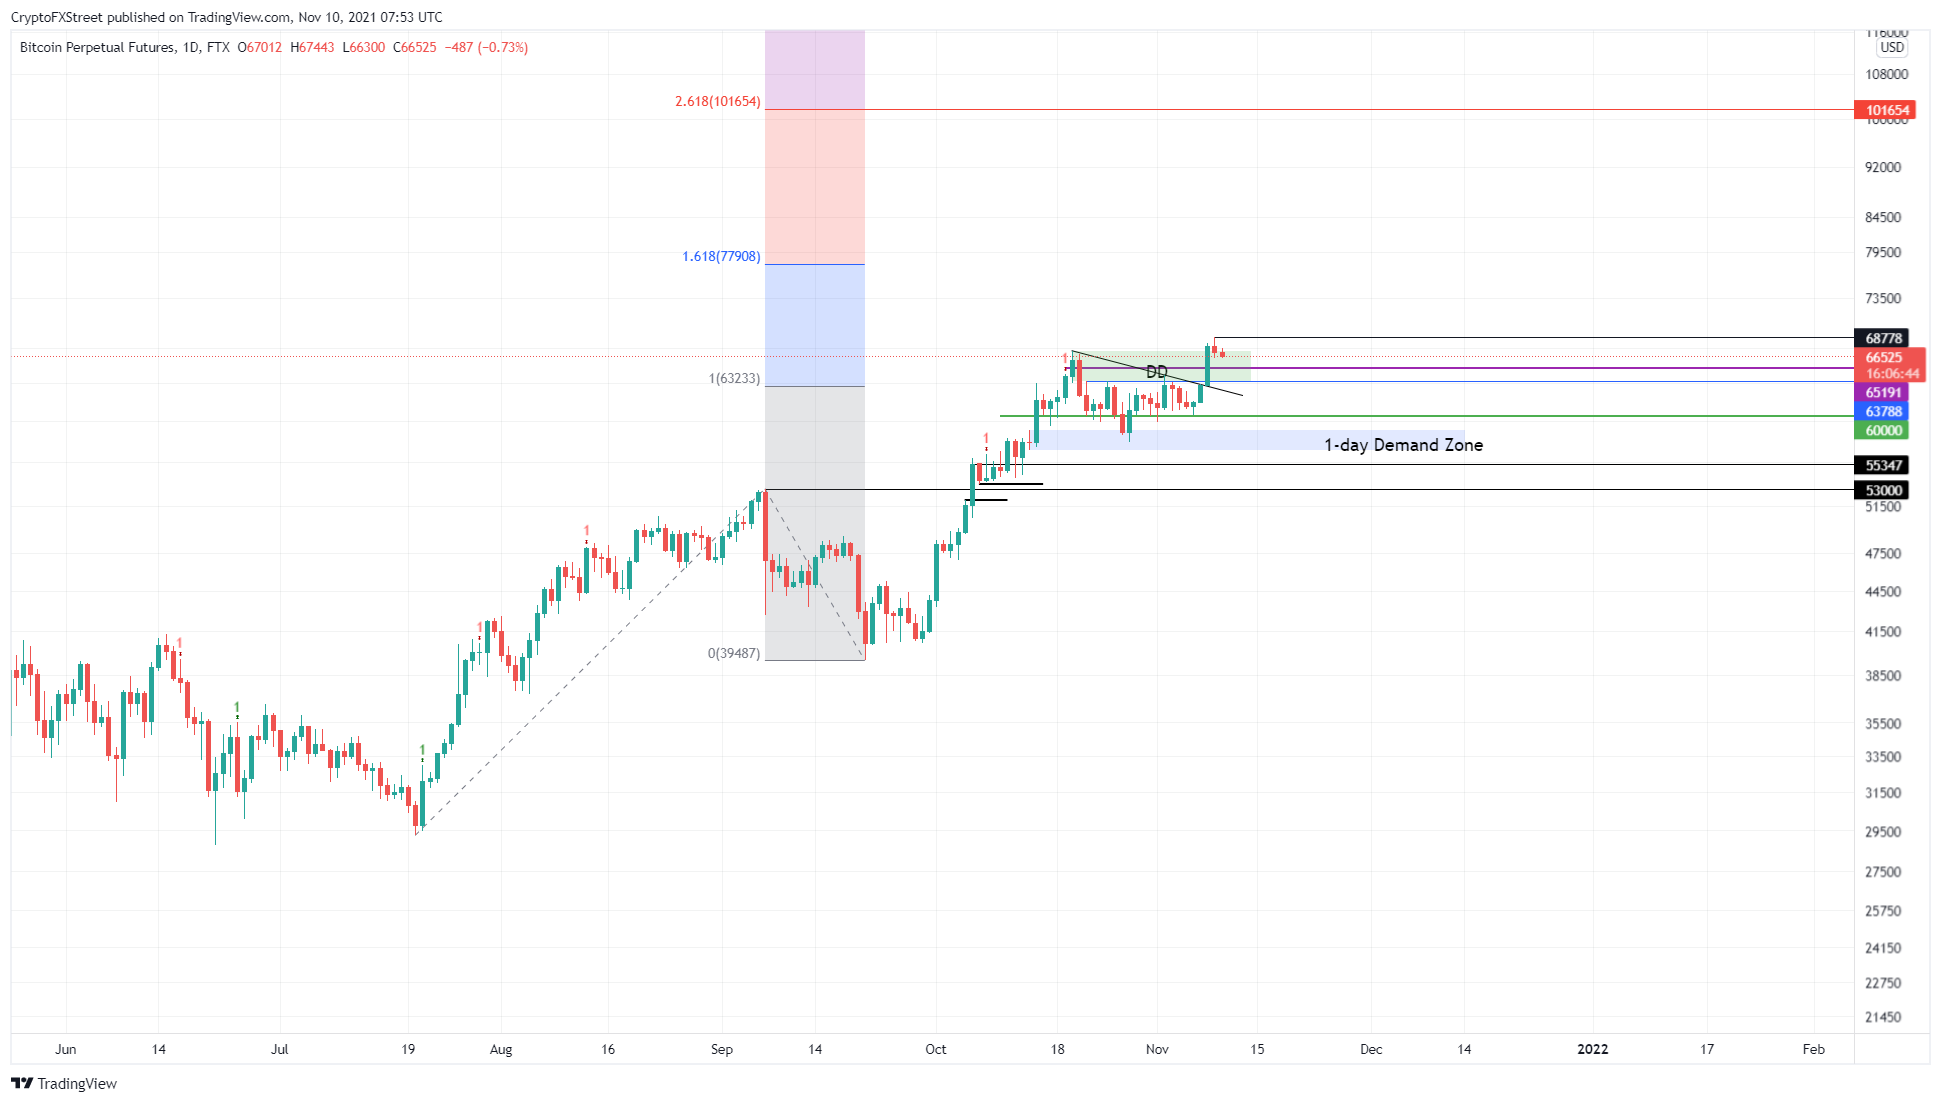
BTC/USD 1-day chart
On the other hand, if Bitcoin price fails to close above $67,162 but instead produces a daily close below $63,805, it will indicate that the buyers have disappeared. In this scenario, BTC would revisit the immediate support level at $65,000 or the $60,000 barrier in dire cases, where the buyers can make a comeback.
Ethereum price continues to trend higher
Ethereum price is currently following the bellwether crypto’s footsteps as it retraces after setting up a new high at $4,849 on November 9. This downswing will likely find support around $4,609 or $4,387 before the uptrend resumes.
A potential increase in buying pressure will propel ETH to the $5,000 psychological barrier. In an optimistic scenario, this uptick could extend to $6,387, coinciding with the 161.8% Fibonacci extension level.
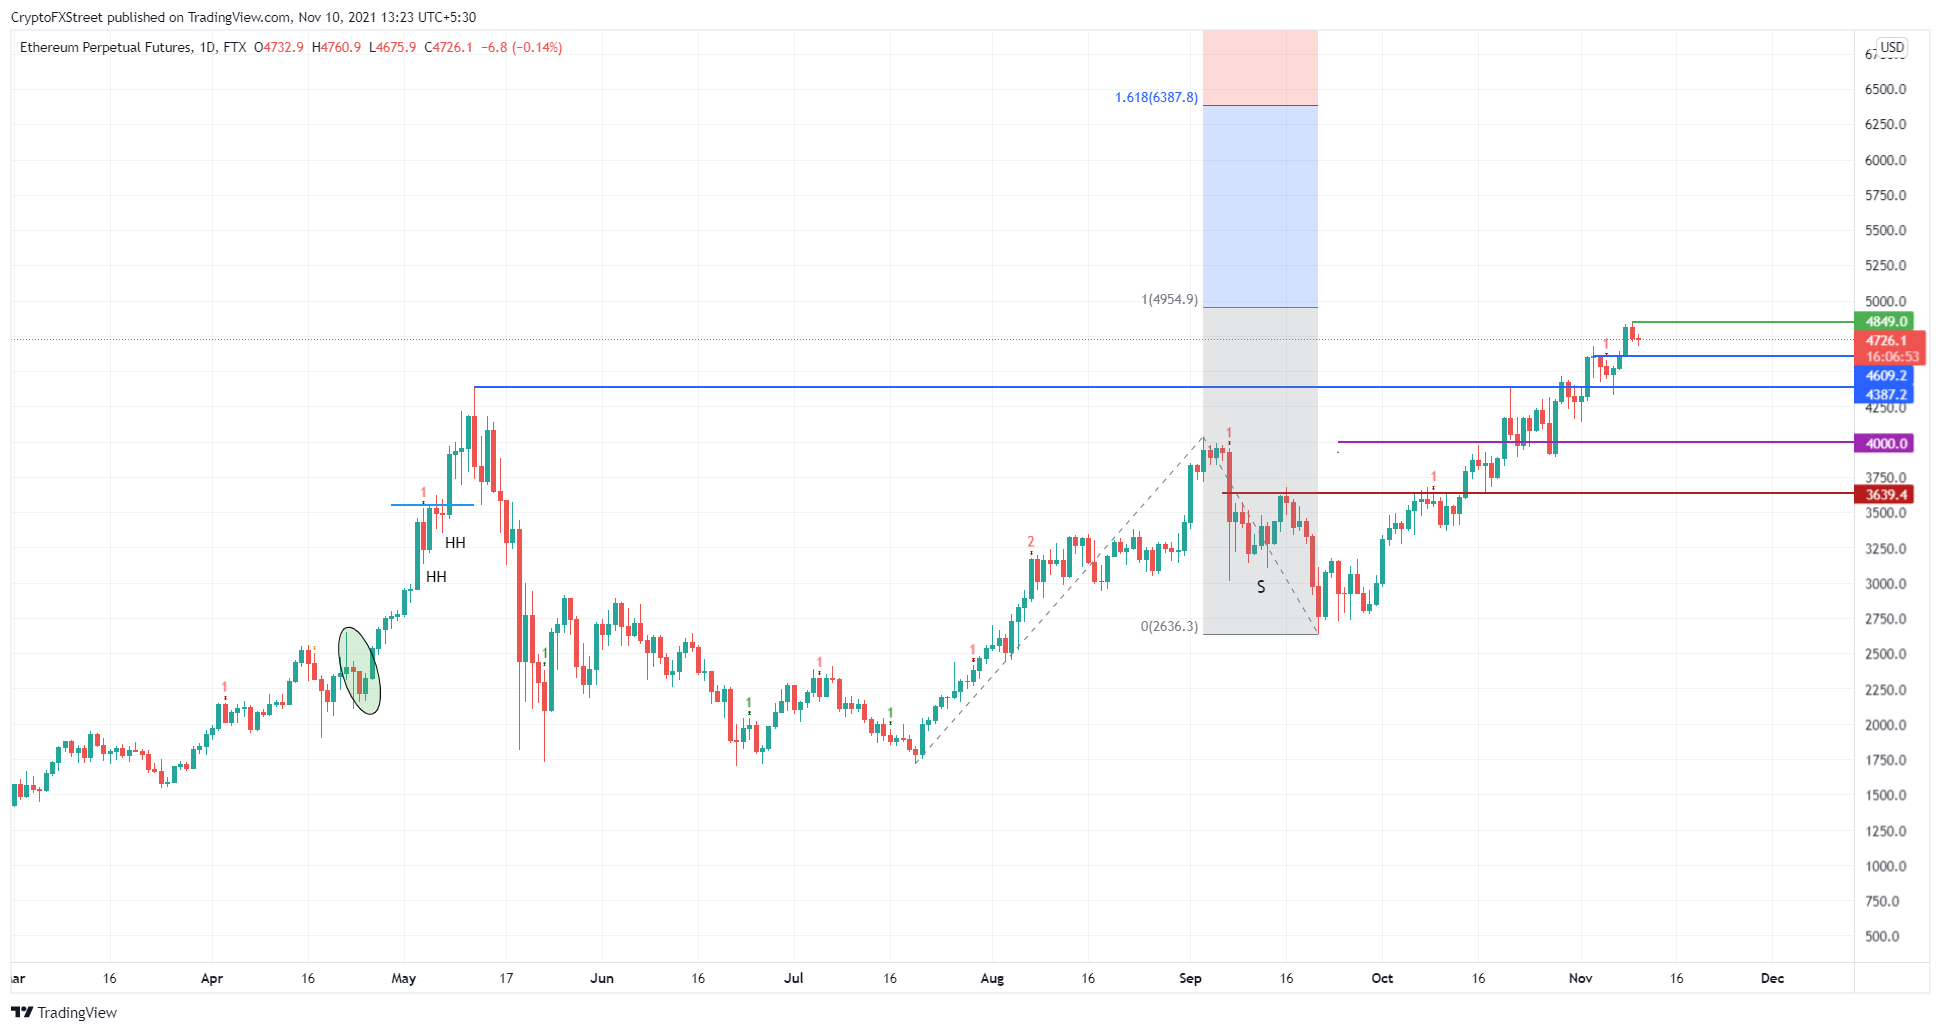
ETH/USD 1-day chart
Regardless of the bullish outlook, if Ethereum price falls below the $4,000 psychological level, it will revisit the stable support level at $3,600. While this move does not invalidate the bullish thesis, it will, however, delay the upswing.
Ripple price finds respite before another leg-up
Ripple price is unlike Bitcoin or Ethereum as it faces a resistance area that ranges from $1.31 to $1.41. This supply zone is crucial and stands in the way of XRP’s growth. Although XRP price started its ascent on November 3 when it broke out of a symmetrical triangle, it needs to produce a daily close above $1.41 to confirm a move to $1.97 or roughly $2.
While the conservative target for the technical formation forecasts $2 as likely, an increase in buying pressure could lead to an overshoot, tagging the 261.8% Fibonacci extension level at $2.32. In this situation, Ripple price could extend the ascent and make a run at the all-time high, resting around $3.31.
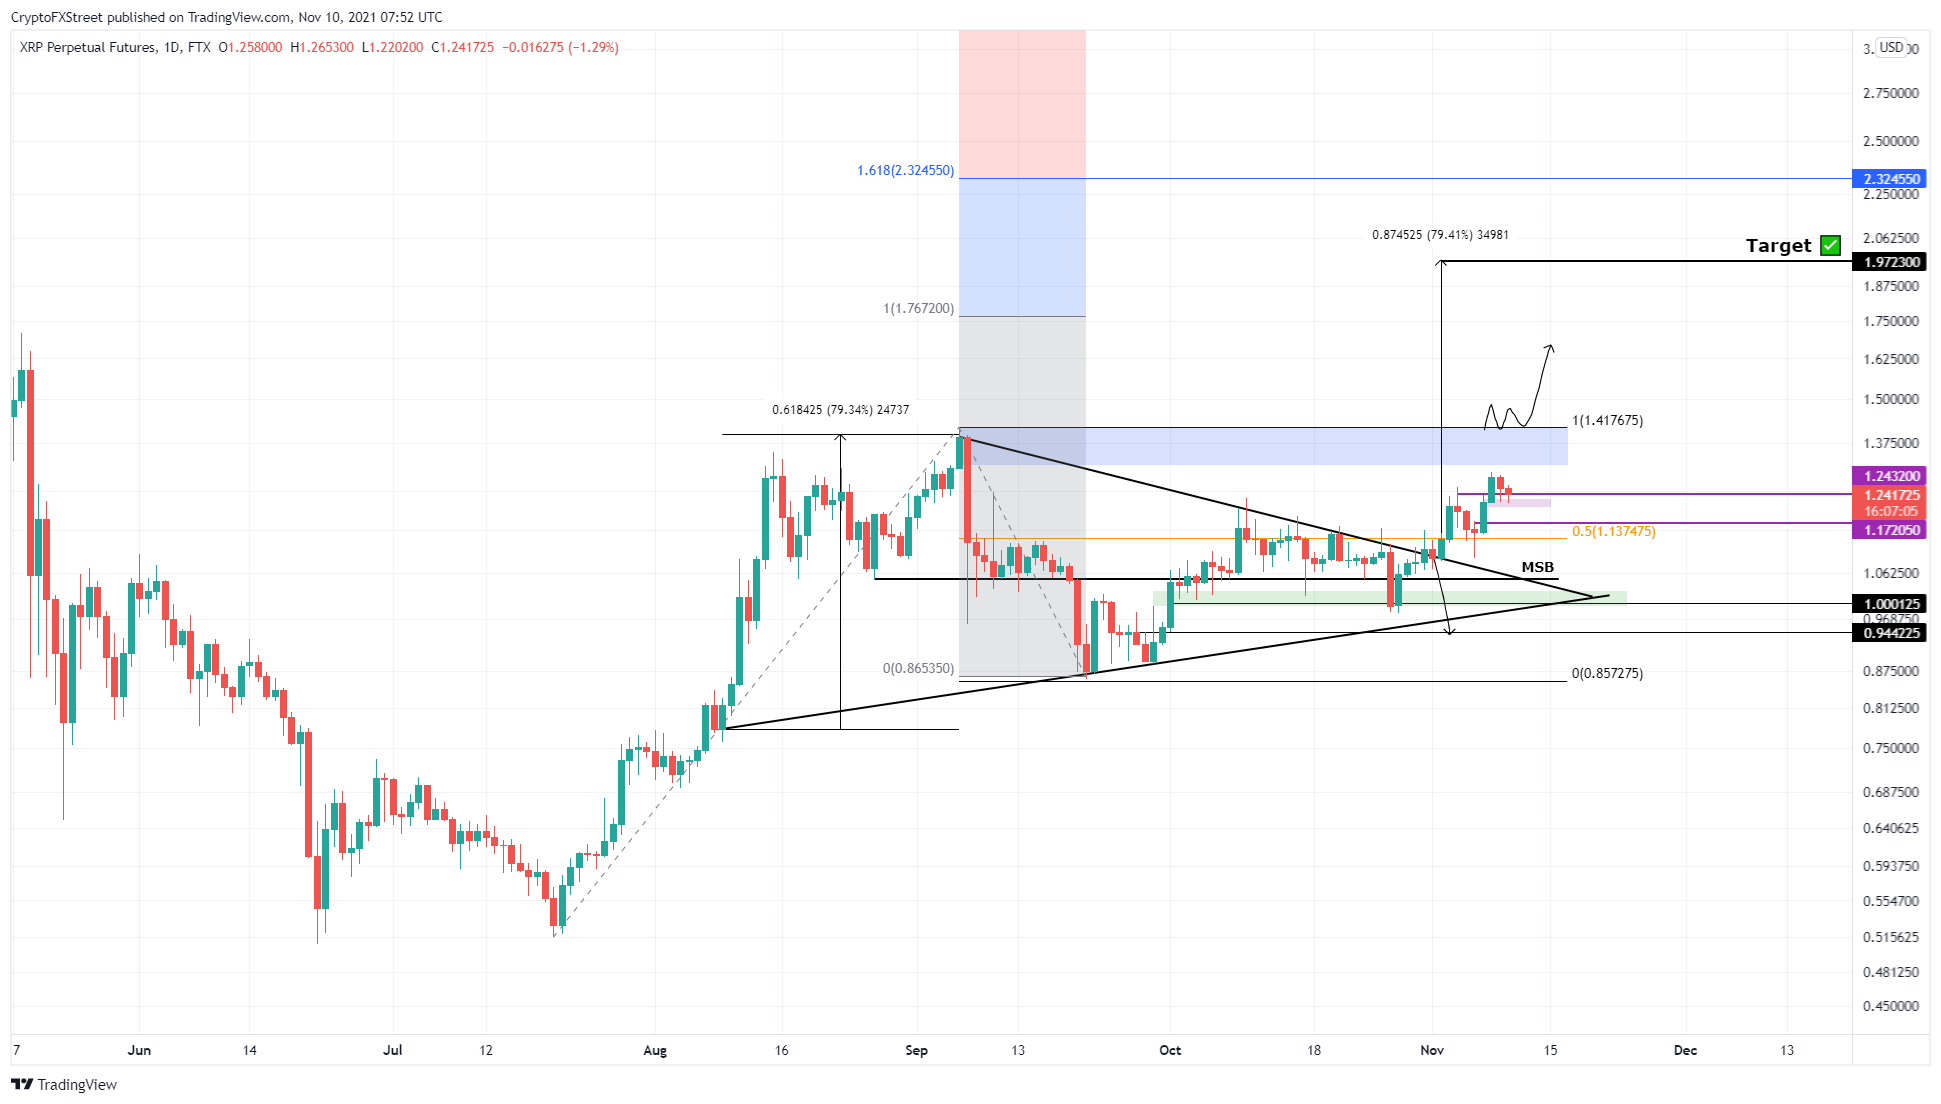
XRP/USD 1-day chart
While things are not as easy for Ripple price compared to BTC and ETH, a failure to close above $1.41 will further exaggerate it. This move could result in a correction retesting the $1.17 support floor or the 50% Fibonacci retracement level at $1.13. Here, XRP buyers can give the bull rally another go.
Author

Akash Girimath
FXStreet
Akash Girimath is a Mechanical Engineer interested in the chaos of the financial markets. Trying to make sense of this convoluted yet fascinating space, he switched his engineering job to become a crypto reporter and analyst.



