• XRP price is preparing for a 40% ascent if it is able to slice through and print a daily close above $1.27.
  • The last hurdle for Ripple is the resistance trend line that has barred the token from recording a higher high since mid-April.
  • However, a technical indicator suggests that XRP price may find its last obstacle challenging as it forms a top signal. 

XRP price has been consolidating for over six months and is now on the edge of a 39% ascent as it nears a critical resistance level. If Ripple manages to slice above its last obstacle, a climb toward $1.77 is on the radar. 

XRP price faced with stiff hurdle

XRP price appears ready for a massive breakout as Ripple has tagged the upper boundary of the prevailing symmetrical triangle pattern on the daily chart. The governing technical pattern suggests a bullish target of a 39% climb toward $1.77 if the cross-border remittance token can print a daily close above $1.27.

Adding credence to the bullish outlook is the Arms Index (TRIN), which gauges overall market sentiment, suggesting slightly more buyers than sellers in the market. 

The topside trend line of the symmetrical triangle has been acting as heavy resistance for XRP price, as Ripple was unable to slice above this trend line since April 16. Breaking above $1.27 could mean a massive move for the token toward the upside, fueled by bullish momentum.

However, if XRP price fails to slice and close above $1.27, Ripple could continue consolidating as it falls back within the prevailing chart pattern, trending sideways until further intentions are revealed.

XRPUSDT

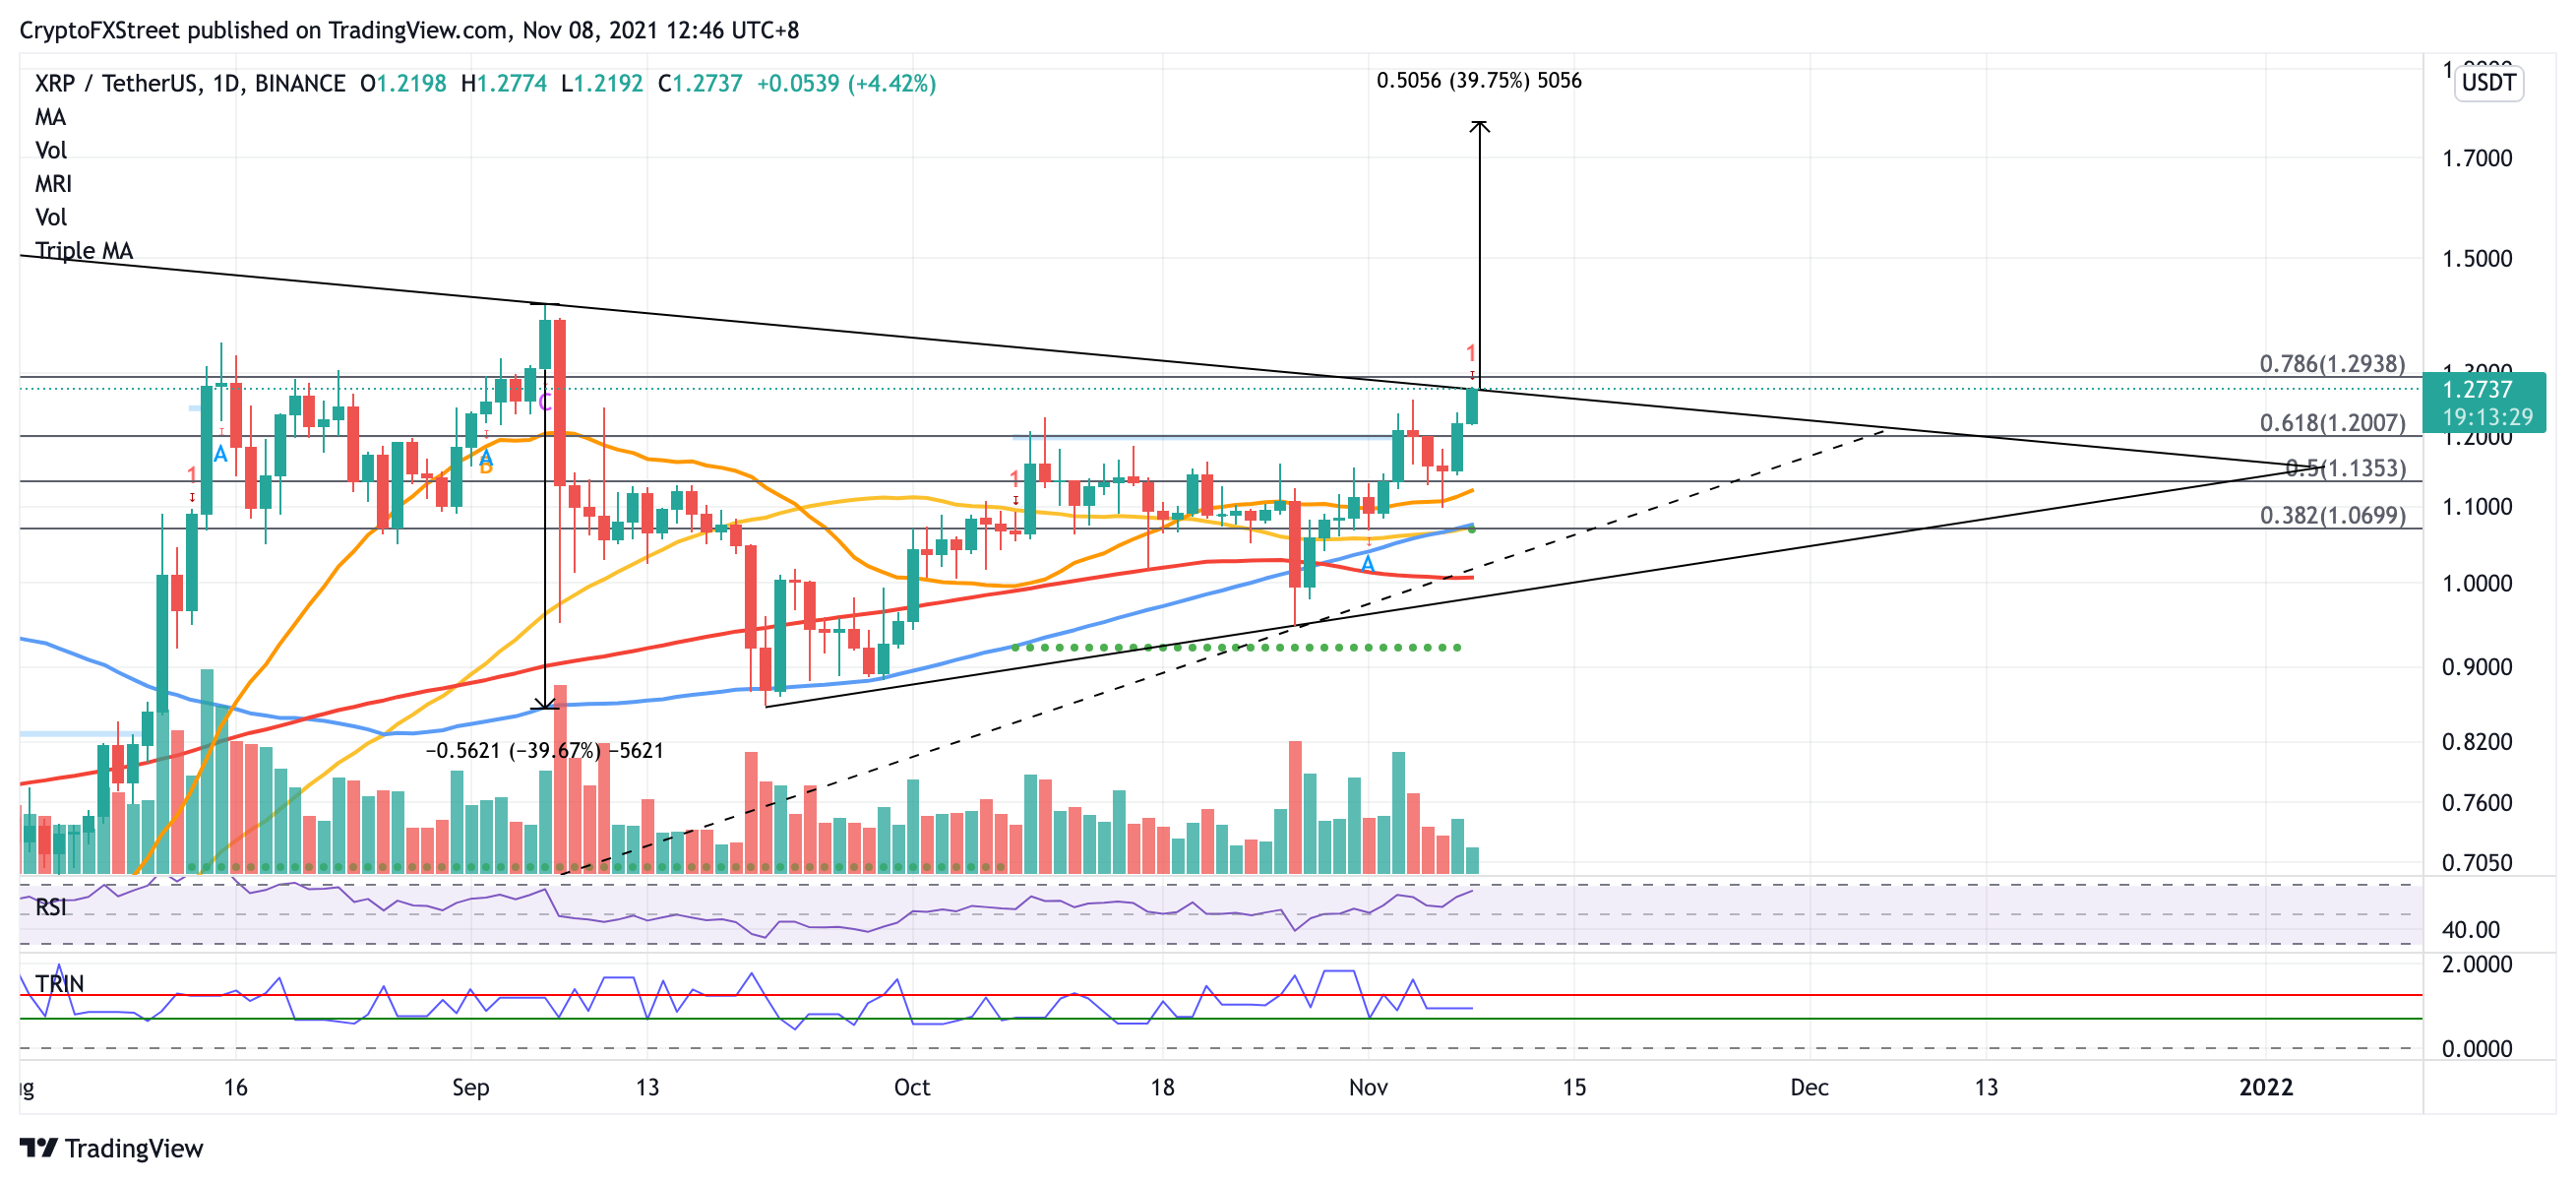
XRP/USDT daily chart

The first line of defense for XRP price is at the 61.8% Fibonacci retracement level at $1.20, then at the 50% Fibonacci retracement level at $1.13. Additional support for Ripple may emerge at the 21-day Simple Moving Average (SMA) at $1.12.

The strongest foothold for XRP price if selling pressure continues to increase is at $1.06, where the 38.2% Fibonacci retracement level, 50-day and 100-day SMAs and the support line given by the Momentum Reversal Indicator (MRI) intersect. 

Investors should note that the MRI has also flashed a warning sign, suggesting a top signal that indicates XRP price could reverse and continue to consolidate. Any additional increase in bearish momentum could send Ripple down toward the 200-day SMA at $1, sitting near the multi-month support trend line.


Note: All information on this page is subject to change. The use of this website constitutes acceptance of our user agreement. Please read our privacy policy and legal disclaimer. Opinions expressed at FXstreet.com are those of the individual authors and do not necessarily represent the opinion of FXstreet.com or its management. Risk Disclosure: Trading foreign exchange on margin carries a high level of risk, and may not be suitable for all investors. The high degree of leverage can work against you as well as for you. Before deciding to invest in foreign exchange you should carefully consider your investment objectives, level of experience, and risk appetite. The possibility exists that you could sustain a loss of some or all of your initial investment and therefore you should not invest money that you cannot afford to lose. You should be aware of all the risks associated with foreign exchange trading, and seek advice from an independent financial advisor if you have any doubts.

Join Telegram

Recommended content


Recommended Content

Editors’ Picks

Ripple wipes out weekly gains, experts comment on role of Ripple stablecoin

Ripple wipes out weekly gains, experts comment on role of Ripple stablecoin

Ripple declined to $0.52 on Thursday, erasing all gains registered earlier this week. Ripple SVP Eric van Miltenburg’s comments on the firm’s stablecoin, and how it is expected to benefit the XRP Ledger and native token XRP have raised concerns among crypto experts. 

More Ripple News

Hedera HBAR slips nearly 10% after air is cleared on mistaken link with giant BlackRock

Hedera HBAR slips nearly 10% after air is cleared on mistaken link with giant BlackRock

HBAR price is down nearly 10% on Thursday, partly erasing gains inspired by the misinterpreted link with BlackRock. Despite the recent correction, Hedera’s price is up 44% in the past seven days.

More Hedera News

The reason behind Bonk’s 105% rise and if you should buy now Premium

The reason behind Bonk’s 105% rise and if you should buy now

Bonk price has shot up 105% in the past five weeks. A retracement into $0.0000216 or the $0.0000152 to $0.0000186 imbalance would be a good buying opportunity. Patient investors can expect double-digit gains from BONK that could extend up to 70%.

More Cryptocurrencies News

Injective price weakness persists despite over 5.9 million INJ tokens burned

Injective price weakness persists despite over 5.9 million INJ tokens burned

Injective price is trading with a bearish bias, stuck in the lower section of the market range. The bearish outlook abounds despite the network's deflationary efforts to pump the price. Coupled with broader market gloom, INJ token’s doomed days may not be over yet.

More Injective News

Bitcoin: BTC post-halving rally could be partially priced in Premium

Bitcoin: BTC post-halving rally could be partially priced in

Bitcoin (BTC) price briefly slipped below the $60,000 level for the last three days, attracting buyers in this area as the fourth BTC halving is due in a few hours. Is the halving priced in for Bitcoin? Or will the pioneer crypto note more gains in the coming days? 

Read full analysis

BTC

ETH

XRP