Hyperliquid Price Forecast: HYPE dips below $25 as bearish on-chain and derivatives signals intensify
- Hyperliquid price hovers around $24.51 on Thursday after sliding nearly 15% so far this week.
- On-chain and derivatives data paint a bearish picture, with HYPE’s social dominance and open interest declining.
- The technical outlook suggests further downside, as momentum indicators show bearish pressure gaining traction.

Hyperliquid (HYPE) price steadies at $24.51 at the time of writing on Thursday after correcting nearly 15% so far this week. The price pullback is further strengthening with HYPE’s falling social dominance and Open Interest (OI). On the technical side, deteriorating momentum indicators suggest further downside.
HYPE’s on-chain and derivative data show bearish bias
Santiment’s Social Dominance metric for Hyperliquid supports a bearish outlook. The index measures the share of HYPE-related discussions across the cryptocurrency media. It has been in a downward trend since the end of September and fell again in mid-December, reaching 0.298% on Thursday. This fall indicates fading market interest and weakening sentiment among HYPE investors.
 [10-1766038630871-1766038630873.28.32, 18 Dec, 2025].png)
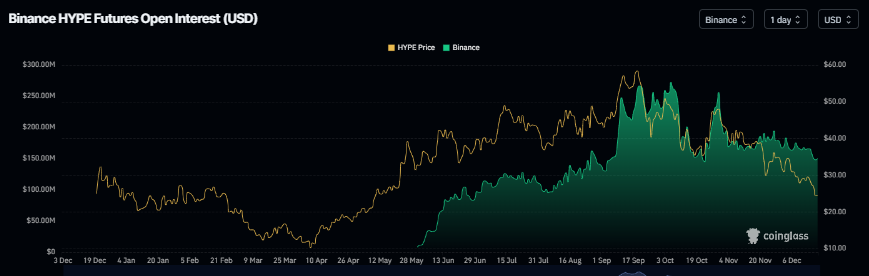
The bearish price action is further supported by HYPE’s declining open interest on Binance, which stood at $150.16 million on Thursday, the lowest level since the end of October. This declining open interest indicates that traders are closing positions and speculative interest is fading, rather than fresh buying stepping in.
Hyperliquid Price Forecast: HYPE momentum indicators show bearish signs
Hyperliquid price was rejected at the daily support level at $30 on Sunday, declined 17.32% by Wednesday, and closed below the weekly support at $27.49. As of Thursday, HYPE is trading at around $24.51.
If HYPE continues its downward trend, it could extend the decline toward the October 10 low of $20.20
The Relative Strength Index (RSI) on the daily chart reads 28, slipping below the oversold conditions, indicating strong bearish momentum. The Moving Average Convergence Divergence (MACD) also showed a bearish crossover last week, which remains intact, further supporting the bearish outlook.
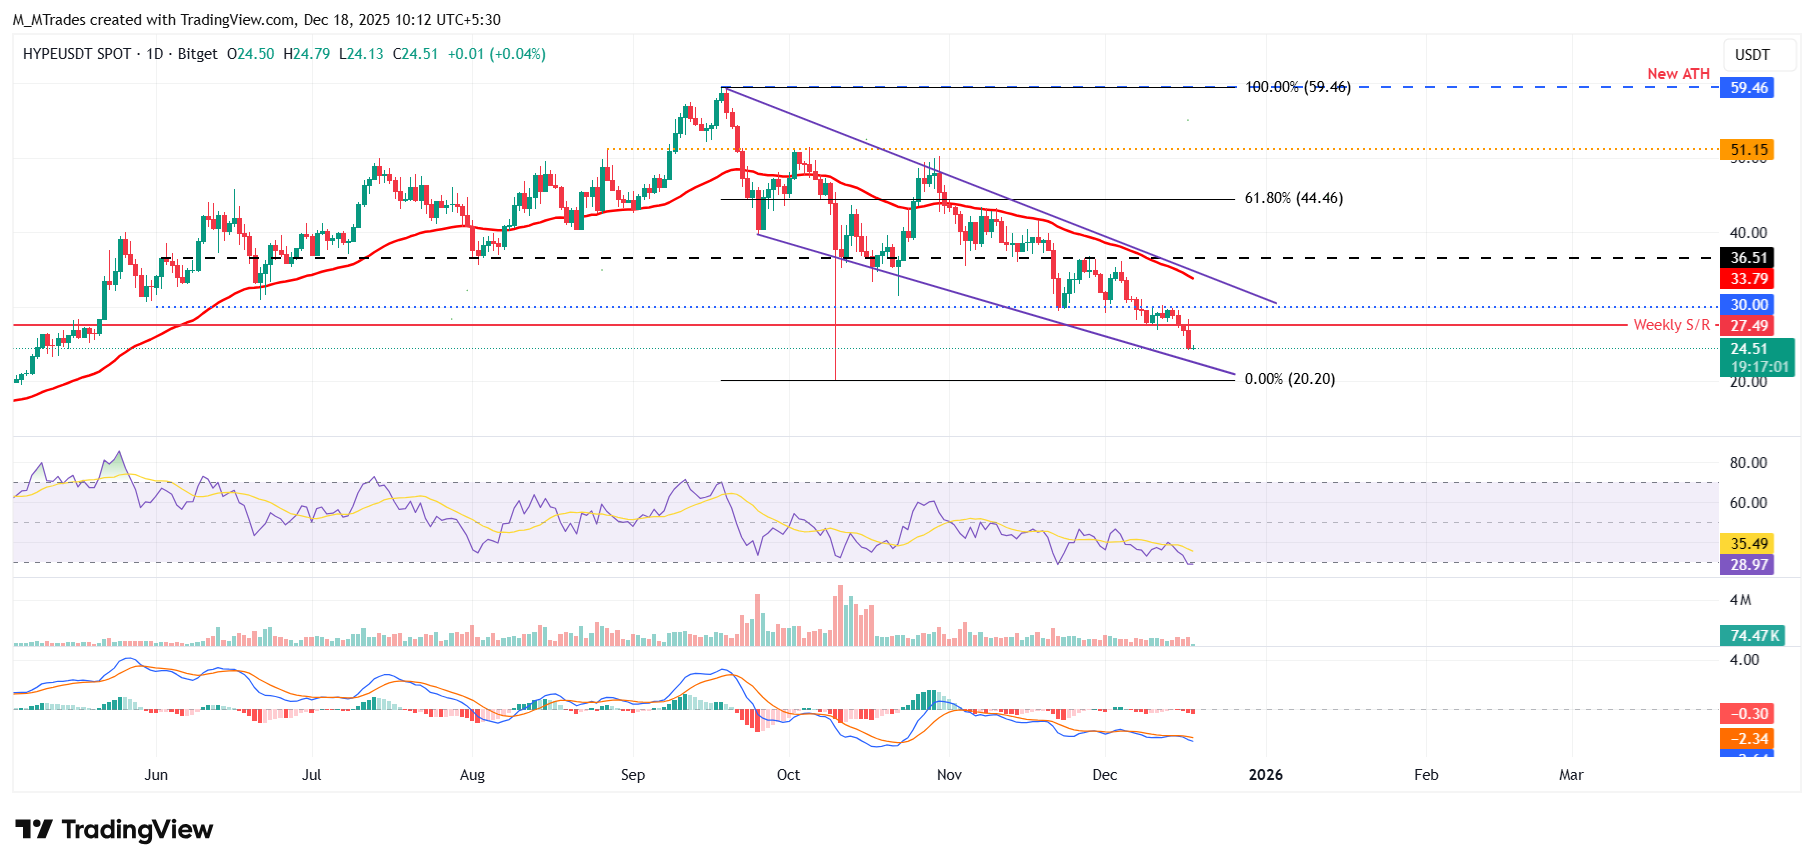
On the other hand, if HYPE recovers, it could extend the advance toward the weekly resistance level at $27.49.
Author

Manish Chhetri
FXStreet
Manish Chhetri is a crypto specialist with over four years of experience in the cryptocurrency industry.