Top 3 Price Prediction Bitcoin, Ethereum, Ripple: Cryptocurrency markets make comeback as BTC bulls resurface
- Bitcoin price taking a second attempt at an upswing to retest $42,451.
- Ethereum price has flipped a crucial resistance level at $2,640 into a support barrier.
- Ripple price lacks momentum and is close to testing a crucial demand zone extending from $0.623 to $0.671.

Bitcoin price is taking a break from retracing as it rallied on August 4. If the upswing continues, it is likely to retest a crucial resistance level.
While Ethereum price is following in BTC’s footsteps, Ripple is consolidating and showing no strength.
Bitcoin price takes a second jab
Bitcoin price put an end to its 11% retracement as it rallied roughly 6% and is currently attempting to retest the range high at $42,451. However, the ascent to do so is sprinkled with resistance levels at $40,550 and $41,330.
Breaching through these barriers is crucial to retest $42,451 and to scale to $46,000. Therefore, investors need to keep a close eye on this climb and its reaction to the immediate supply barriers.
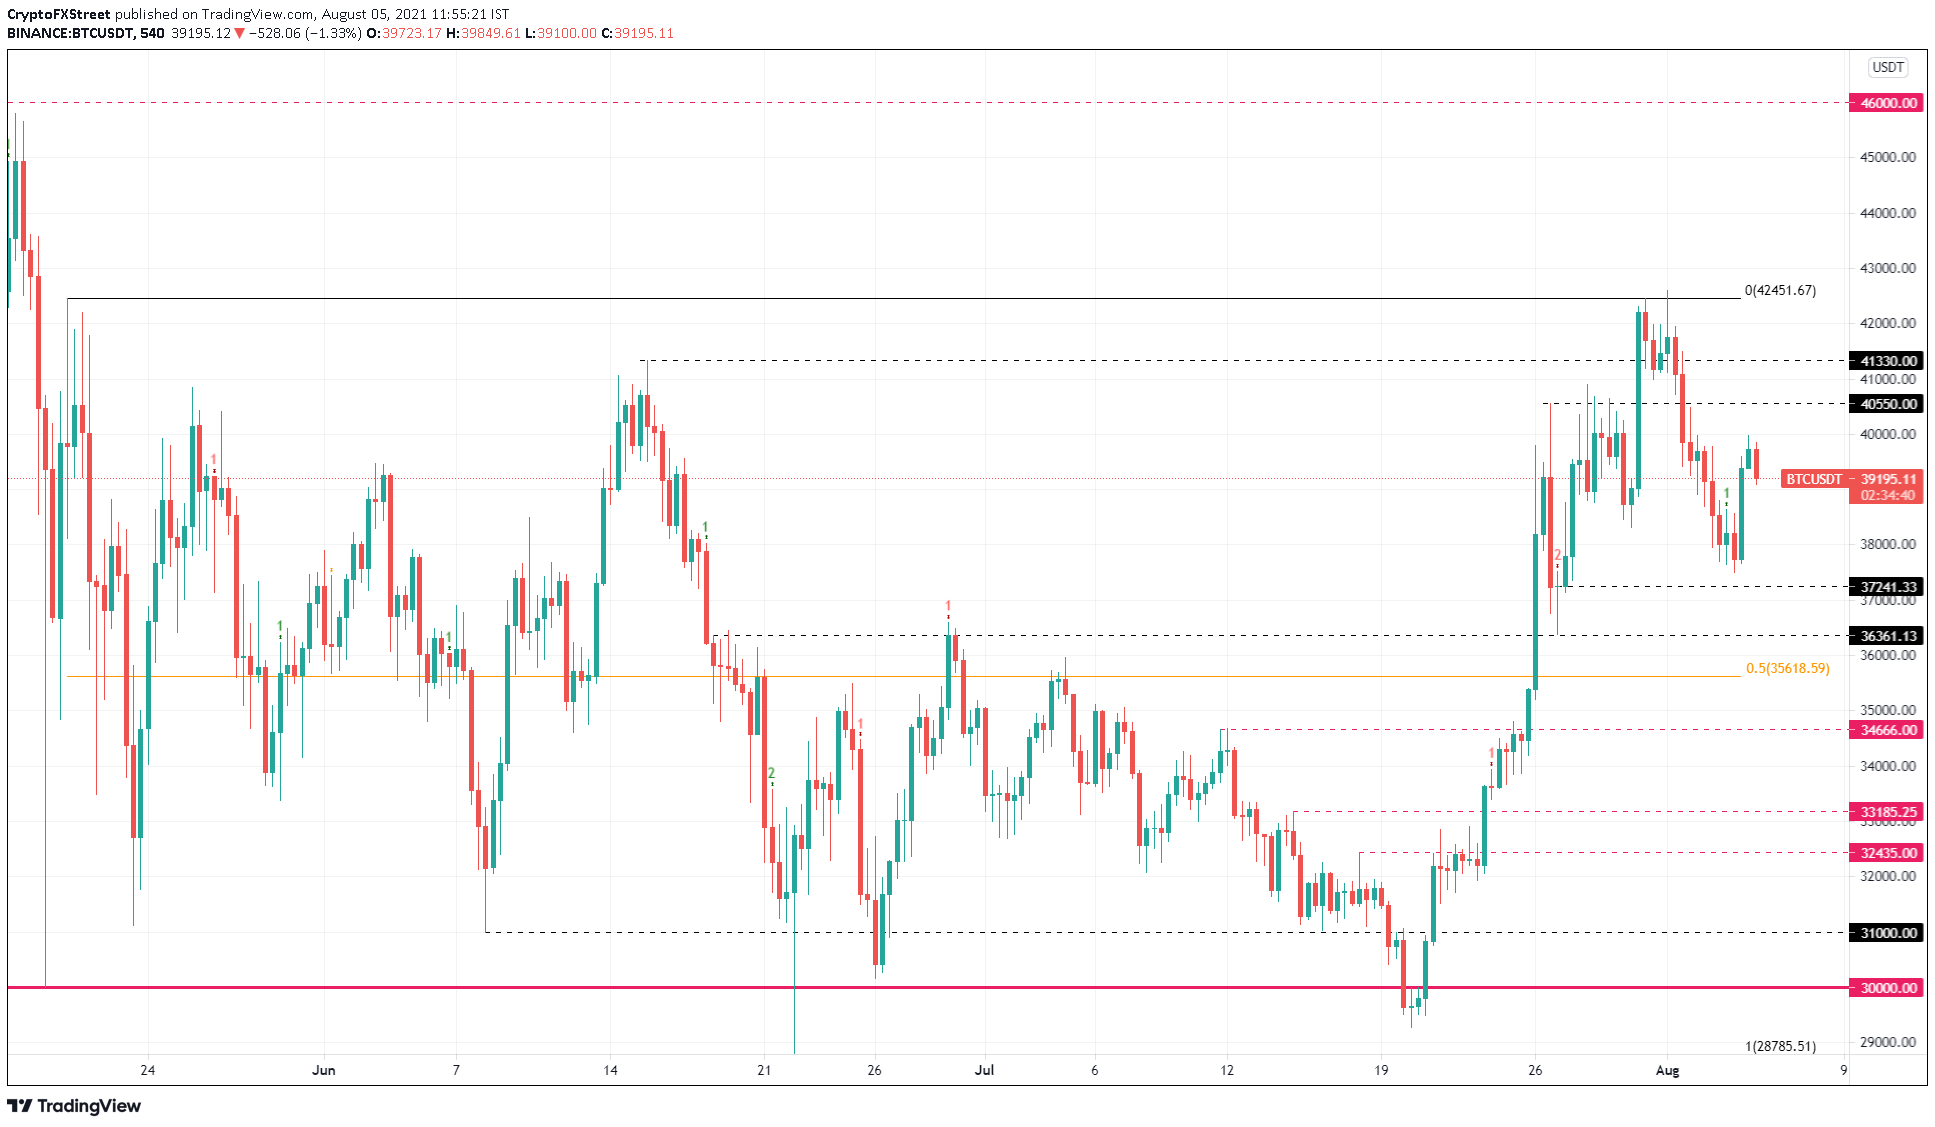
BTC/USDT 9-hour chart
On the other hand, if the upswing fails to hold up, it might slice through the $37,241 support level. Breaching this barrier will invalidate the bullish thesis and trigger a correction to $36,361.
Ethereum price shatters barriers
Ethereum price follows BTC’s footsteps but takes it up a notch. The recent run-up for ETH after the retracement has pushed it above the $2,640 resistance level. This move opened up the path toward the range high at $2,895 and the liquidity resting above it up to $3,017.
Clearing this area might propel Ethereum price to $3,240.
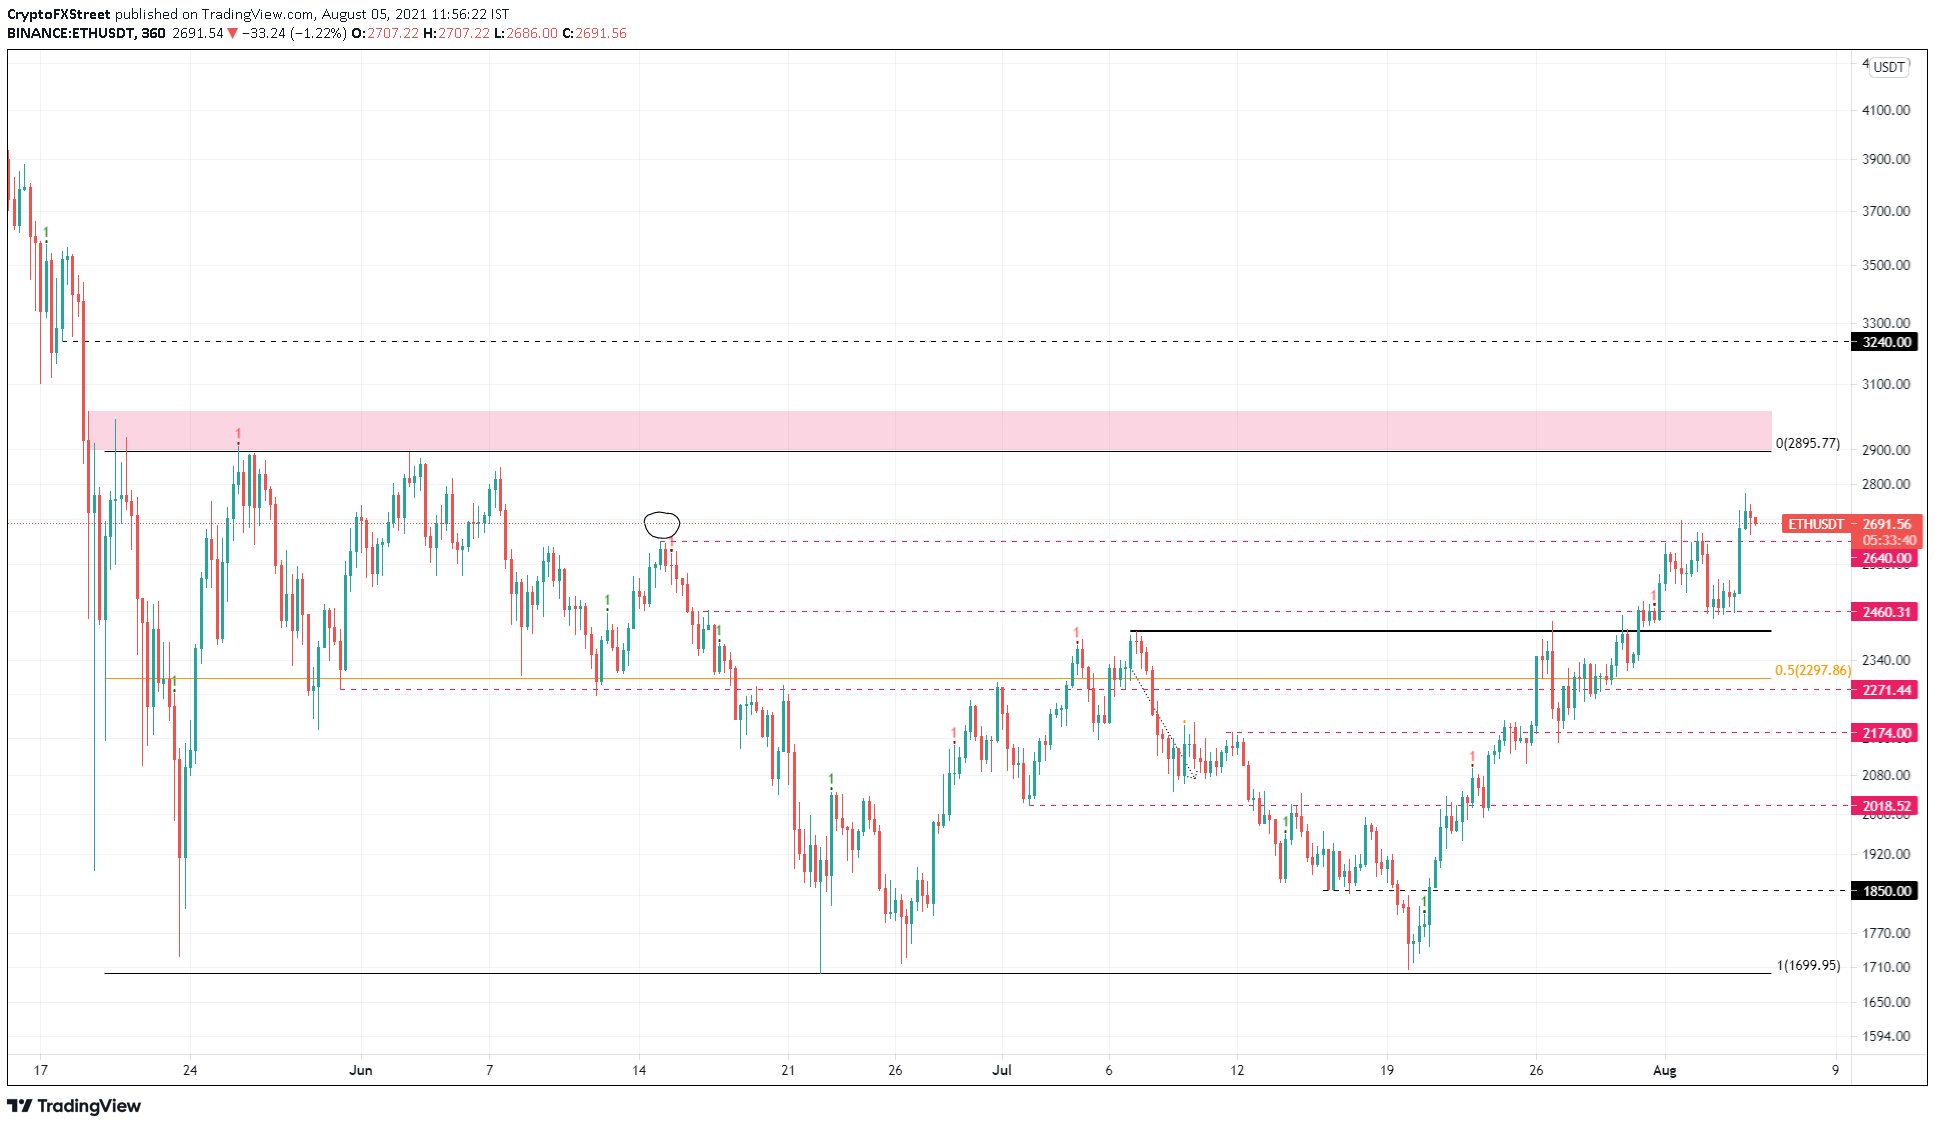
ETH/USDT 6-hour chart
Regardless of the bullish outlook, failing to hold above $2,460 will indicate weakness among buyers. In some cases, this weakness could translate into a retracement to $2,460. A breakdown of this barrier will invalidate the bullish thesis and, in some cases, catalyze a sell-off to $2,297.
Ripple price falters as altcoins rally
Ripple price has failed to muster up buying pressure since it tested the range high at $0.785. This move has resulted in a slow and steady downtrend floating above the support level at $0.688.
While a retest of this is likely, a reversal is more probable to occur near the demand zone extending from $0.624 to $0.671.
An impulsive wave that originates here is likely to shatter through the range high at $0.785 and retest these levels – $0.827, $0.91 and $1.
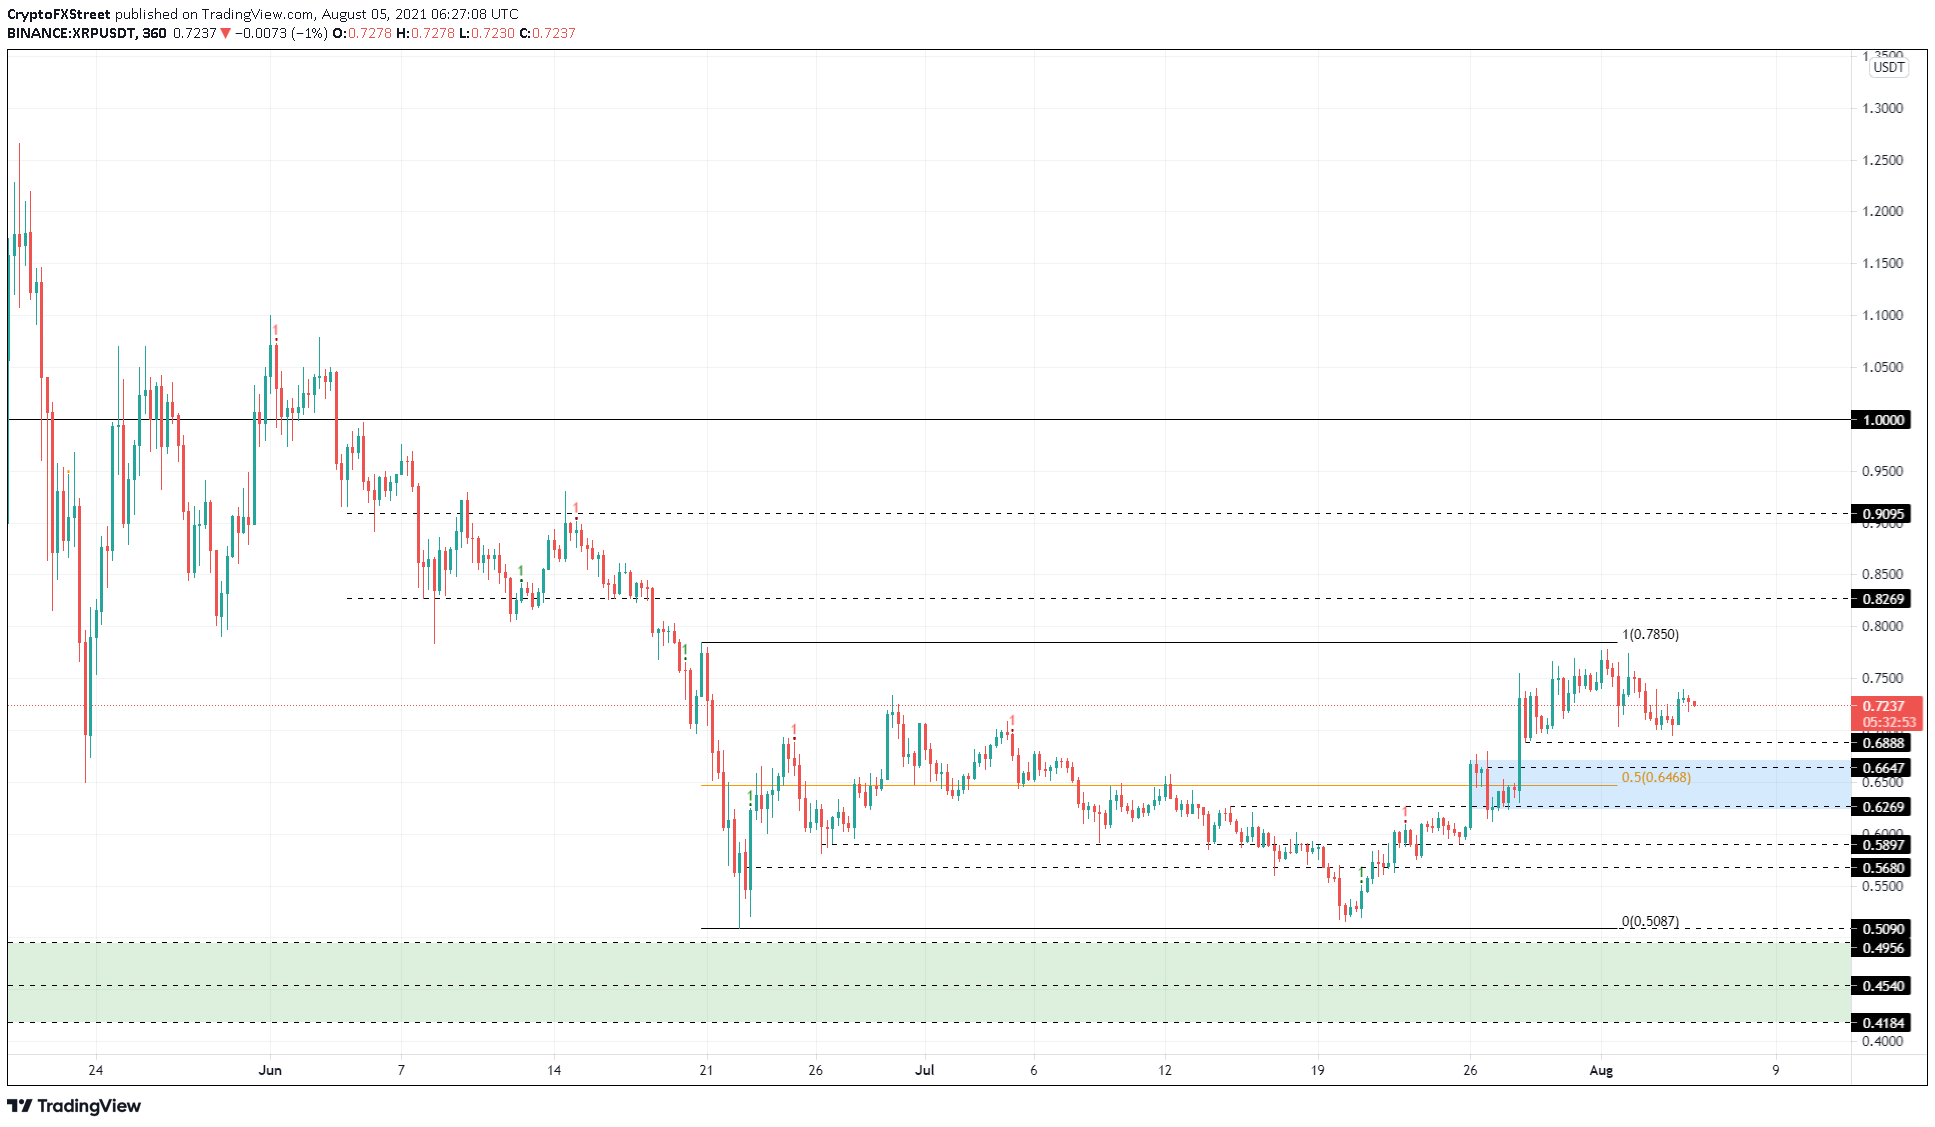
XRP/USDT 4-hour chart
While things seem to be going slow for XRP price, a breakout above $0.785 will change things for the better. However, the opposite could occur if Ripple bears slice through $0.624. This development will invalidate the bullish outlook and potentially trigger a downswing to $0.590.
Author

Akash Girimath
FXStreet
Akash Girimath is a Mechanical Engineer interested in the chaos of the financial markets. Trying to make sense of this convoluted yet fascinating space, he switched his engineering job to become a crypto reporter and analyst.


