Top 3 Price Prediction Bitcoin, Ethereum, Ripple: Could BTC reach its all-time high of $73,777?
- Bitcoin price is approaching the $70,000 resistance, and a firm close above this mark could trigger a rally to retest its ATH.
- Ethereum price is nearing its descending trendline, and a break and close above it signal a rally ahead.
- Ripple price consolidates around its 200-day EMA at $0.552; a close above suggests a possible recovery.

Bitcoin (BTC) is approaching the resistance level of around $70,000. A firm close above this mark could trigger a rally to retest its all-time high. Ethereum (ETH) is nearing its descending trendline, with a break and close above signaling a potential rally. Ripple (XRP) is also consolidating around its key level, and a close above suggests a possible recovery.
Bitcoin price could surge to retest ATH if it closes above $70,000
Bitcoin price is approaching its July 29 high of $70,079 on Monday after breaking above the psychological level of $66,000 on October 15 and rising 2.7%.
If BTC breaks and closes above $70,079, it could extend the rally to retest its all-time high of $73,777.
The Relative Strength Index (RSI) indicator on the daily chart is trading at 69, nearing its overbought level of 70. If it enters the zone on a closing basis, traders will be advised not to add to their long positions because the chances of a pullback would increase. Another possibility, however, is that the rally continues, and the RSI stays in the overbought zone.
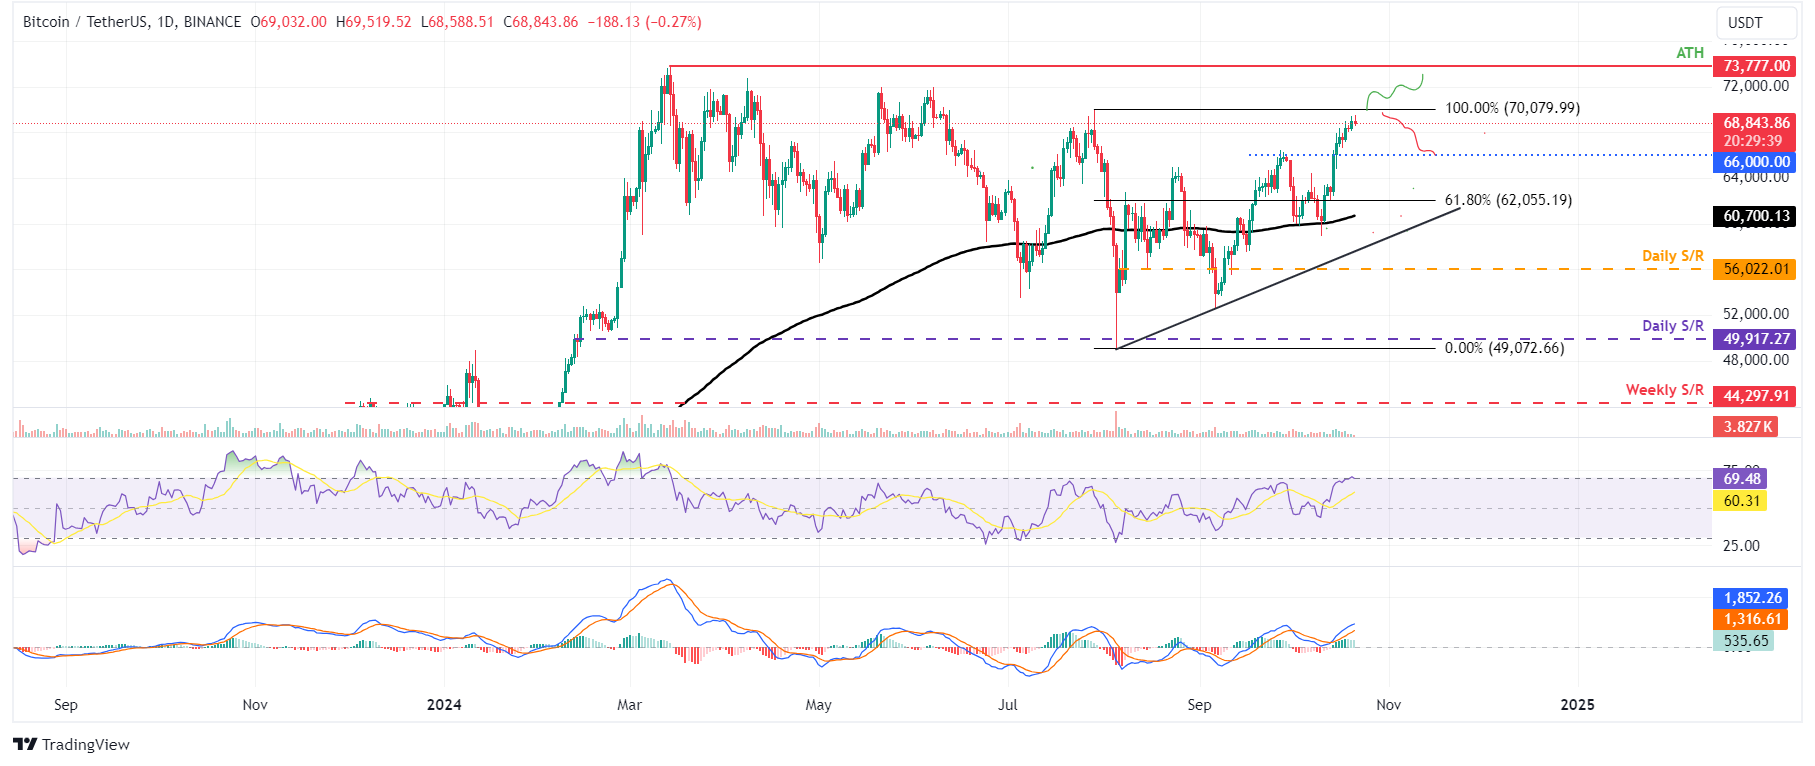
BTC/USDT daily chart
However, if BTC fails to break above the $70,079 level, it could decline and find support around the psychologically important $66,000 level.
Ethereum price is poised for a rally if it closes above its descending trendline
Ethereum price is nearing its descending trendline on Monday (drawn by joining multiple high levels from the end of May) after finding support around its 50-day Exponential Moving Average (EMA) of $2,564 on October 15.
If ETH breaks and closes above its descending trendline around $2,820, it could first rally to retest its daily resistance level at $2,927. A successful close above $2,927 could extend the rally to retest its weekly resistance at $3,236.
The RSI indicator on the daily chart is trading at 66, approaching its overbought level of 70. If it enters the zone on a closing basis, traders will be advised not to add to their long positions because the chances of a pullback would increase. Another possibility, however, is that the rally continues, and the RSI stays in the overbought zone.
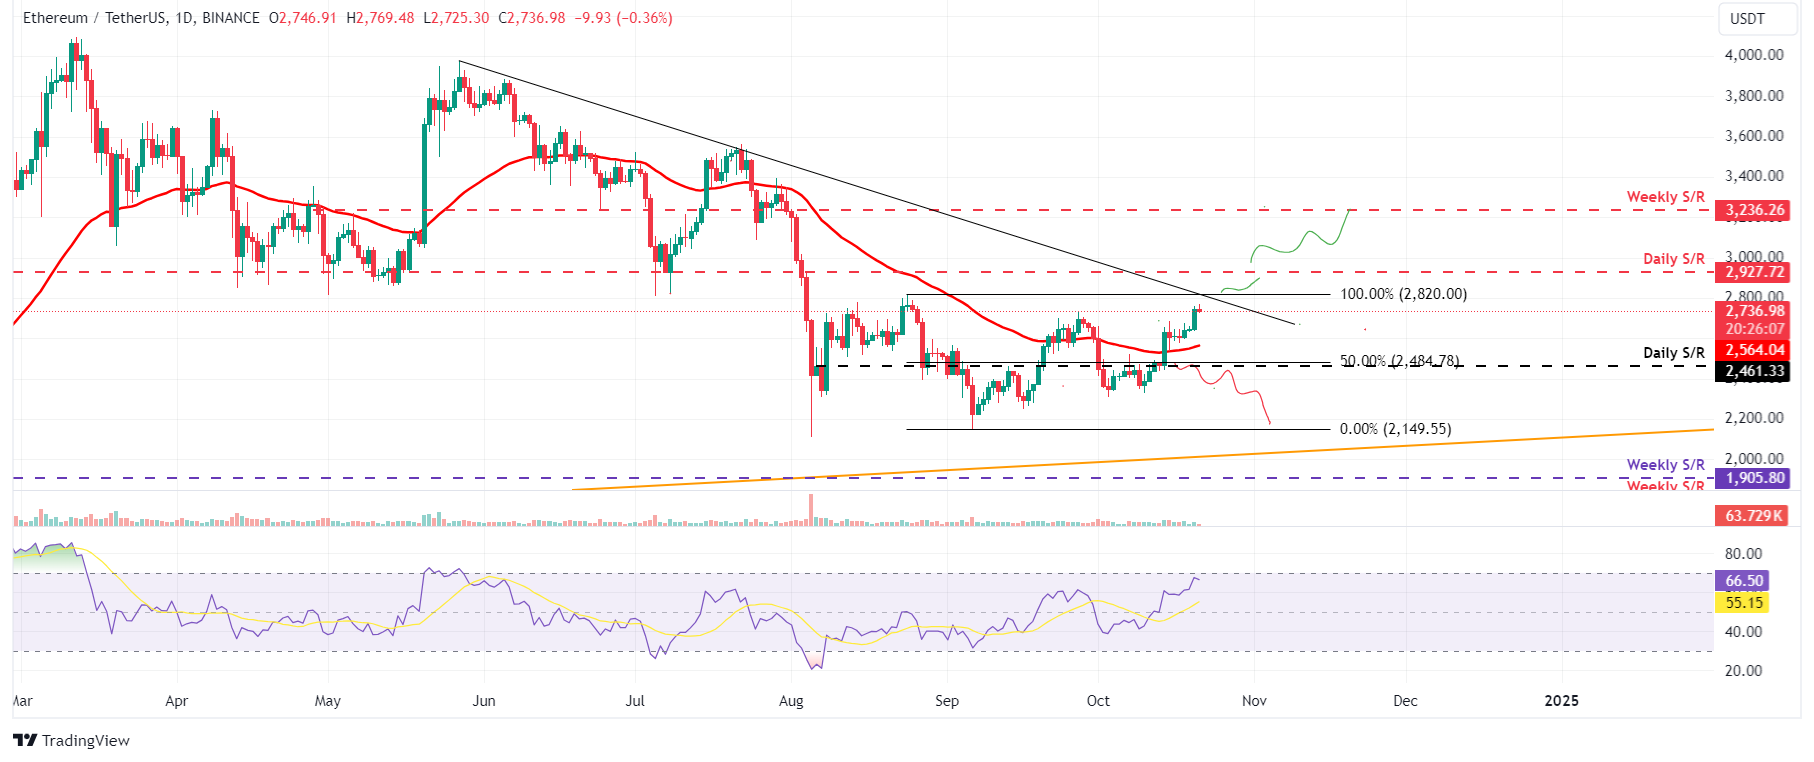
ETH/USDT daily chart
However, if ETH fails to close above the descending trendline, it could decline to retest its 50-EMA support at $2,564.
Ripple price could rally if it closes above its 200-day EMA
Ripple price has been consolidating around its 200-day EMA at $0.552 for the last week. As of Monday, it trades at around $0.547, nearing its 200-day EMA at $0.552.
If XRP breaks and closes above the 200-day EMA at $0.552, it could rally over 13% to retest its next daily resistance at $0.626.
The RSI on the daily chart trades at 48, nearing its neutral level of 50, suggesting indecisiveness among traders. For the bullish momentum to gain traction, the RSI must trade above its neutral level.
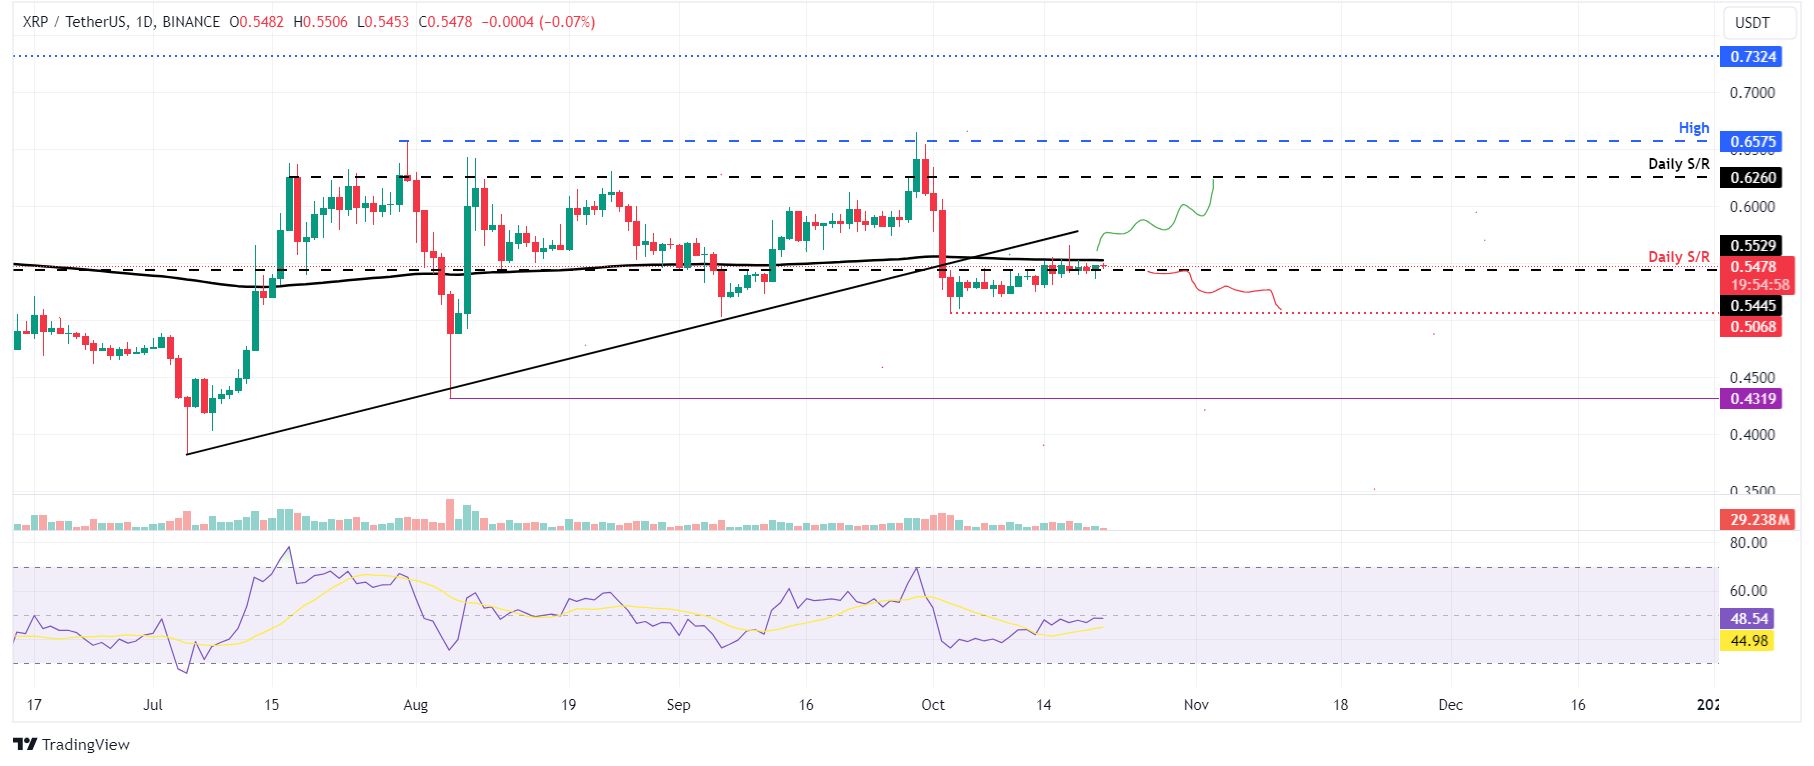
XRP/USDT daily chart
On the other hand, if the XRP price fails to close above the $0.552 level and closes below the daily resistance level at $0.544. This scenario could lead to a decline in the Ripple price to retest the October 3 low of $0.506.
Bitcoin, altcoins, stablecoins FAQs
Bitcoin is the largest cryptocurrency by market capitalization, a virtual currency designed to serve as money. This form of payment cannot be controlled by any one person, group, or entity, which eliminates the need for third-party participation during financial transactions.
Altcoins are any cryptocurrency apart from Bitcoin, but some also regard Ethereum as a non-altcoin because it is from these two cryptocurrencies that forking happens. If this is true, then Litecoin is the first altcoin, forked from the Bitcoin protocol and, therefore, an “improved” version of it.
Stablecoins are cryptocurrencies designed to have a stable price, with their value backed by a reserve of the asset it represents. To achieve this, the value of any one stablecoin is pegged to a commodity or financial instrument, such as the US Dollar (USD), with its supply regulated by an algorithm or demand. The main goal of stablecoins is to provide an on/off-ramp for investors willing to trade and invest in cryptocurrencies. Stablecoins also allow investors to store value since cryptocurrencies, in general, are subject to volatility.
Bitcoin dominance is the ratio of Bitcoin's market capitalization to the total market capitalization of all cryptocurrencies combined. It provides a clear picture of Bitcoin’s interest among investors. A high BTC dominance typically happens before and during a bull run, in which investors resort to investing in relatively stable and high market capitalization cryptocurrency like Bitcoin. A drop in BTC dominance usually means that investors are moving their capital and/or profits to altcoins in a quest for higher returns, which usually triggers an explosion of altcoin rallies.
Author

Manish Chhetri
FXStreet
Manish Chhetri is a crypto specialist with over four years of experience in the cryptocurrency industry.


