Top 3 Price Prediction Bitcoin, Ethereum, Ripple: BTC breaks all-time high of $73,777 as Trump takes the lead
- Bitcoin breaks above its all-time high of $73,777 on Wednesday as Donald Trump leads in the presidential election.
- Ethereum approaches the $2,485 resistance level; a firm close above could signal a possible upward momentum.
- Ripple price finds support around its $0.488 daily level, suggesting a recovery is on the cards.

Bitcoin (BTC) breaks above its all-time high of $73,777 on Wednesday, buoyed by Donald Trump's poll lead. At the same time, Ethereum (ETH) is nearing its key resistance level, with a strong close above it, potentially signaling upward momentum. Meanwhile, Ripple (XRP) finds support around its daily level, indicating the potential for a recovery.
Bitcoin eyes for new all-time high of $78,777
Bitcoin price faced rejection around its all-time high (ATH) of $73,777 on October 29 and declined 6.65% in the next six days. However, it found support around $67,000 on Monday and rose 2.24% until Tuesday. At the time of writing on Wednesday, it breaks above its ATH and trades around $73,900.
A successful daily close above its ATH of $73,777 could pave the way for BTC to target the 141.40% Fibonacci extension level (drawn from July’s high of $70,079 to August’s low of $49,072) at $78,777.
The Relative Strength Index (RSI) on the daily chart has bounced off from its neutral level of 50 and reads 67 as of Wednesday, indicating that the bullish momentum is gaining traction.
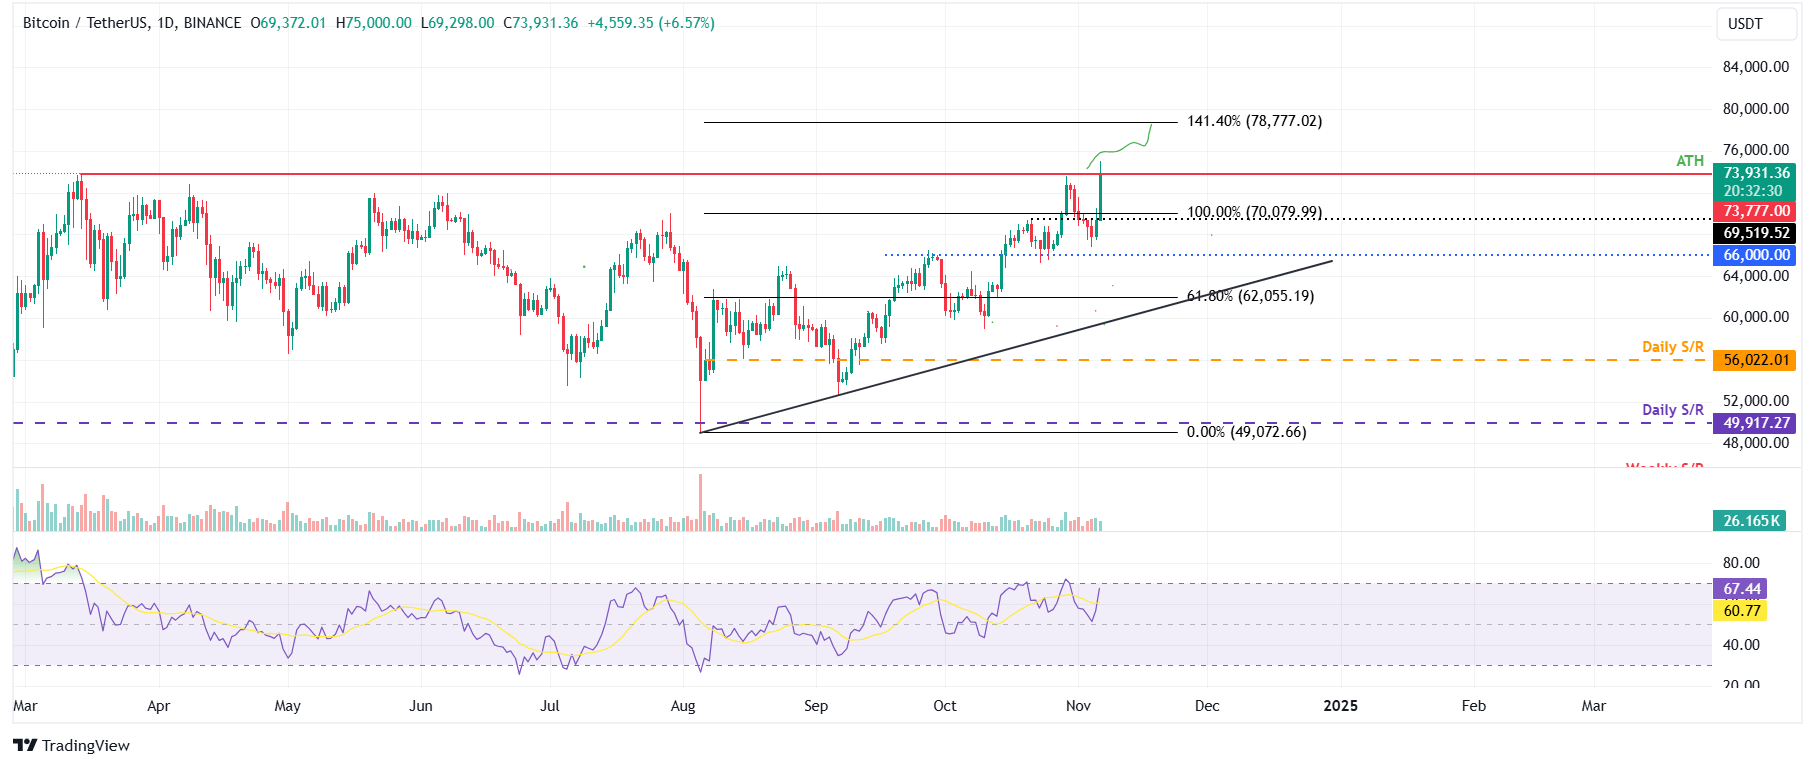
BTC/USDT daily chart
However, if BTC fails to close above $73,777 and declines, it may retest the key psychological level of $70,000.
Ethereum is poised for a rally if it closes above the key resistance level
Ethereum price broke below the ascending trendline on Monday (drawn from joining multiple low levels with a trendline since early September) but found support around its daily level of $2,342 and bounced slightly on Tuesday. On Wednesday, it raises and trades around $2,500, breaking above its 50% price retracement level at $2,485.
If ETH successfully closes above the $2,485 level, it could rally 10% to retest its October 21 high of $2,769.
The RSI indicator on the daily chart is currently at 50, trending upward and crossing above its neutral level, signaling that bulls are attempting to gain control over the bears. However, for the bullish momentum to continue, the RSI must close above 50 and maintain its upward momentum.
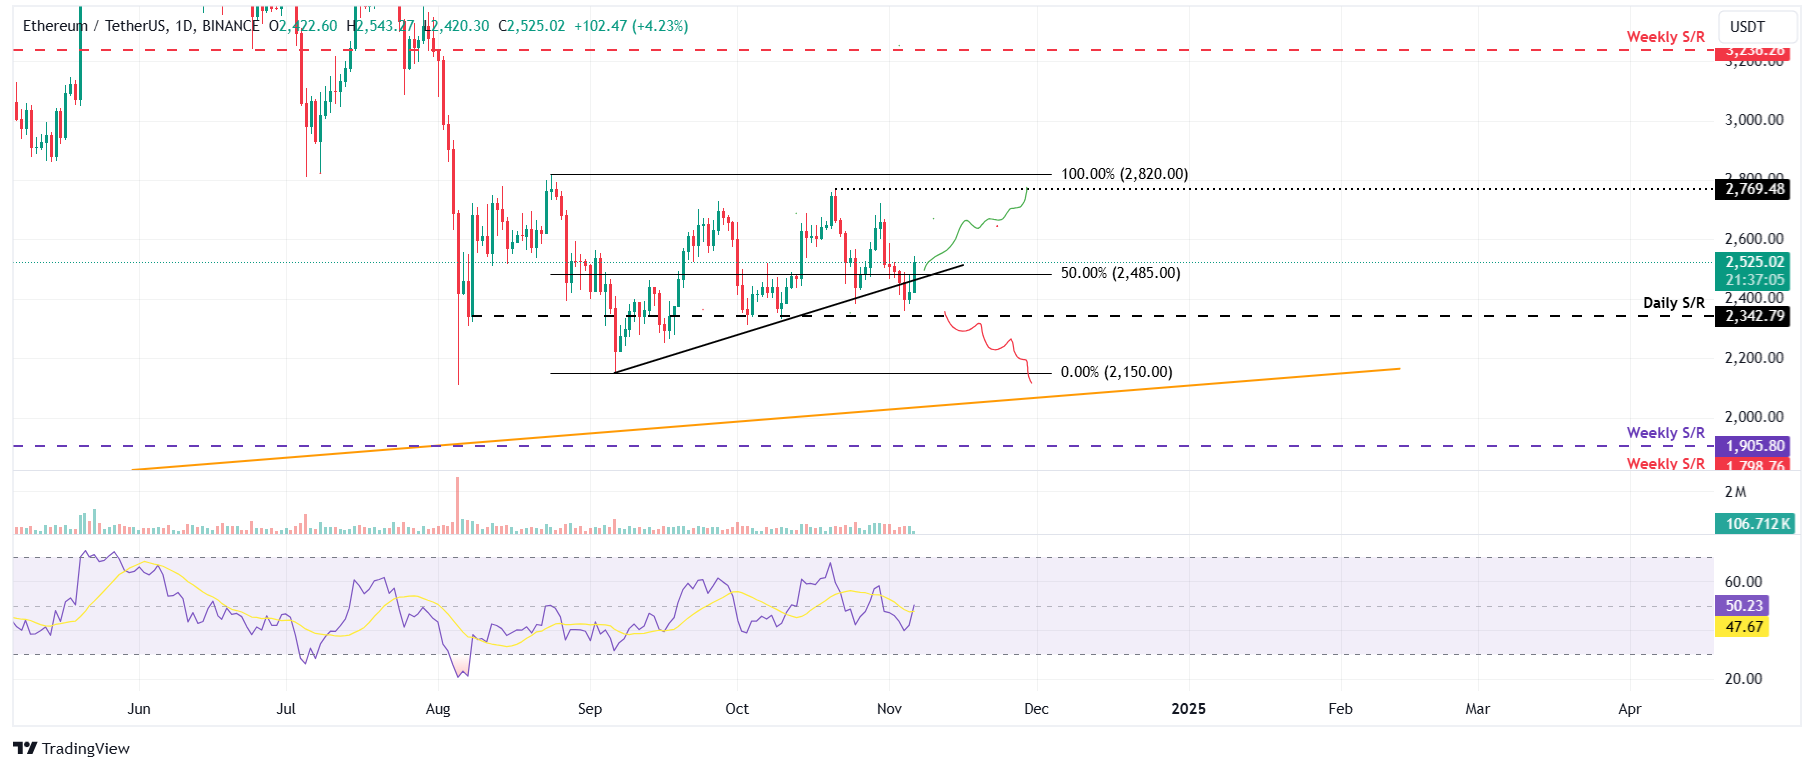
ETH/USDT daily chart
Conversely, if ETH declines and closes below $2,342 daily support, it would invalidate the bullish thesis. This scenario would extend the decline by 9% to retest its September 6 low of $2,150.
Ripple shows signs of recovery
Ripple price found support around its $0.488 daily level on Sunday and rose over 3.5% until Tuesday. At the time of writing on Wednesday, it continues to trade slightly above $0.526.
If XRP continues its rise and closes above the next daily resistance at $0.544, it could extend the rally by 15% to retest its daily resistance at $0.626.
The Moving Average Convergence Divergence (MACD) indicator further supports Ripple’s rise, signaling a bullish crossover on Wednesday’s daily chart. The MACD line (blue line) moved above the signal line (yellow line), giving a buy signal. Additionally, the RSI indicator on the daily chart is at 50, flipping above its neutral level of 50, suggesting that bullish momentum is gaining traction.
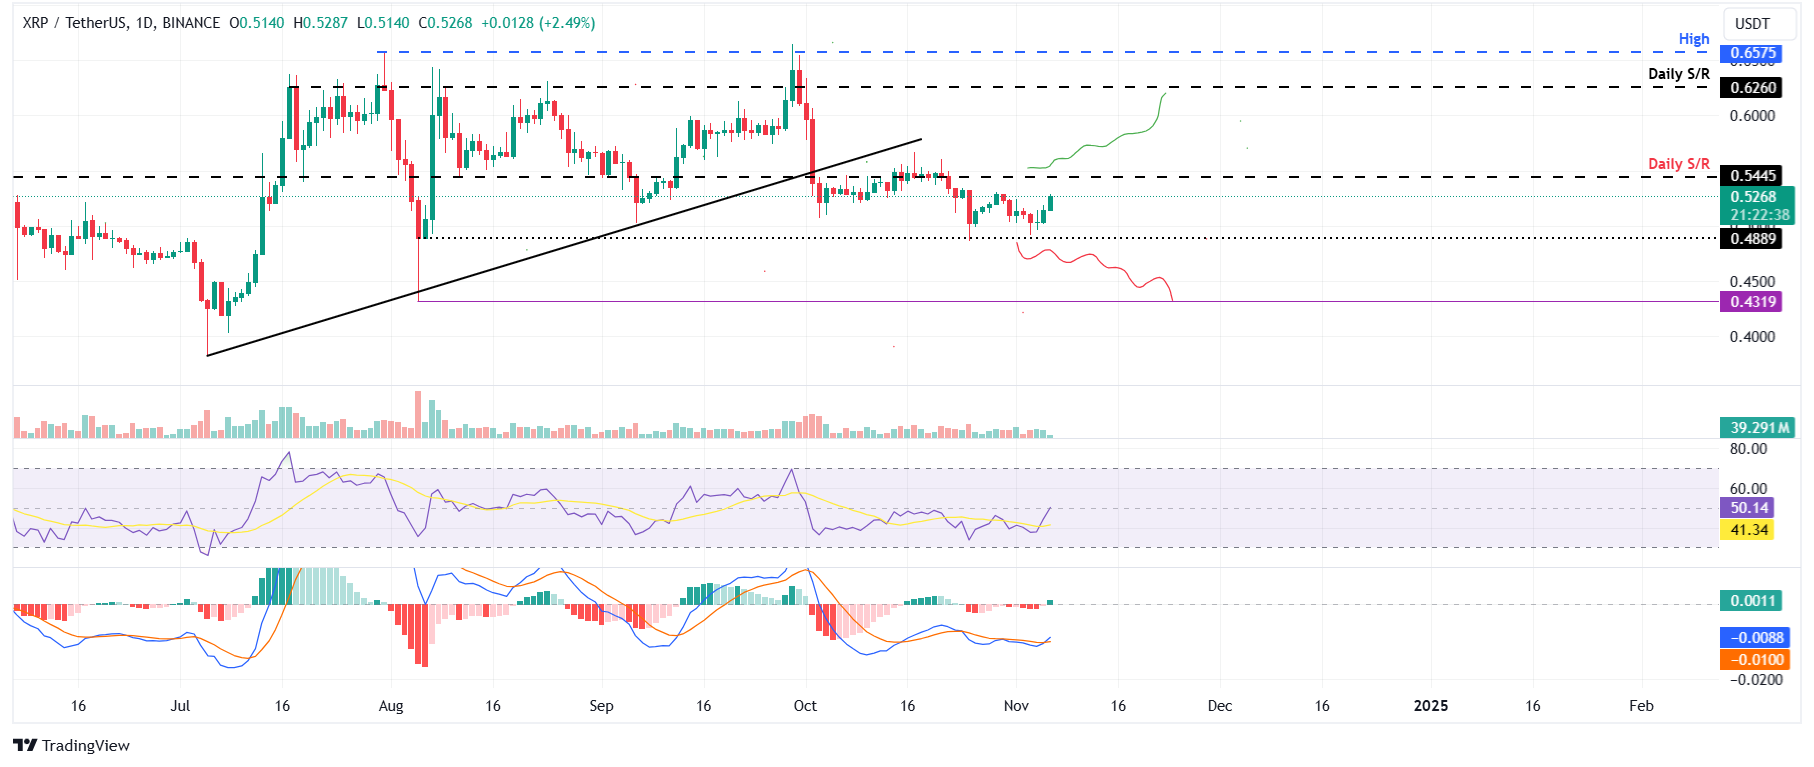
XRP/USDT daily chart
However, If XRP declines and closes below $0.488, it could extend the decline by 12% to retest its August 5 low of $0.431.
Author

Manish Chhetri
FXStreet
Manish Chhetri is a crypto specialist with over four years of experience in the cryptocurrency industry.


