Top 3 Price Prediction Bitcoin, Ethereum, Ripple: Bitcoin falls below $56,000 level
- Bitcoin price breaks below the weekly support level at $58,375, signaling a bearish move.
- Ethereum price fell below $3,240, its daily low on June 24, indicating a shift in the market structure from bullish to bearish.
- Ripple price trades below the weekly support level of $0.413, indicating a bearish trend ahead.

Bitcoin (BTC) breached the weekly support level of $58,375 on Thursday; as of Friday, it is trading 2.8% lower at $55,314. Ethereum (ETH) and Ripple (XRP) have dropped below crucial support thresholds, suggesting a potential downtrend for these assets in the coming days.
Bitcoin price breaks below the weekly support level at $58,375
Bitcoin price encountered resistance at the daily level of $63,956 on Monday, resulting in a 9.2% decline over the next three days. By Thursday's close, it had fallen below the weekly support of $58,375. It is trading around $55,314 as of Friday, reflecting a further decrease of 2.8% from the previous day's level.
If BTC's price closes below its May 1 low of $56,522, it could decline 7.3% to revisit its daily support at $52,266.
The Relative Strength Index (RSI) and the Awesome Oscillator (AO) on the daily chart support this bearish thesis, as both indicators are below their respective neutral levels of 50 and zero. This suggests continued momentum favoring bears, potentially leading to a further decline in the Bitcoin price.
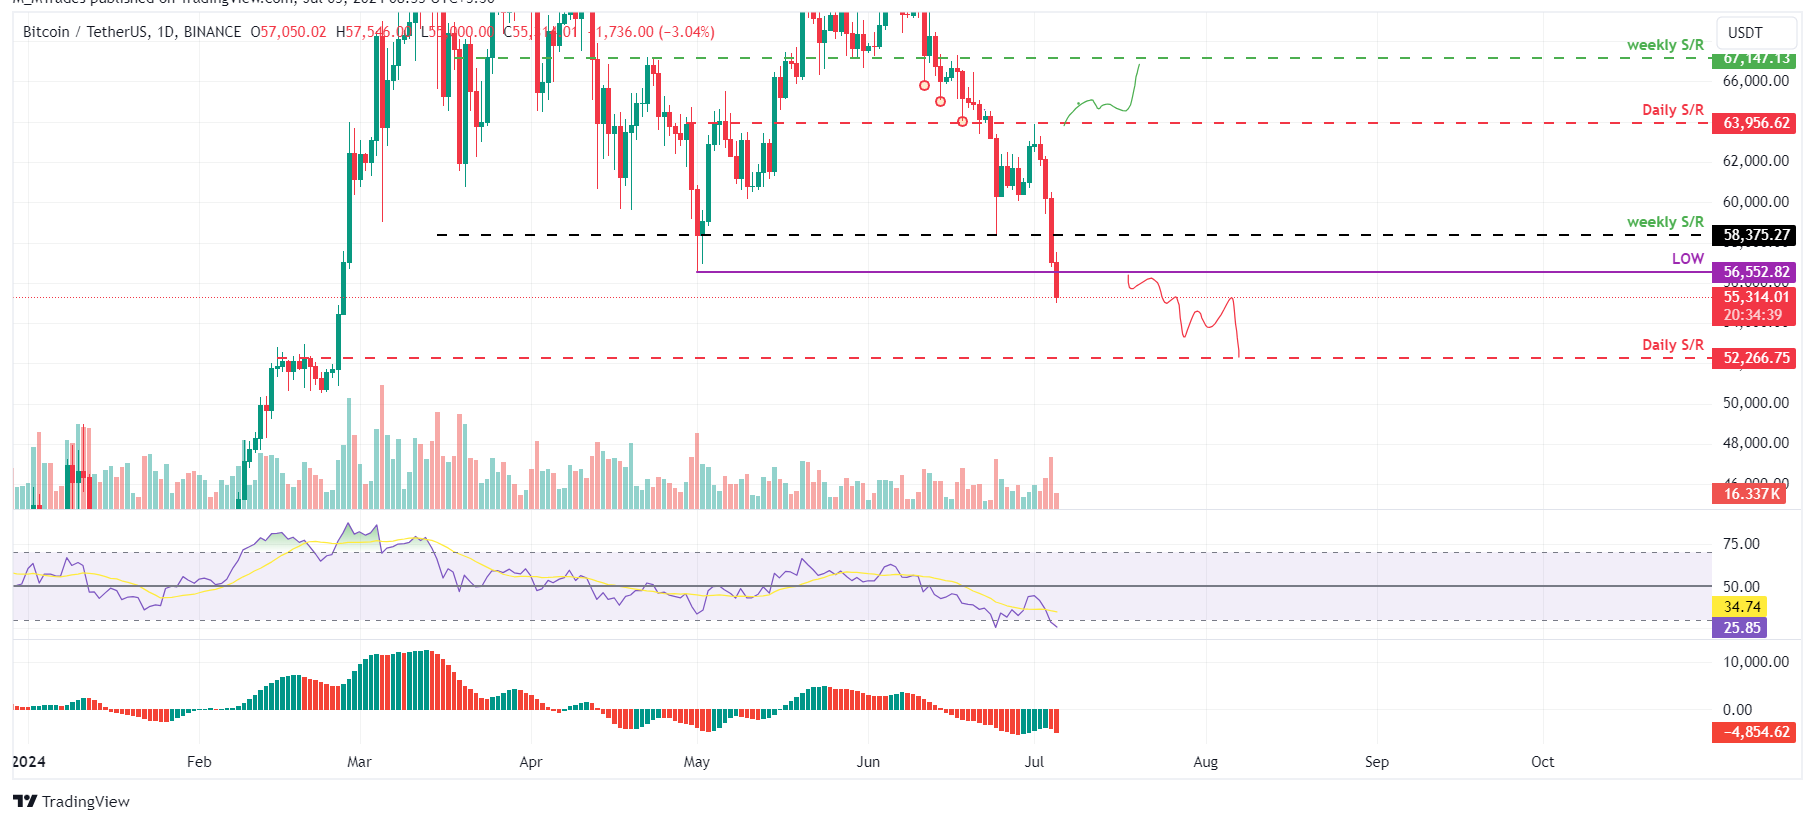
BTC/USDT daily chart
However, if BTC closes above the $63,956 daily resistance level and forms a higher high in the daily time frame, it could indicate that bullish sentiment persists. Such a development may trigger a 5% rise in Bitcoin's price to revisit its next weekly resistance at $67,147.
Ethereum price falls below $3,000
Ethereum price was rejected by the descending trendline on Monday, resulting in an 11% decline over the next three days. By Thursday's close, it had fallen below its June 24 low of $3,240, now revisiting its May 1 low of $2,817.It is trading around $2,914 as of Friday, reflecting a further decrease of 4.4% from the previous day's level.
If ETH's price closes below its May 1 low of $2,817, it could decline 6.5% to revisit its daily support at $2,621.
The Relative Strength Index (RSI) and the Awesome Oscillator (AO) on the daily chart support this bearish thesis, as both indicators are below their respective neutral levels of 50 and zero. This suggests continued momentum favoring bears, potentially leading to a further decline in the Ethereum price.
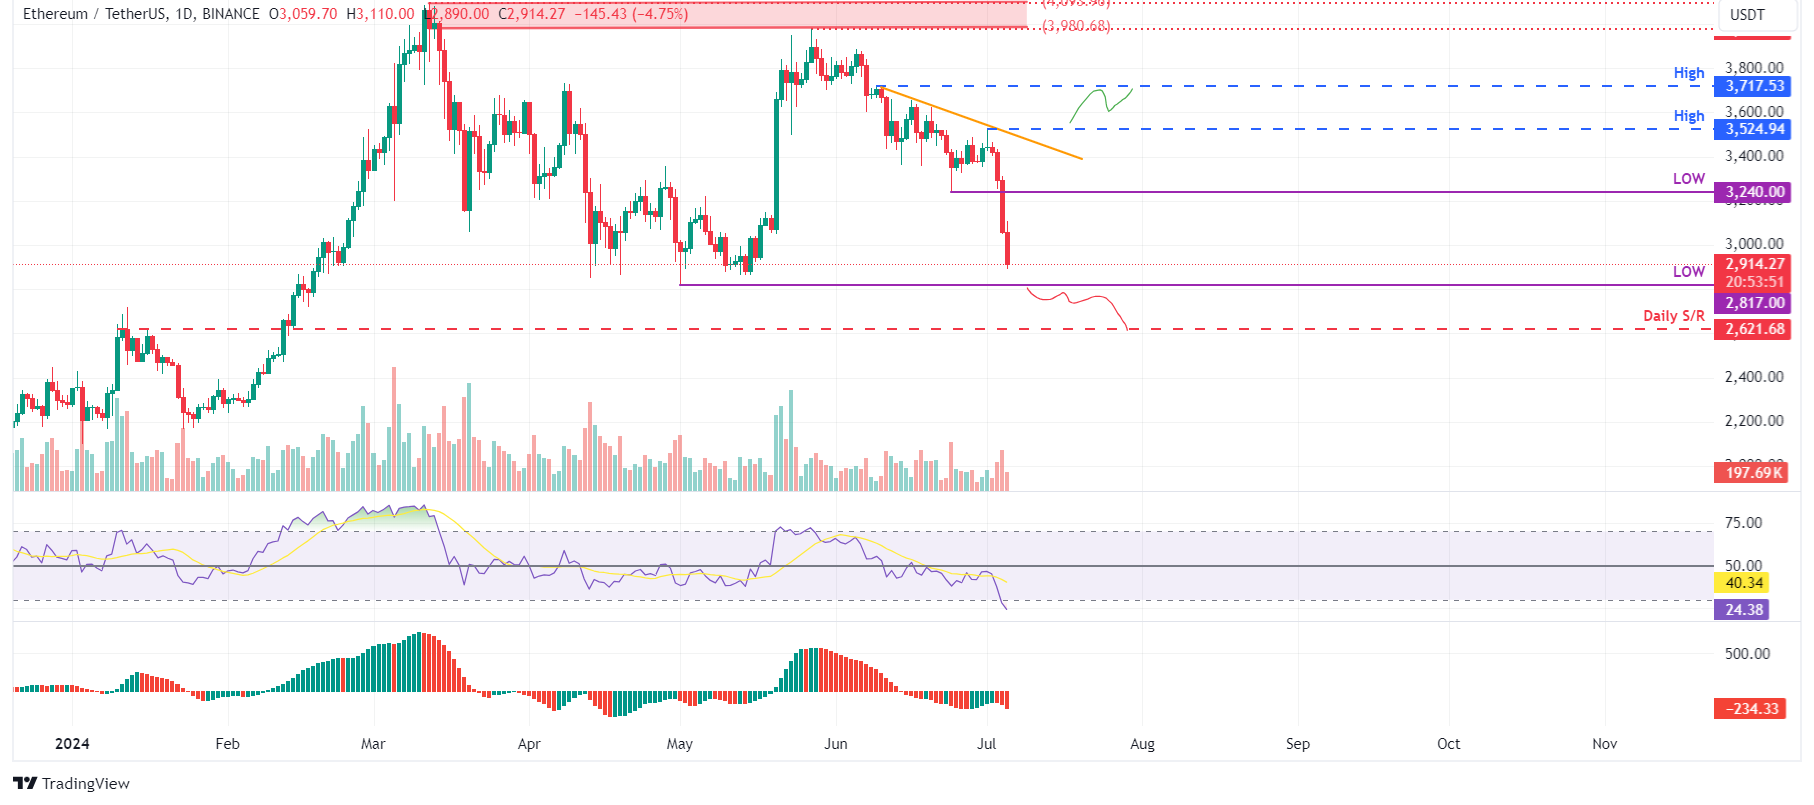
ETH/USDT daily chart
On the other hand, if Ethereum's daily candlestick price closes above $3,524, forming a higher high in the daily time frame, it could indicate that bullish sentiment persists. Such a development may trigger a 5.6% rise in Ethereum's price to revisit its high of June 9 at $3,717.
Ripple price trades below the weekly support level of $0.413
Ripple's price encountered resistance at the daily level of $0.499 on Tuesday, resulting in an 11% decline over the next two days. At the time of writing, it trades 8.7% down at $0.393, below the weekly support level of $0.413.
If XRP’s daily closes below $0.413, it could crash 15% to revisit its March 12, 2023 low of $0.347.
The Relative Strength Index (RSI) and the Awesome Oscillator (AO) on the daily chart support this bearish thesis, as both indicators are below their respective neutral levels of 50 and zero. This suggests continued momentum favoring bears, potentially leading to a further decline in the Ripple price.
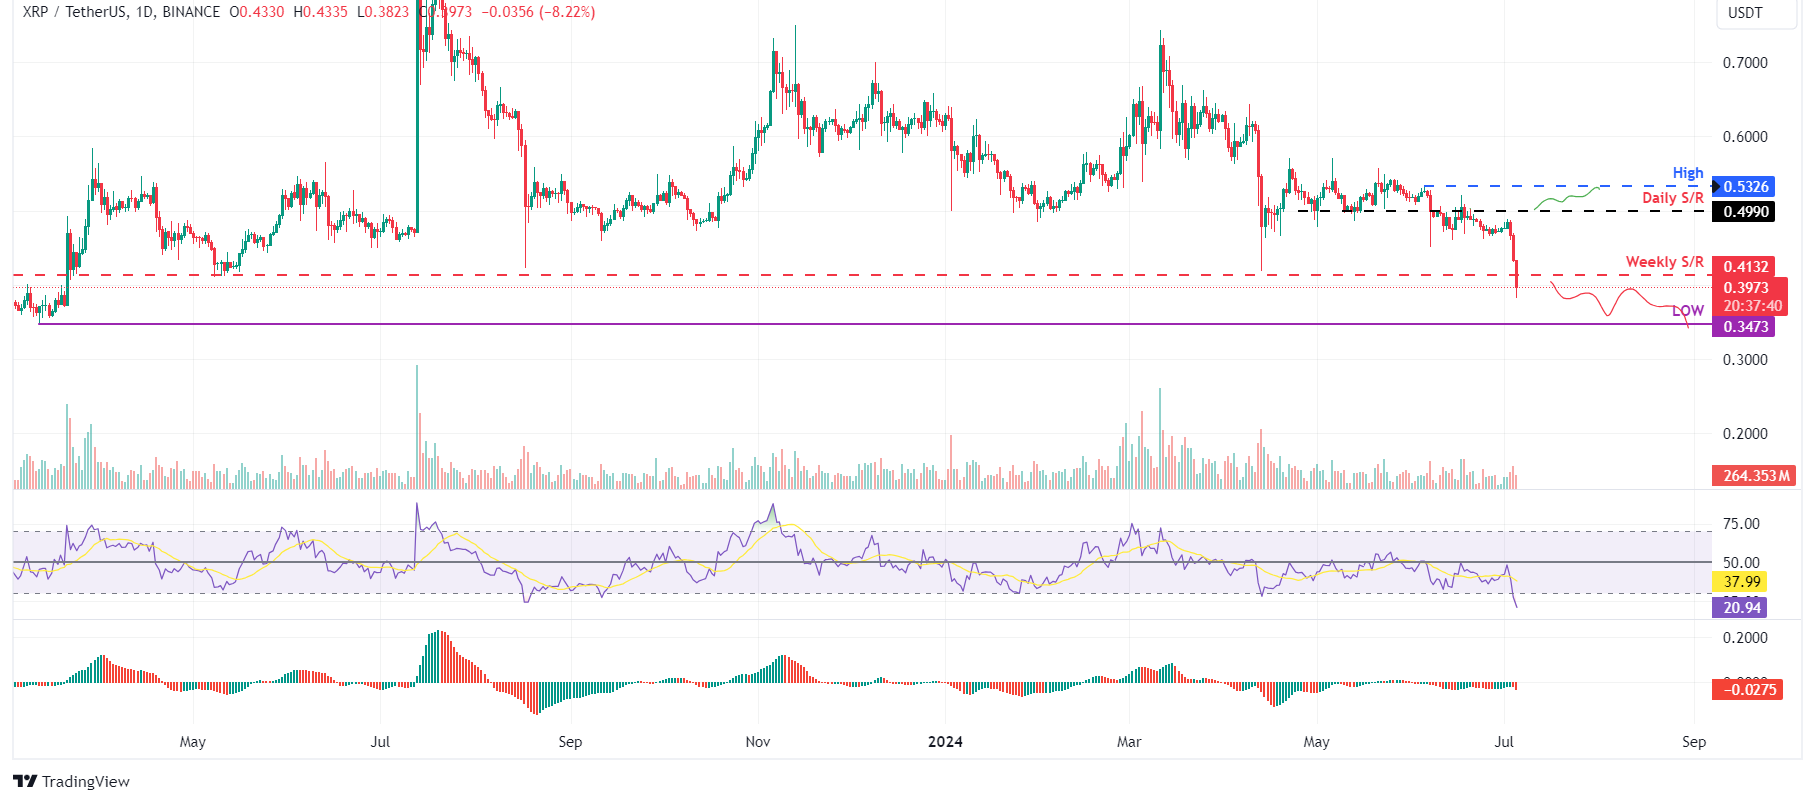
XRP/USDT daily chart
Conversely, if the Ripple price daily candlestick closes above $0.499 and forms a higher high in the daily time frame, it could indicate that bullish sentiment persists. Such a development may trigger a 6% rise in Ripple's price to revisit its high of June 5 at $0.532.
Author

Manish Chhetri
FXStreet
Manish Chhetri is a crypto specialist with over four years of experience in the cryptocurrency industry.




