Top 3 meme coins Dogecoin, Shiba Inu and Bonk: Report shows nearly 140 new meme token debuts
- Crypto data tracker CoinMarketCap listed 138 new meme coins in April, but the actual number may be higher.
- Analyst Crypto Koryo says diversification is key while investing in meme coins.
- SHIB and BONK have erased all gains from the past seven days, while DOGE price is up 12%.

April recorded the addition of 138 new meme coins to CoinMarketCap. The actual number could be even higher as analyst Crypto Koryo notes that CoinMarketCap reportedly lists only 10% of all tokens.
Amidst a surge in demand for meme coins, Dogecoin (DOGE) sustains nearly 12% gains over the past seven days, while Shiba Inu (SHIB) and Bonk (BONK) wiped out gains.
Dogecoin sustains gains, eyes 20% rally
Dogecoin is trading within a range between $0.17449 and $0.12010 since mid-April, as seen in the DOGE/USDT 1-day chart. At the time of writing, the largest meme coin by market capitalization is trading at $0.14757 on Binance, rising 12.38% in the past seven days.
The Moving Average Convergence Divergence (MACD), a momentum oscillator, supports the thesis of DOGE price recovery. The green histogram bars above the neutral line and the crossover of MACD above the signal line are bullish signs for Dogecoin.
In its climb towards the Fair Value Gap (FVG) between $0.17586 and $0.18974, DOGE faces resistance at $0.16165 and $0.17449, the 61.8% and the 50% Fibonacci retracement levels of the decline between March 28 top of $0.22888 and May 1 low of $0.12010, respectively.
A move to the conservative target at $0.17586 implies almost 20% gains from the current level.
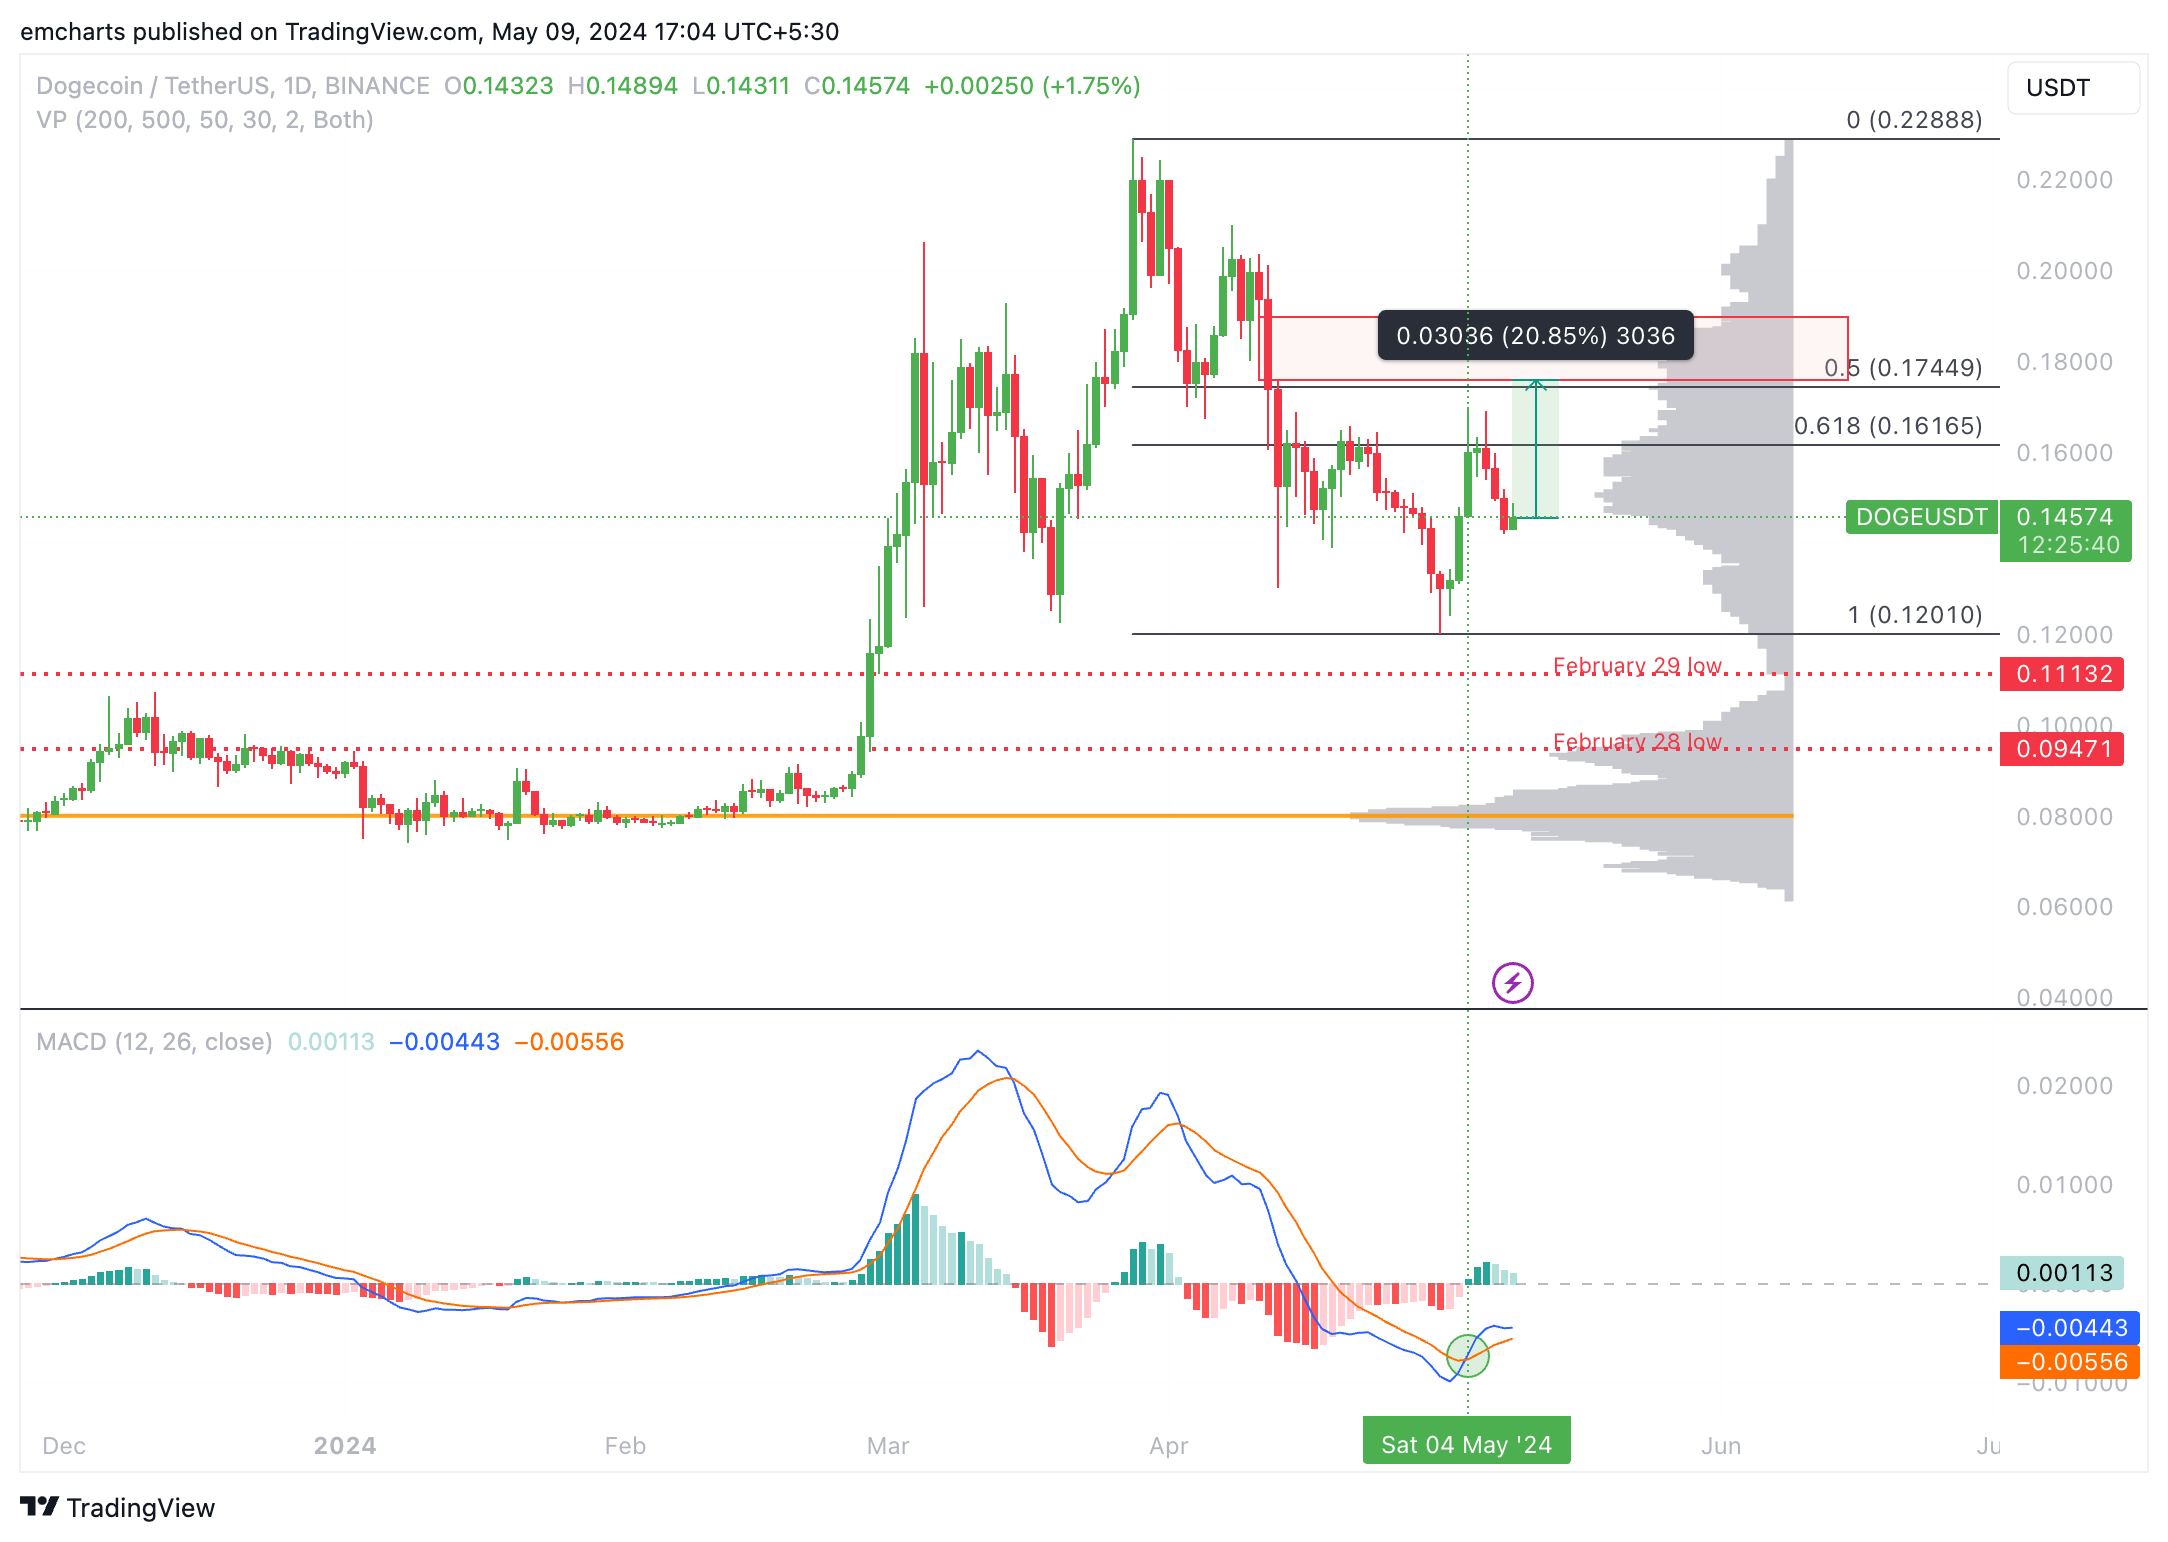
DOGE/USDT 1-day chart
Looking down, DOGE could find support at the May 1 low of $0.12010 and the February 29 low of $0.11132.
Shiba Inu could sweep liquidity at $0.00002251
Shiba Inu has formed lower highs and lower lows since March 5, as seen on the SHIB/USDT 1-day chart. SHIB has formed a descending triangle pattern, a bearish pattern characterized by a descending upper trendline and a flatter horizontal trendline, at $0.00002251.
SHIB is likely to sweep liquidity at the horizontal trendline at $0.00002251. The meme coin could find support at the May 1 low of $0.00002057 in the event of further decline.
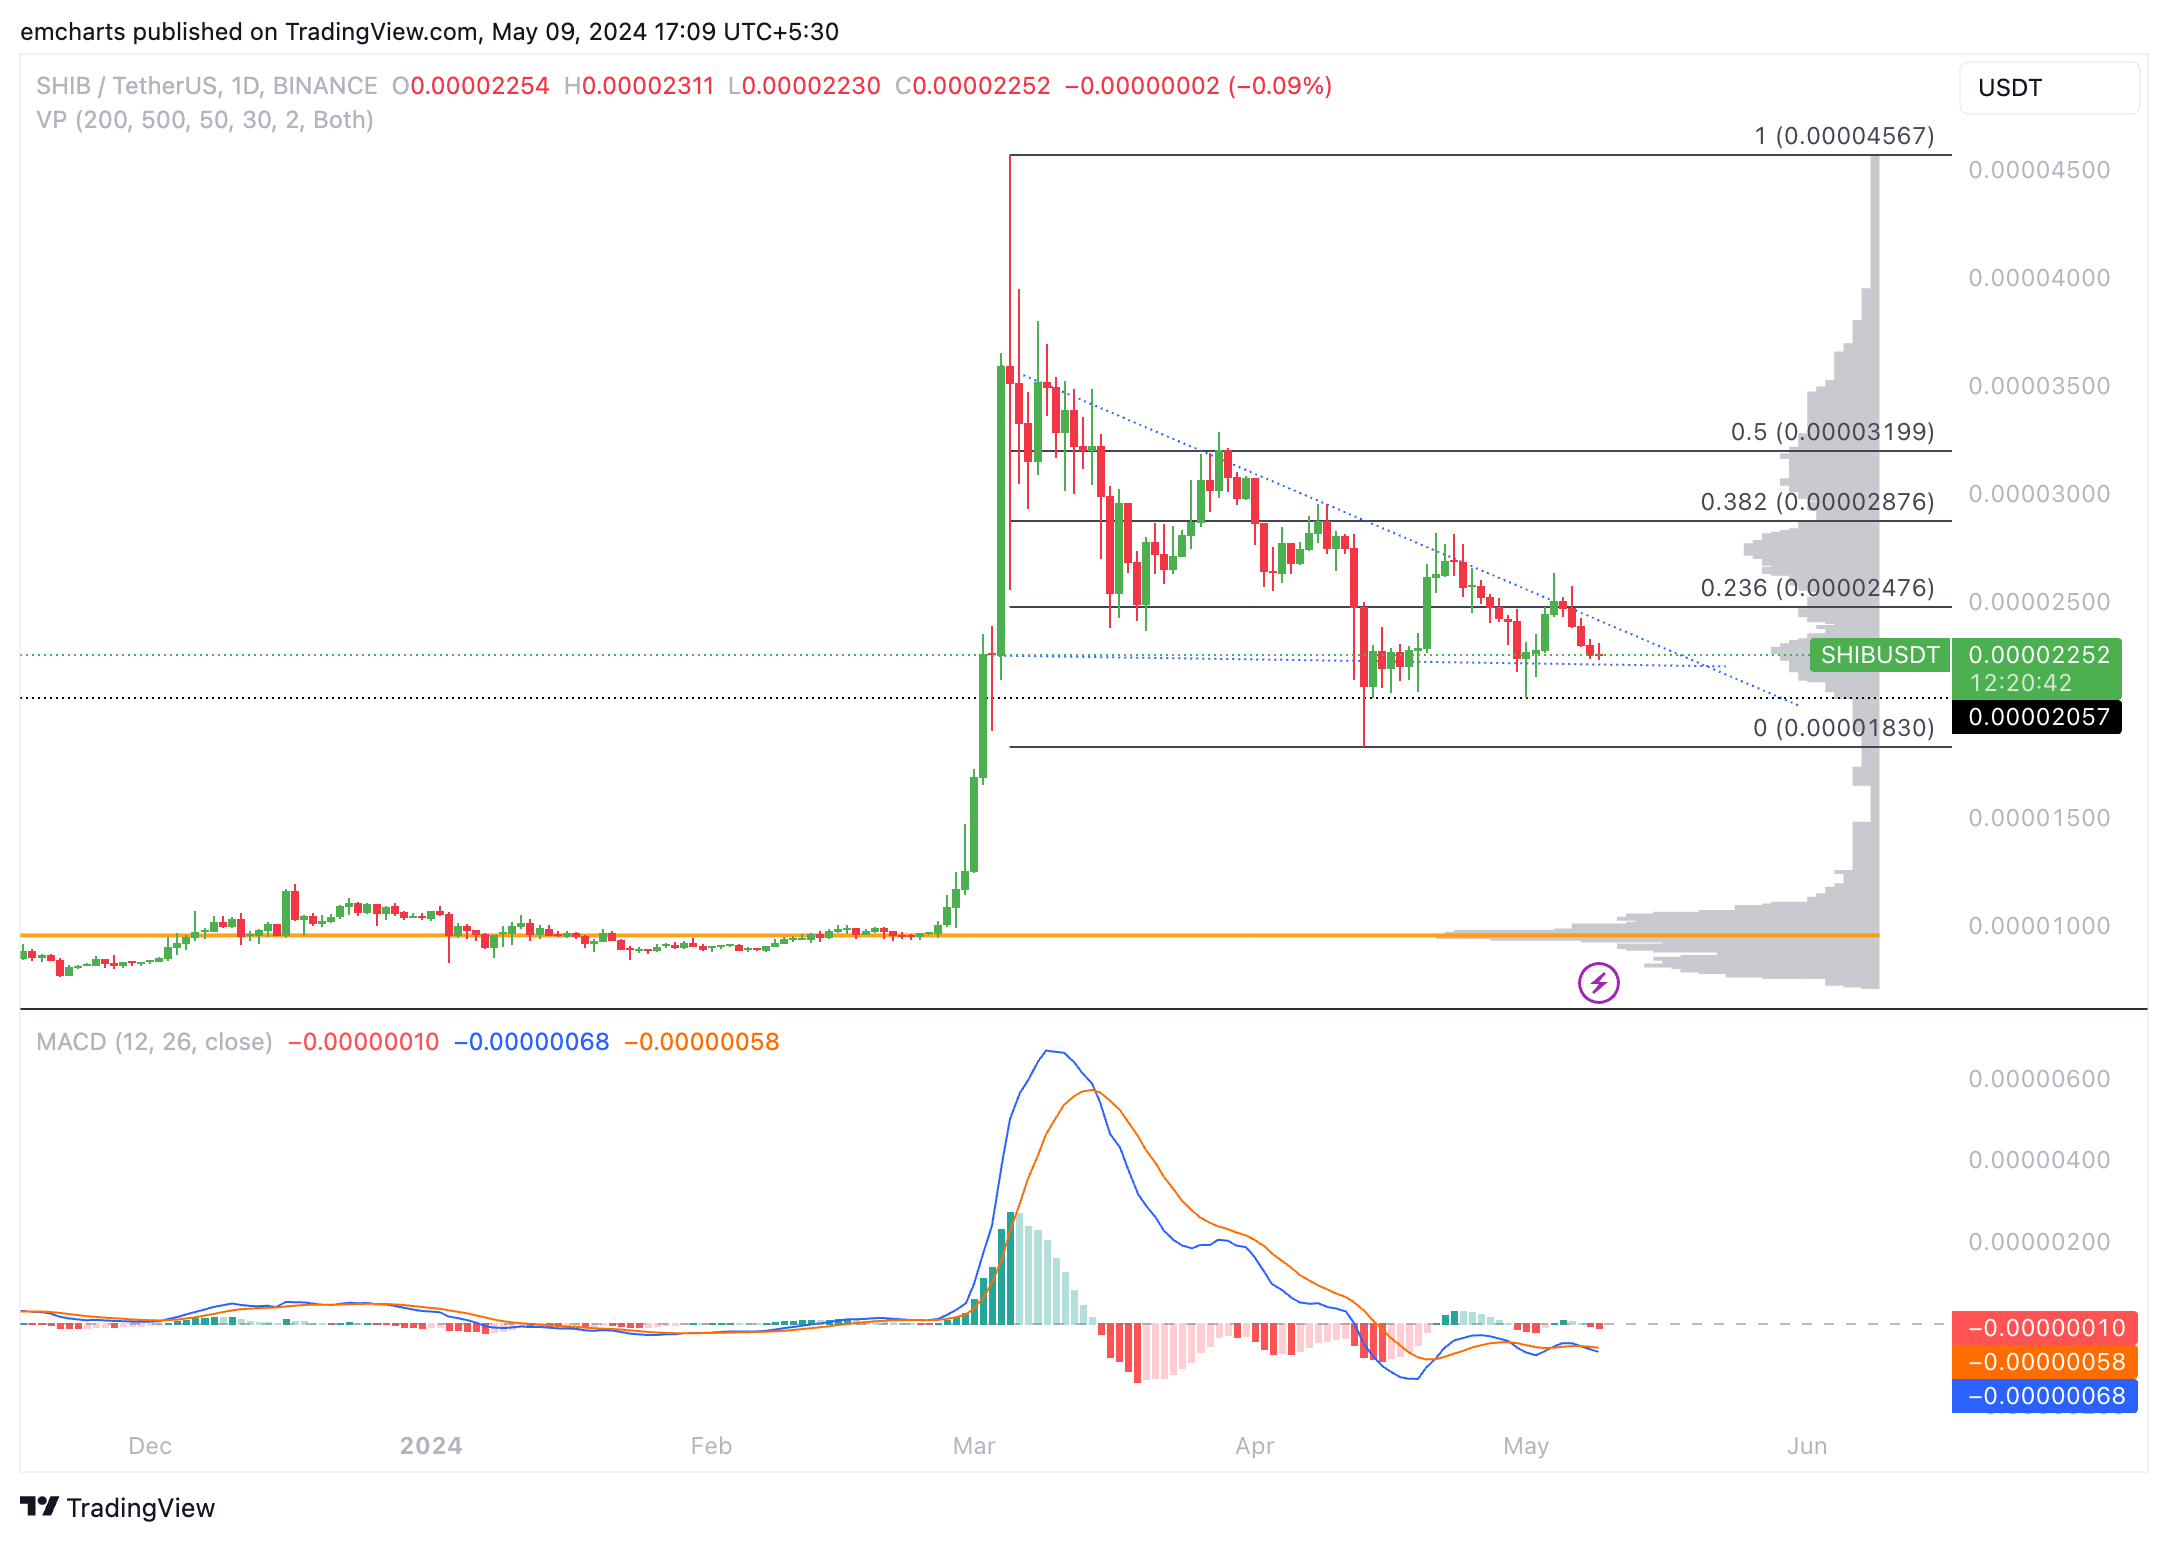
SHIB/USDT 1-day chart
On the other side, Shiba Inu faces resistance at $0.00002476 in case the meme coin sees a daily close above May 6 high of $0.00002424.
Bonk trades within a tight range, wipes out gains from past seven days
BONK/USDT 1-day chart shows BONK is trading within a range, with its upper boundary at the April 25 top of $0.00002966 and lower boundary at $0.00002089 (the 50% Fibonacci retracement level of the climb from April 13 low of $0.00001212 and the April 25 top of $0.00002966).
BONK has wiped out all gains from the past seven days and trades at $0.00002320 at the time of writing on Thursday.
BONK’s Moving Average Convergence Divergence indicator shows red histogram bars below the neutral line, meaning there is negative momentum in BONK’s rangebound price action. BONK could sweep liquidity at $0.00001212, the 50% Fibonacci retracement level.
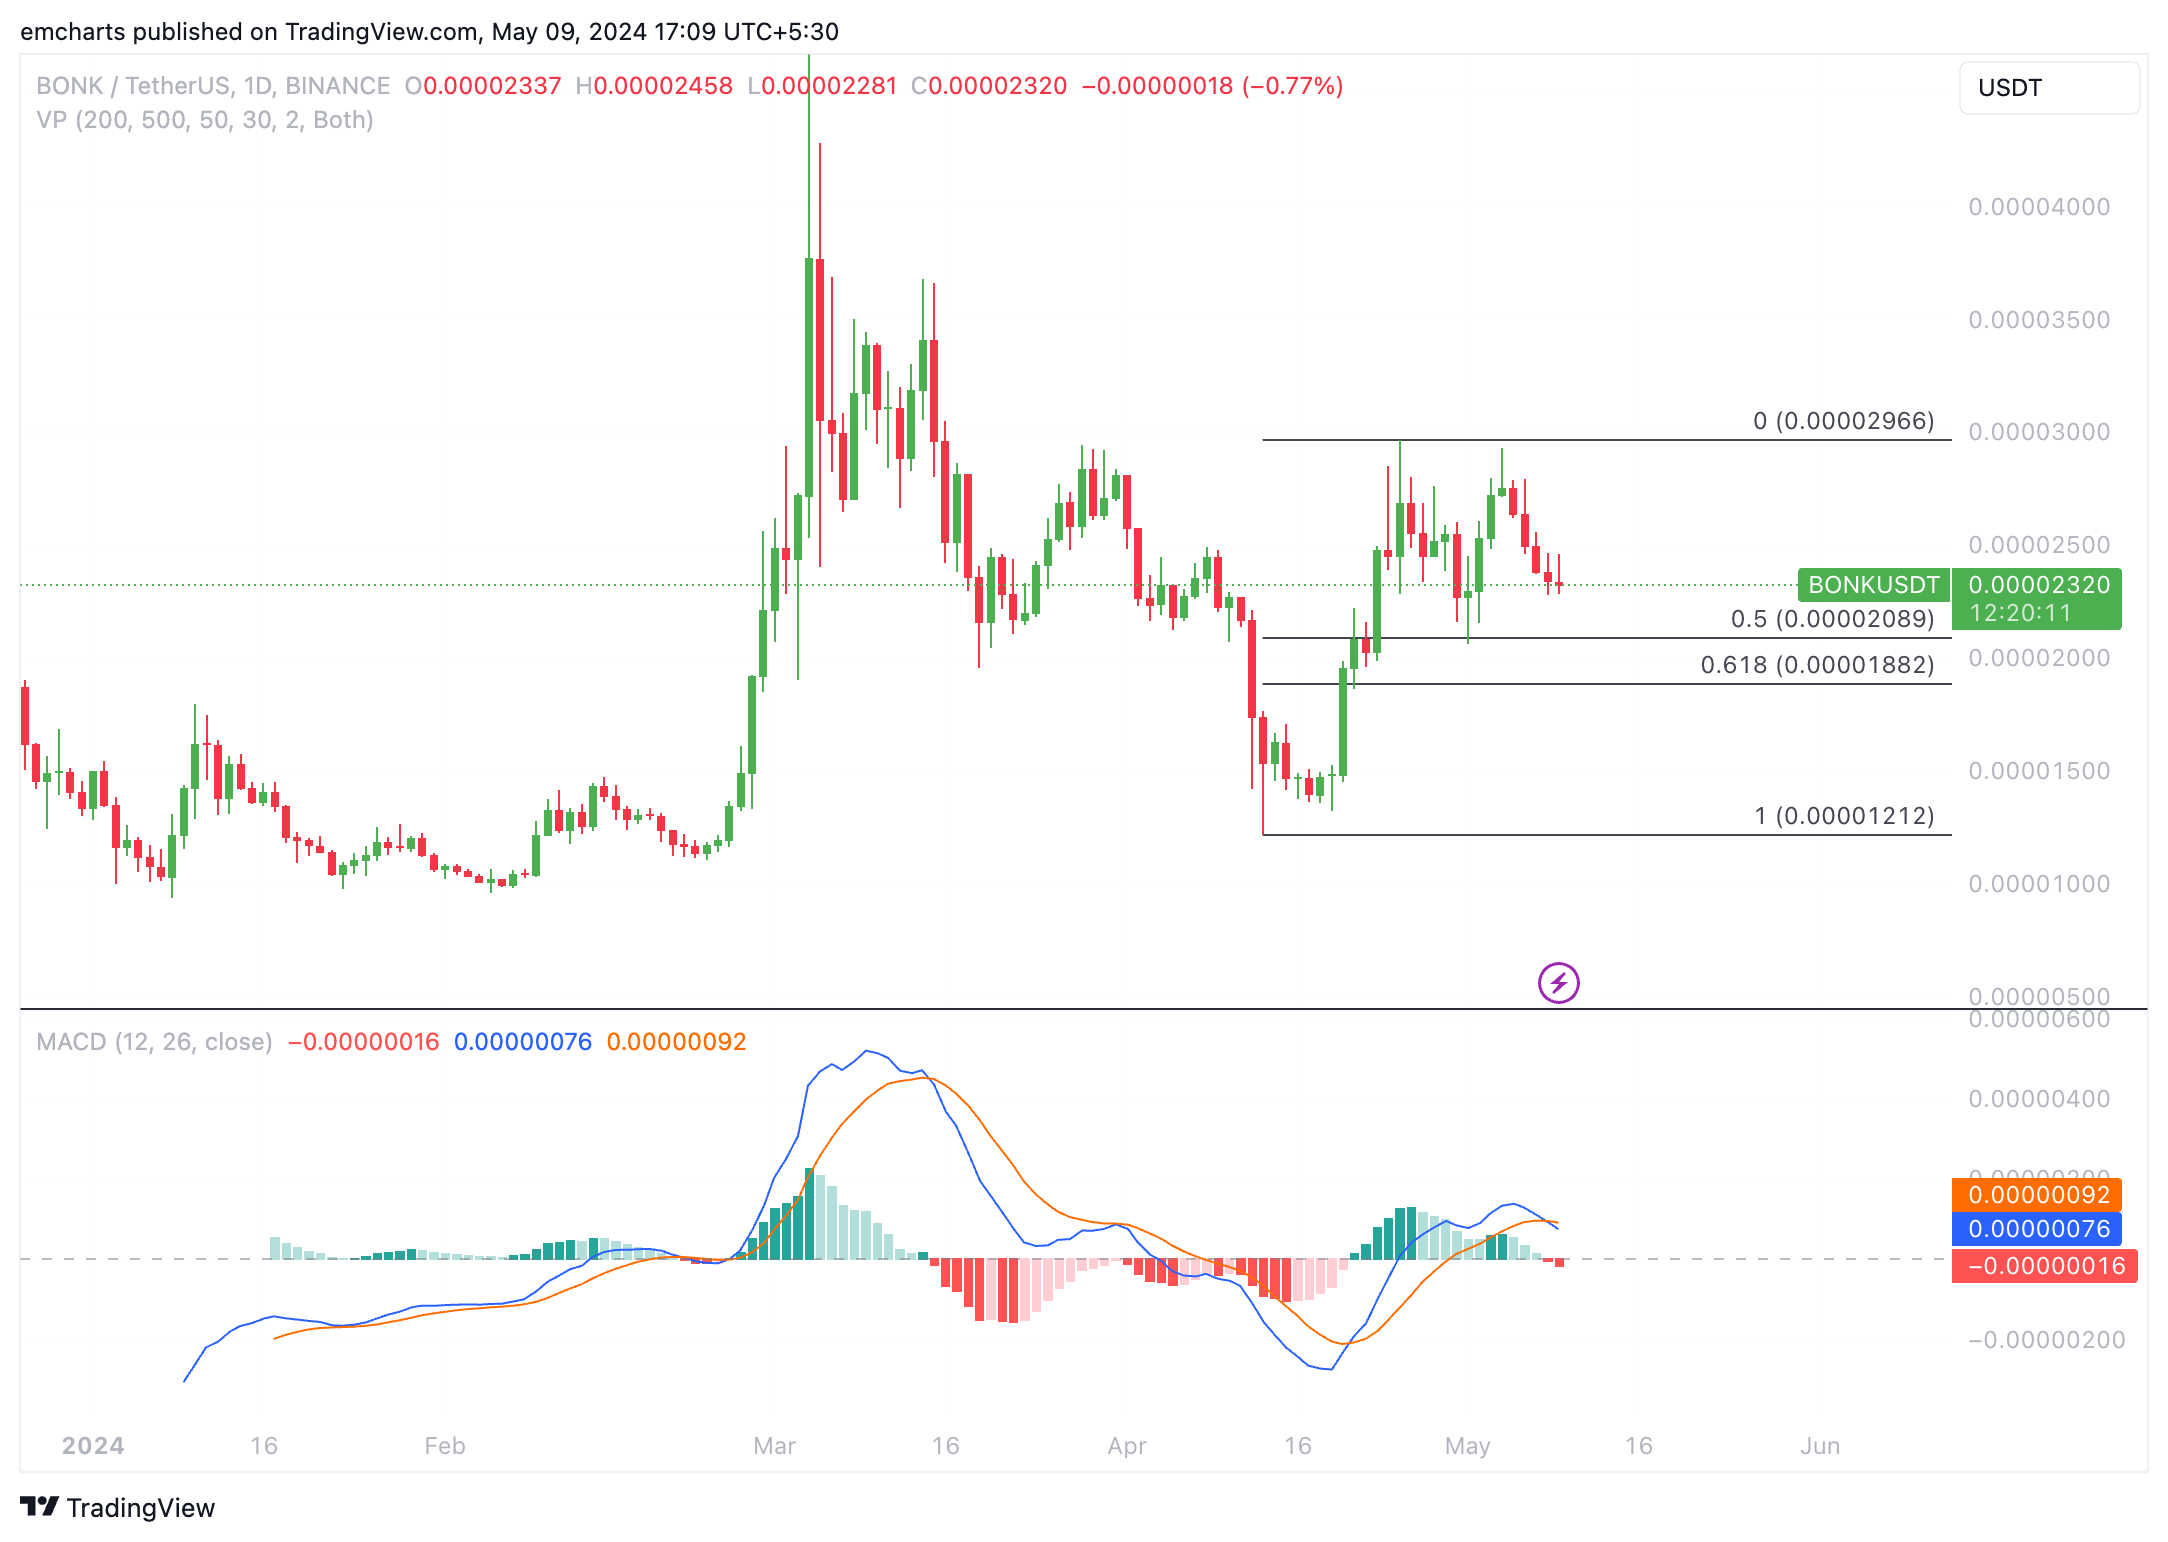
BONK/USDT 1-day chart
On the upside, BONK faces resistance at the May 7 high of $0.2559.
Author

Ekta Mourya
FXStreet
Ekta Mourya has extensive experience in fundamental and on-chain analysis, particularly focused on impact of macroeconomics and central bank policies on cryptocurrencies.


