Top 3 DeFi Price Prediction Synthetix, Aave, Uniswap: DeFi market pauses before a new leg up
- The top 3 defi projects have taken a pause after significant gains of over 30% in the past week.
- The cryptocurrency market is poised to resume its bullish momentum any time now.

Synthetix is currently trading at $15.7, down around 1.5% in the past 24 hours but up 2% overall in the past week. Aave has been under consolidation after a 31% rally and Uniswap continues to lead as the digital asset is up more than 37% in the past seven days.
Synthetix price could be poised for another pullback
On the 1-hour chart, the TD Sequential indicator has just presented a sell signal for SNX and the digital asset has just lost the 50-SMA, 100-SMA, and the 200-SMA. Validation of the signal could push Syntethix price below $15.
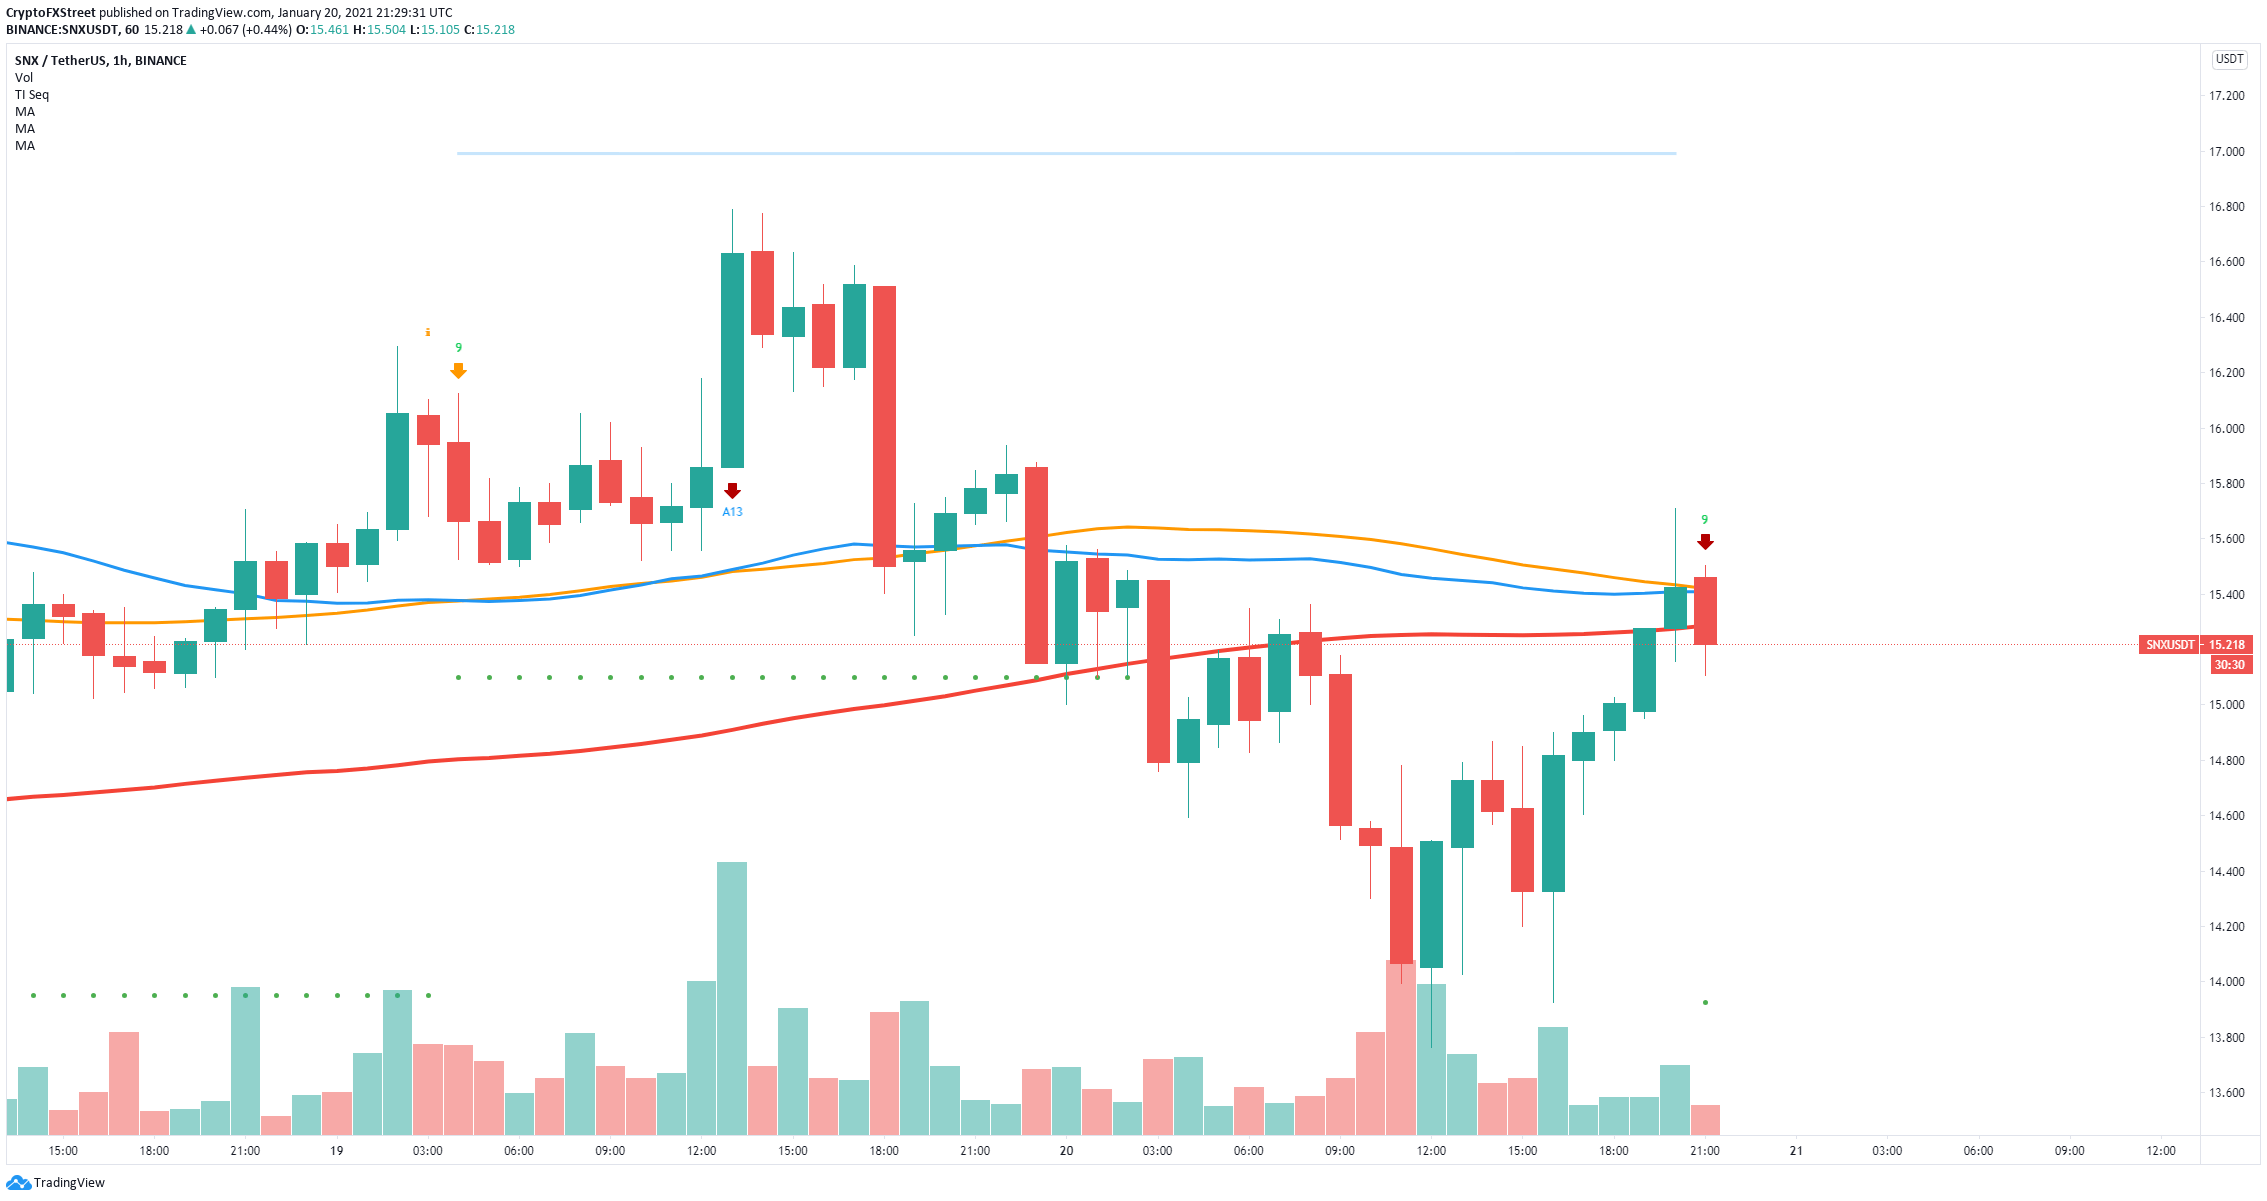
SNX/USD 1-hour chart
However, the In/Out of the Money Around Price (IOMAP) chart shows a robust support area located between $14.3 and $14.8. If the bulls can defend this point, they can quickly drive SNX price above $16 as the resistance ahead is extremely weak.
Aave price faces short-term sell pressure
On the daily chart, the TD Sequential indicator has presented a sell signal which has been accurate in the past. There is already some bearish price continuation and it seems that the next support level is located at $163, which is the 12-EMA.
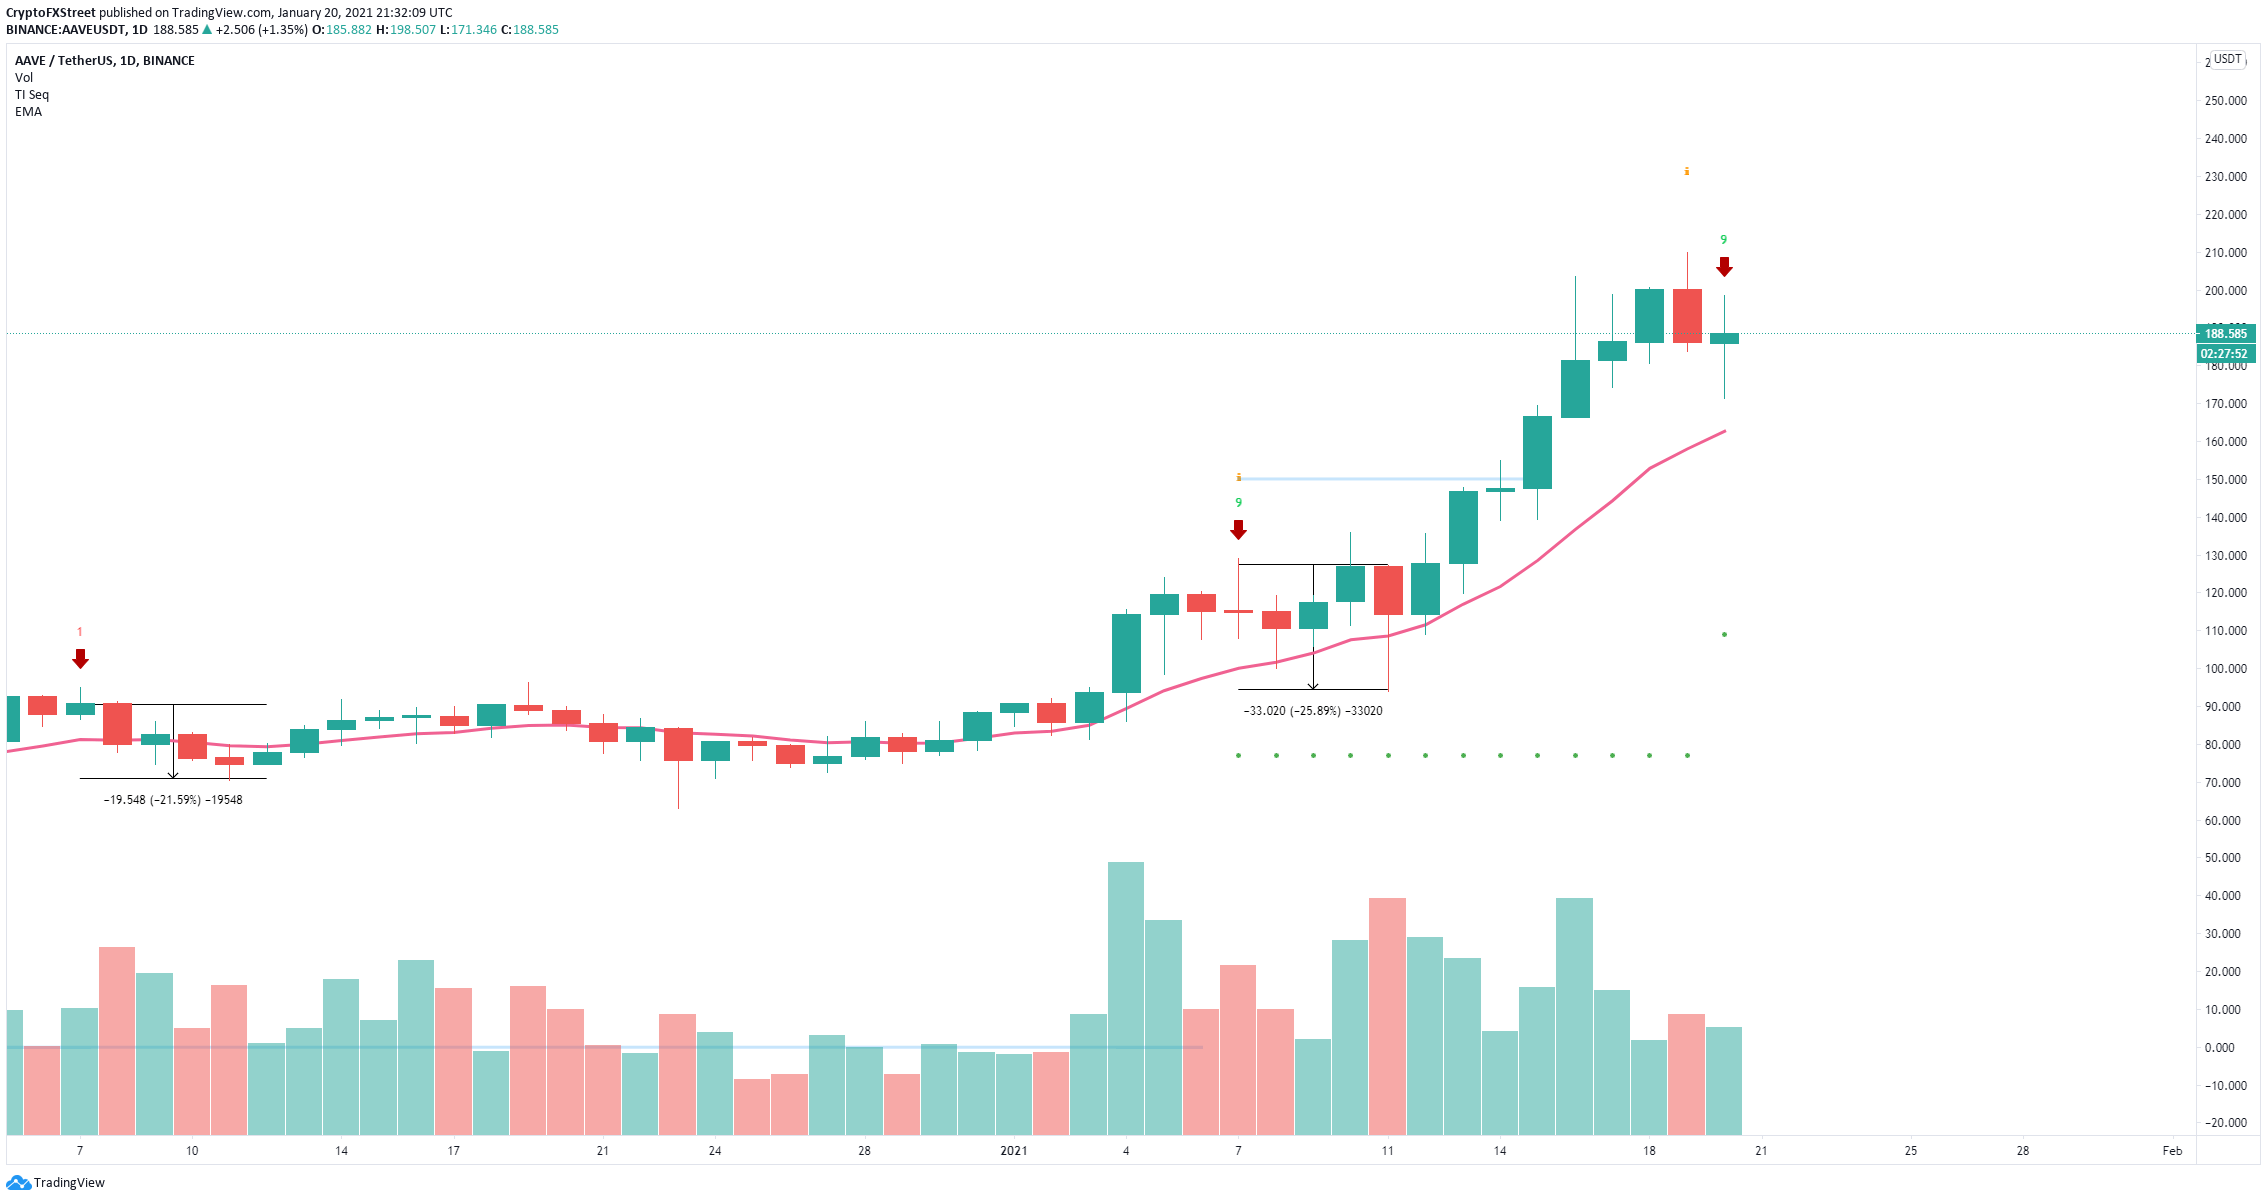
AAVE/USD daily chart
The IOMAP chart also indicates that the area between $160 and $165 is a strong support range; however, it also shows more support between $177 and $182. A breakdown below $177 would push Aave down to $163.
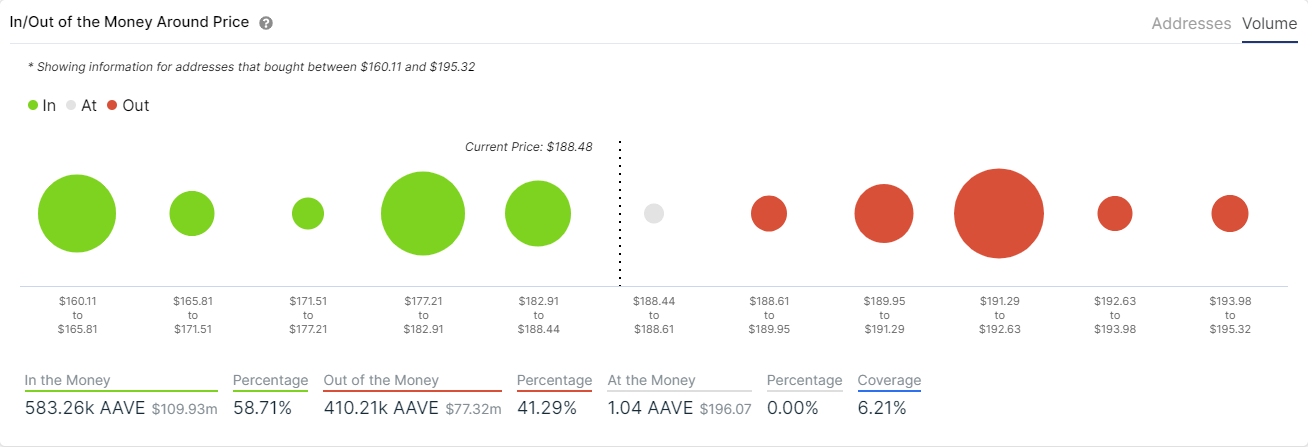
AAVE IOMAP
The model only shows one crucial resistance area between $191 and $192. A breakout above this point would drive Aave price towards the last high of $210 and potentially even higher.
%20[22.35.33,%2020%20Jan,%202021]-637467758650197144.png)
AAVE Holders Distribution
Despite Aave price increasing by 200% in the past month, the number of whales holding between 100,000 and 1,000,000 coins ($19,000,000 and $190,000,000) has increased by five since January 11, 2021. This indicates that large holders believe Aave is bound to rise even higher.
Uniswap price faces mixed signals, but whales continue to accumulate
On the daily chart, Uniswap price has managed to defend the 12-EMA at $7.5 and bulls bought the dip after the digital asset dropped from a high of $8.89 to a low of $7.65, pushing the digital asset back above $8.6.
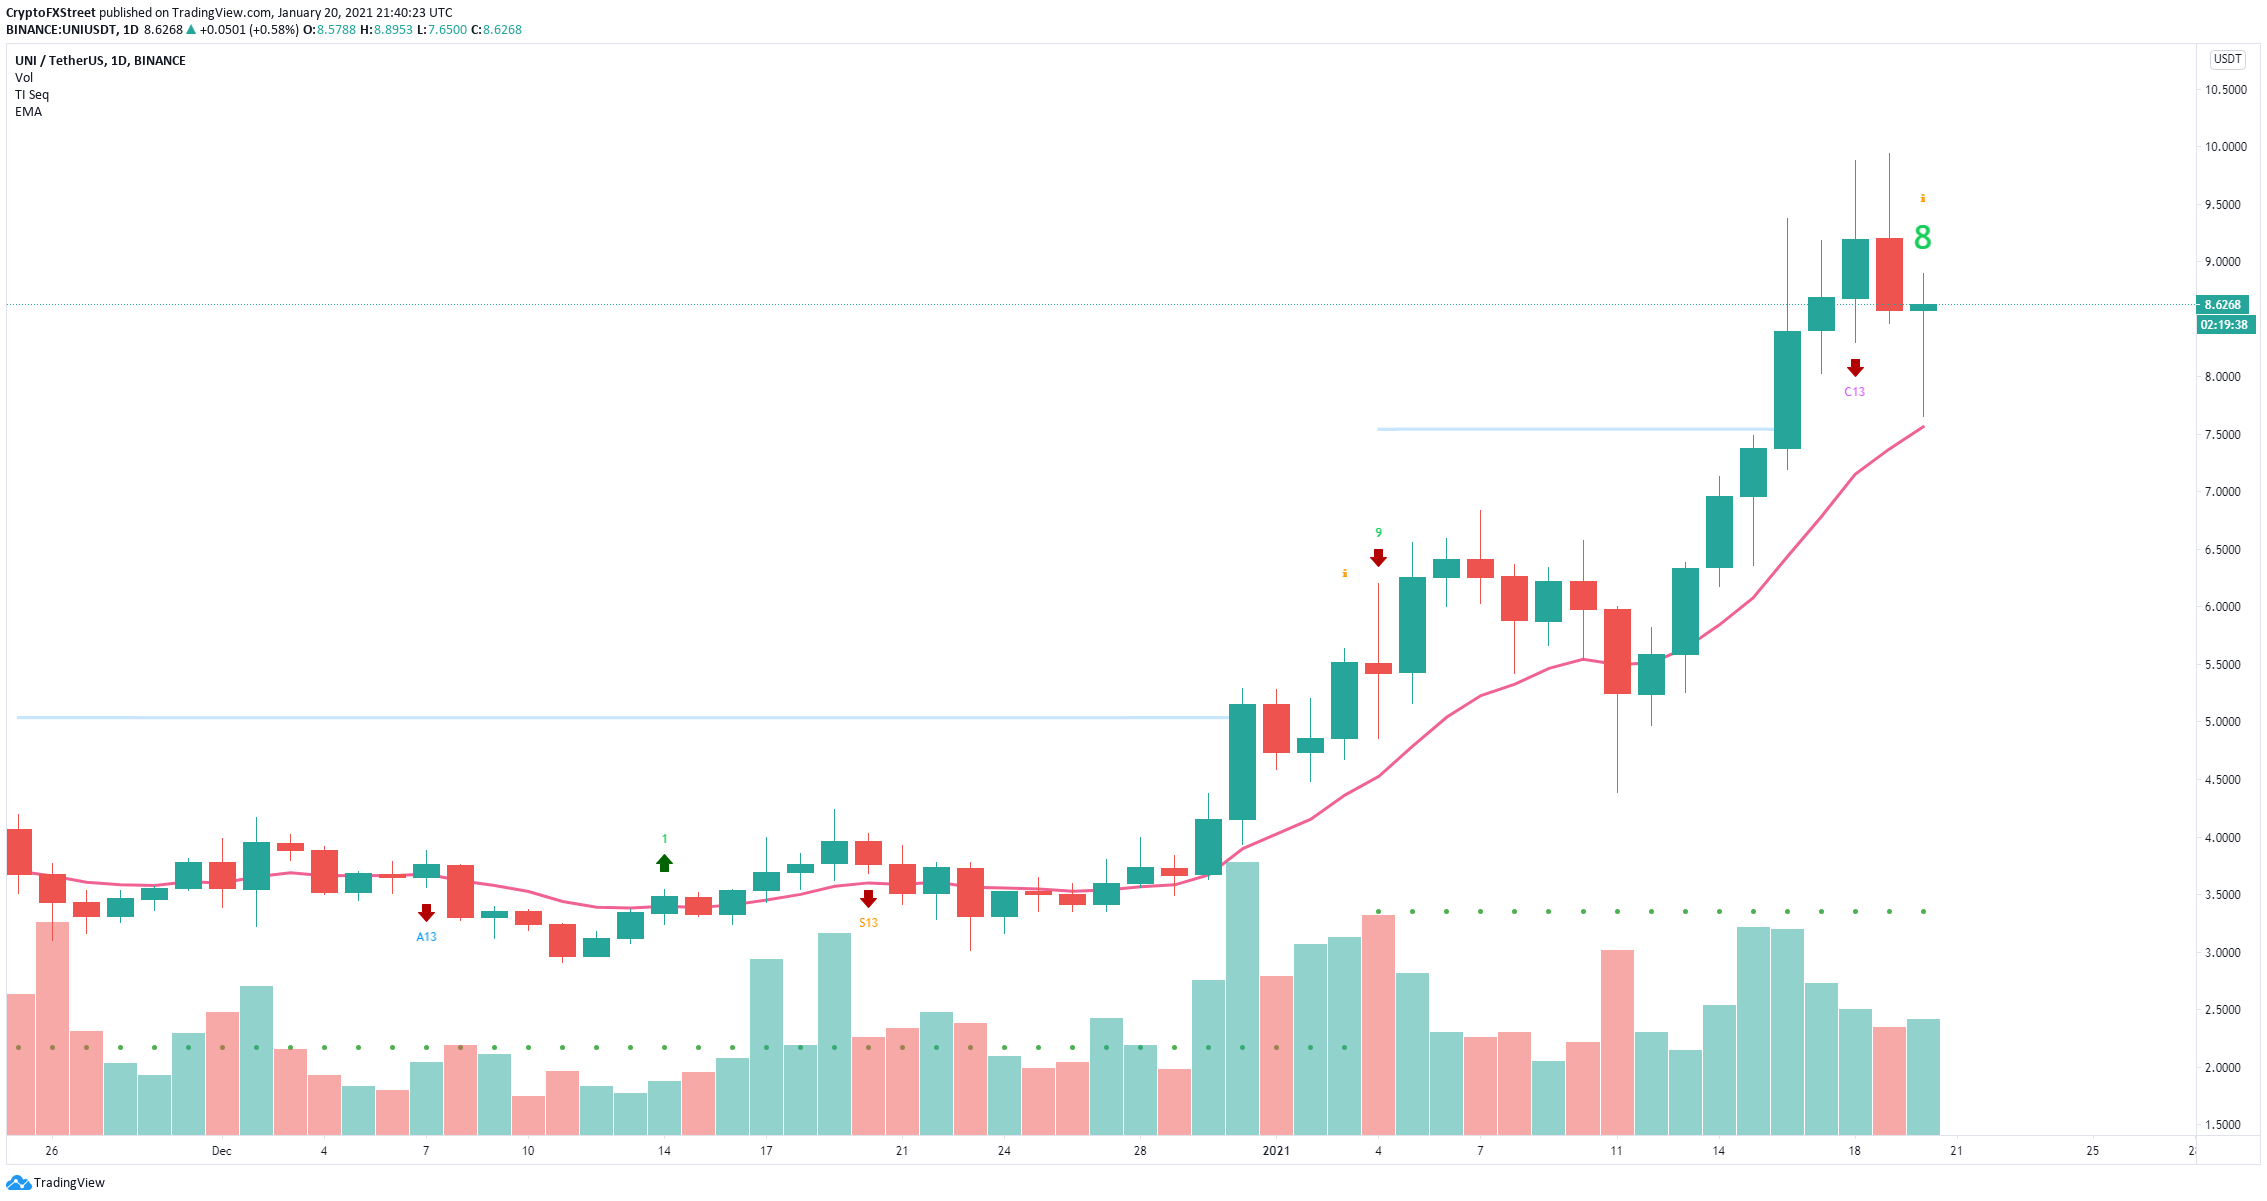
UNI/USD daily chart
The number of whales holding between 1,000,000 and 10,000,000 coins ($8,600,000 and $86,000,000) has increased by five since December 31, 2020 which shows large holders continue to accumulate the digital asset despite the price rise.
%20[22.41.05,%2020%20Jan,%202021]-637467758723950644.png)
UNI Holders Distribution
However, the TD Sequential indicator has presented a green ‘8’ candlestick on the daily chart which is normally followed by a sell signal. Confirmation of the call would push Uniswap down again.
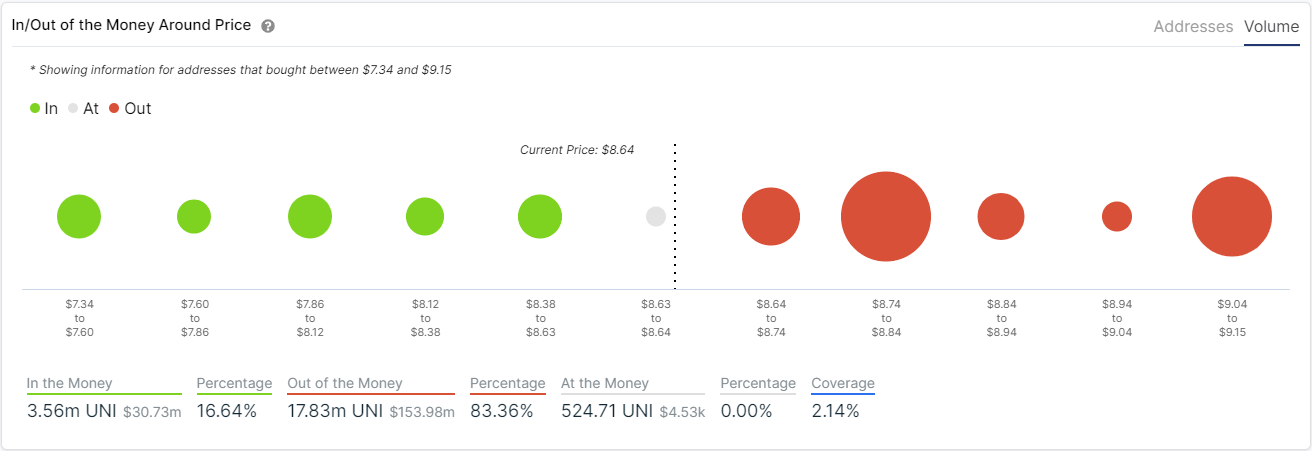
UNI IOMAP chart
The IOMAP chart shows practically no support on the way down below $8.6 when compared to the resistance above. The bearish potential price target would be $7.
Author

Lorenzo Stroe
Independent Analyst
Lorenzo is an experienced Technical Analyst and Content Writer who has been working in the cryptocurrency industry since 2012. He also has a passion for trading.



