Three indicators explain how Black Friday's dump impacted the cryptocurrency market
The recent news regarding the appearance of a new Covid variant has shaken the global markets. The fear over it quickly translated from traditional to crypto markets. The fact that Black Friday tends to be a day with low liquidity could have exacerbated the market reaction. Overnight Bitcoin’s price lost 10% and Ethereum 12%. Besides both BTC and ETH being considerably less volatile than this summer run, ETH still shows a higher 30 day realized volatility than BTC, so it is expected that it overreacts over large market moves like the one just experienced.
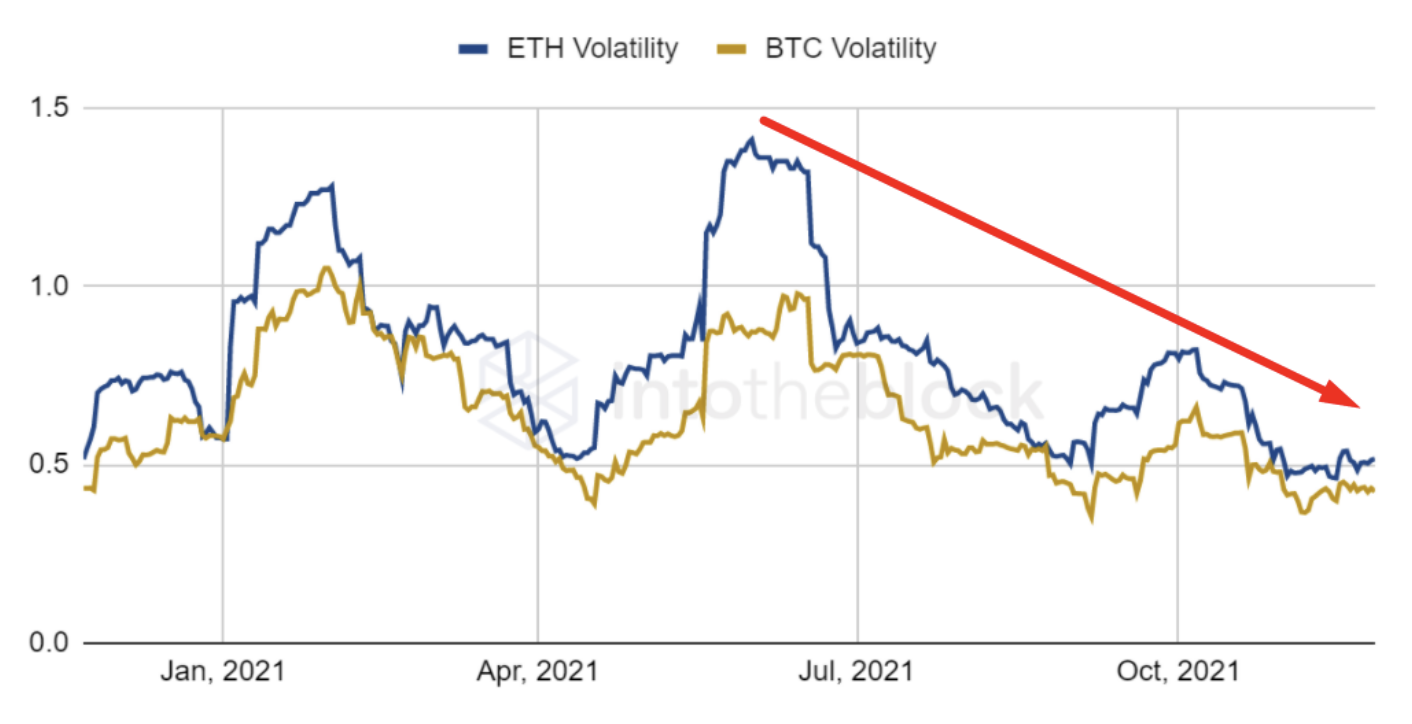
BTC vs ETH 30-d Volatility from IntoTheBlock app.
This risk-off reaction of investors has been seen multiple times and particularly as usual it hit stronger on assets such as small-cap traded companies like those in the US Russel 2000 whose index price dropped more than 3% this time. Curiously, the major US index has a high correlation with BTC, up to 0.63. This means the price moments over the last thirty days of both BTC and Russell 2000 have been relatively similar.
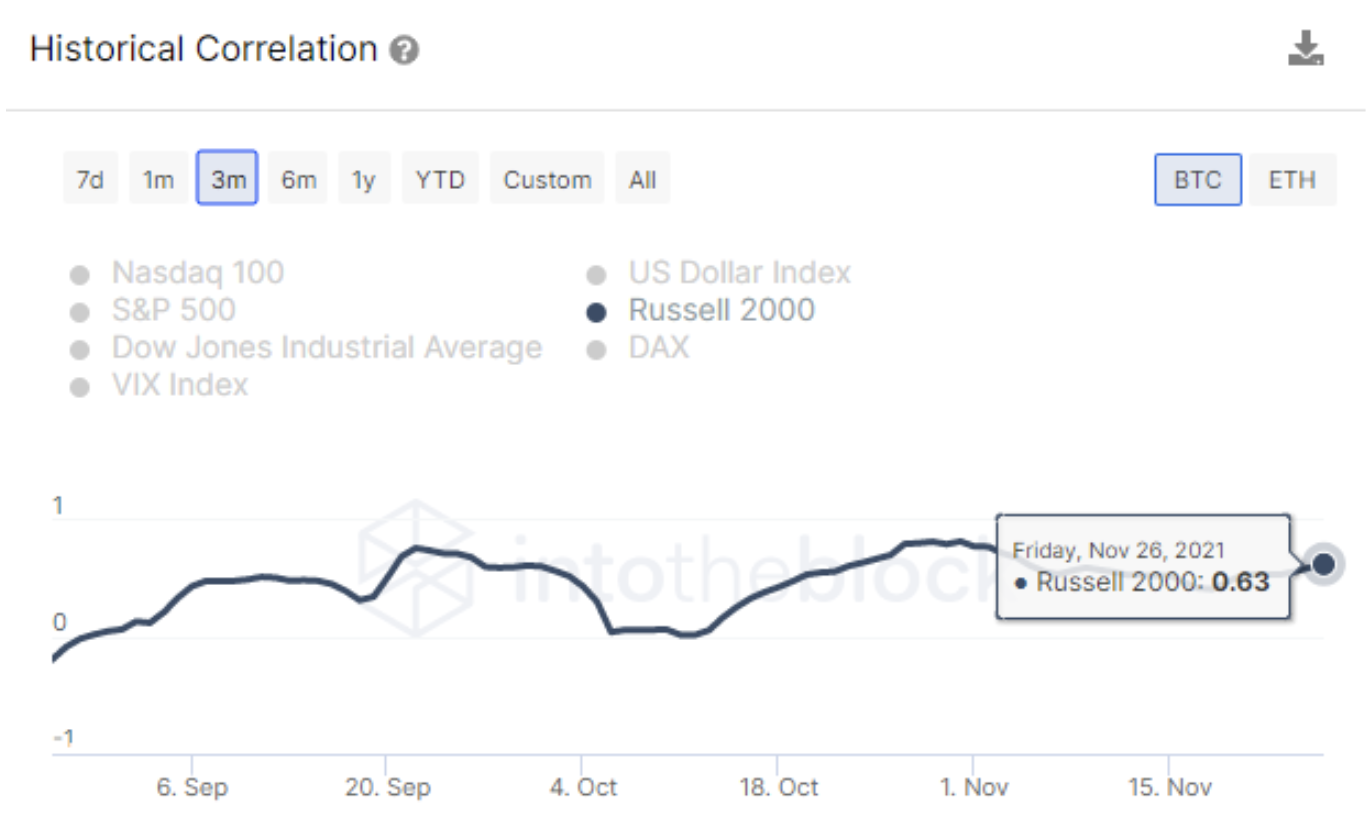
Historical correlation of BTC and ETH from IntoTheBlock app.
Speaking of correlations, since Bitcoin price movements have a high influence over the rest of the crypto market we find it useful to check which resistance or support levels the indicator In/Out of the Money Around Price gives. The IOMAP is useful for traders to know the next price levels where addresses are expected to buy and sell based on users’ positions and profits. It is a great complement to traditional technical analysis. It can be thought of it as a crypto-native indicator of support and resistance: using blockchain data to determine key areas where holders’ positions are concentrated, creating buying and selling activity.
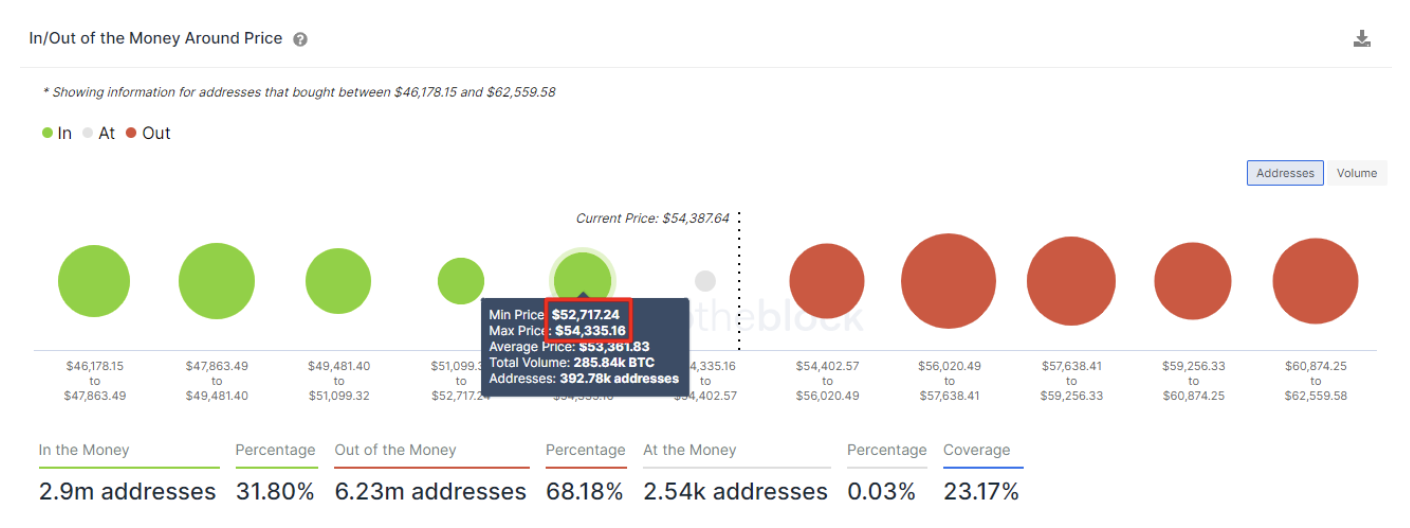
Indicator In/Out of the Money Around Price from IntoTheBlock app
As it can be seen in the indicator above, BTC has a large percentage of investors that bought BTC between $52,700 and $54,300, so it is expected that price range to potentially work as a support area for the price to bounce since investors are usually less willing to sell their assets when they are in profit.
Overall the long-term perspective remains bullish for BTC, with high inflation hinting at being more than temporary and investors seeking assets to hedge it. Nevertheless, knowing how correlated is the crypto market with traditional markets, it would be a good idea to keep updated with how the Covid uncertainty develops and how US markets perform over the next few days.
Author

IntoTheBlock Team
IntoTheBlock
IntoTheBlock Team consists of a tribe of data scientists, crypto experts and AI geeks.


