Technical Analysis of ZAP, BAND, and LINK: Oracle tokens rebound from market mayhem

A steep selloff in the cryptocurrency market fueled by growing concerns about the environmental impact of crypto mining and China’s recent regulatory announcements dominated the headlines last week. The market subsequently partly recovered, with most digital assets steadily rebounding.
ZAP, for instance, posted a sharp recovery from its May 23 lows of $0.04 to reach highs of $0.10 on May 26, gaining 150% in a few days. The crypto market is presently witnessing a correction from stretched levels but it should prove temporary as investors buy back a significant part of the drawdown.
Friday's dip comes despite hopes of more inflation-boosting U.S. stimulus being on the cards as US President Joe Biden is reportedly set to release his first full budget, seeking $8.2 trillion in federal spending this year and $6 trillion for the 2022 fiscal year.
ZAP Technical Analysis: Bulls gather strength to stage a surprising rally

ZAP/USDT Daily Chart
The ZAP/USDT pair may stage a surprising rally after being on the back foot during the cryptocurrency mayhem that lasted for the past few sessions. ZAP rose from lows of $0.0460 to $0.1090, where it's consolidating after probing the topside earlier. At the moment, this sentiment is benefiting the bulls, whose weakening has paused near this year’s lows.
ZAP/USDT climbed 63 points back above $0.1 at the mid-week marketing an impressive run-up which highlighted the sensitivity of the pair to differentials in the crypto market. It remains within a broader $0.9000 to $0.1500 range, though. The price also retreated, but it remains comfortably clear of the support level at $0.0758 that would signal a reversal.
LINK Technical Analysis: Appreciation confined by resistance structure
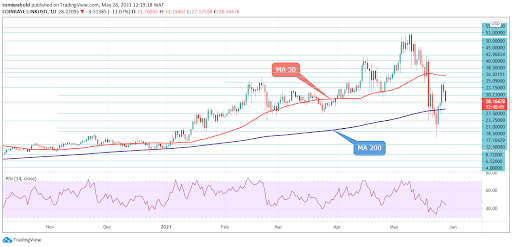
LINK/USD Daily Chart
LINK/USD attempted to move towards the MA 50 ($37.52) after its latest recovery (from the $15 lows), which extended the price to highs of $35.36 on May 27 but fell short of the resistance structure at the MA 50. The LINK/USD pair seems to be presently imprisoned within the $25.36 and $37.52 structure which coincides with the MA 200 and 50 barrier levels.
The short-term oscillators reflect the easing in the positive momentum as the RSI still located in the bearish territory has turned down. If sellers manage to penetrate below the MA 200 at $25.36, support could come at $19.73 and $15. On the flip side, if the pair reverses, the resistance at the $35.36 level and the MA 50 at $37.52 could interrupt further gains.
BAND Technical Analysis: Dips below support as bulls take a breather
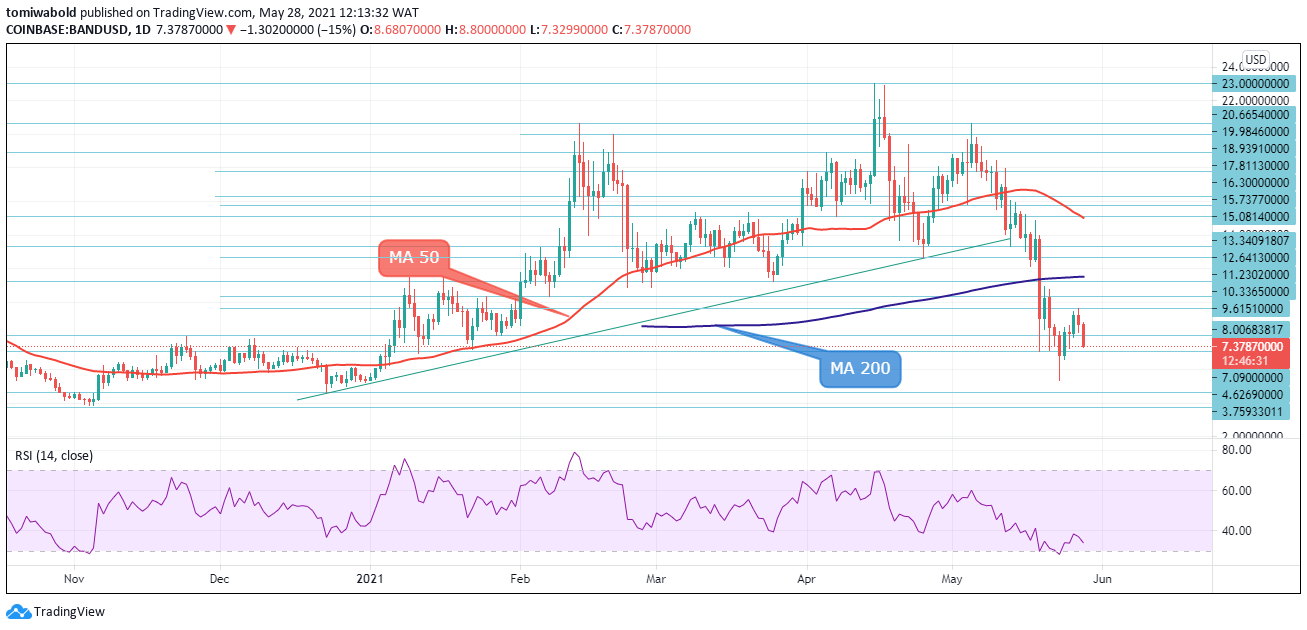
BAND/USD Daily Chart
The falling momentum in the crypto market, and the rise in the US dollar, saw BAND/USDT rally through a weekly high of $9.61 to today's low of $7.32 as the bulls run out of steam towards the end of the week. BAND remains vulnerable to a deeper pullback from these levels as its Relative Strength Index (RSI) remains towards the oversold territory.
Although BAND has support at $7.09 limiting any pullback, we cannot entirely rule out a short and sharp fall to the recent low of the $5.365 support zone. Its price looks set to consolidate at the $9.61 to $7.09 range for the rest of the week.
Conclusion
Oracle tokens appear to be rebounding in line with the broader crypto market, but some, such as ZAP and LINK, have fared considerably better than others. Despite ZAP still being some way off of the highs it reached earlier this month, many investors remain bullish on it due to its strong use cases and potential to follow a similar price trajectory to Chainlink.
Chainlink itself has plenty of additional upside potential and looks set to continue to post strong gains, though its price could fall in the short term if the broader market witnesses a pullback.
Author

Mustapha Azeez
FX Instructor
I am a professional forex trader – signals strategist, funds manager, researcher and coach. I started my trading career some years back.


