Sushi price eyes $3 after clearing key weekly resistance level
- Sushi price flips the $1.628 resistance level into a support floor after a month of struggle.
- A temporary retracement might be a good opportunity to accumulate SUSHI before a retest of $3.
- A breakdown of the $1.267 barrier would invalidate the bullish thesis.

Sushi (SUSHI) price shows signs of kickstarting an uptrend on the weekly chart. But since this outlook is on a higher time frame, it might take a while before SUSHI triggers this upward move.
Also read: Sushi price primed for 70% rally as SUSHI bulls clear critical resistance level
Sushi price confirms a potential uptrend
Sushi price uptrend began after it flipped $1.012, the weekly resistance level into a support floor in early February. Since then, SUSHI has surged 105% in just a month, overcoming the next critical hurdle at $1.628 and setting up a local top at $2.153.
Now, Sushi price is trying to establish itself above the aforementioned hurdle, confirming a successful flip of $1.628. While this setup looks extremely promising, investors must be prepared for a potential pullback before the uptrend begins.
If Bitcoin moves out of its consolidation and attempts to set up a new all-time high at $75,000 or higher, it would give the altcoins a ‘go’ signal. Such a bullish market development is likely to trigger a Sushi price rally to $3, the next psychological level. This move would constitute a nearly 85% gain from the $1.628 level and is likely where the Sushi price will form the next top.
Both the Relative Strength Index (RSI) and the Awesome Oscillator (AO) momentum indicators reflect bullish momentum with no bearish signs.
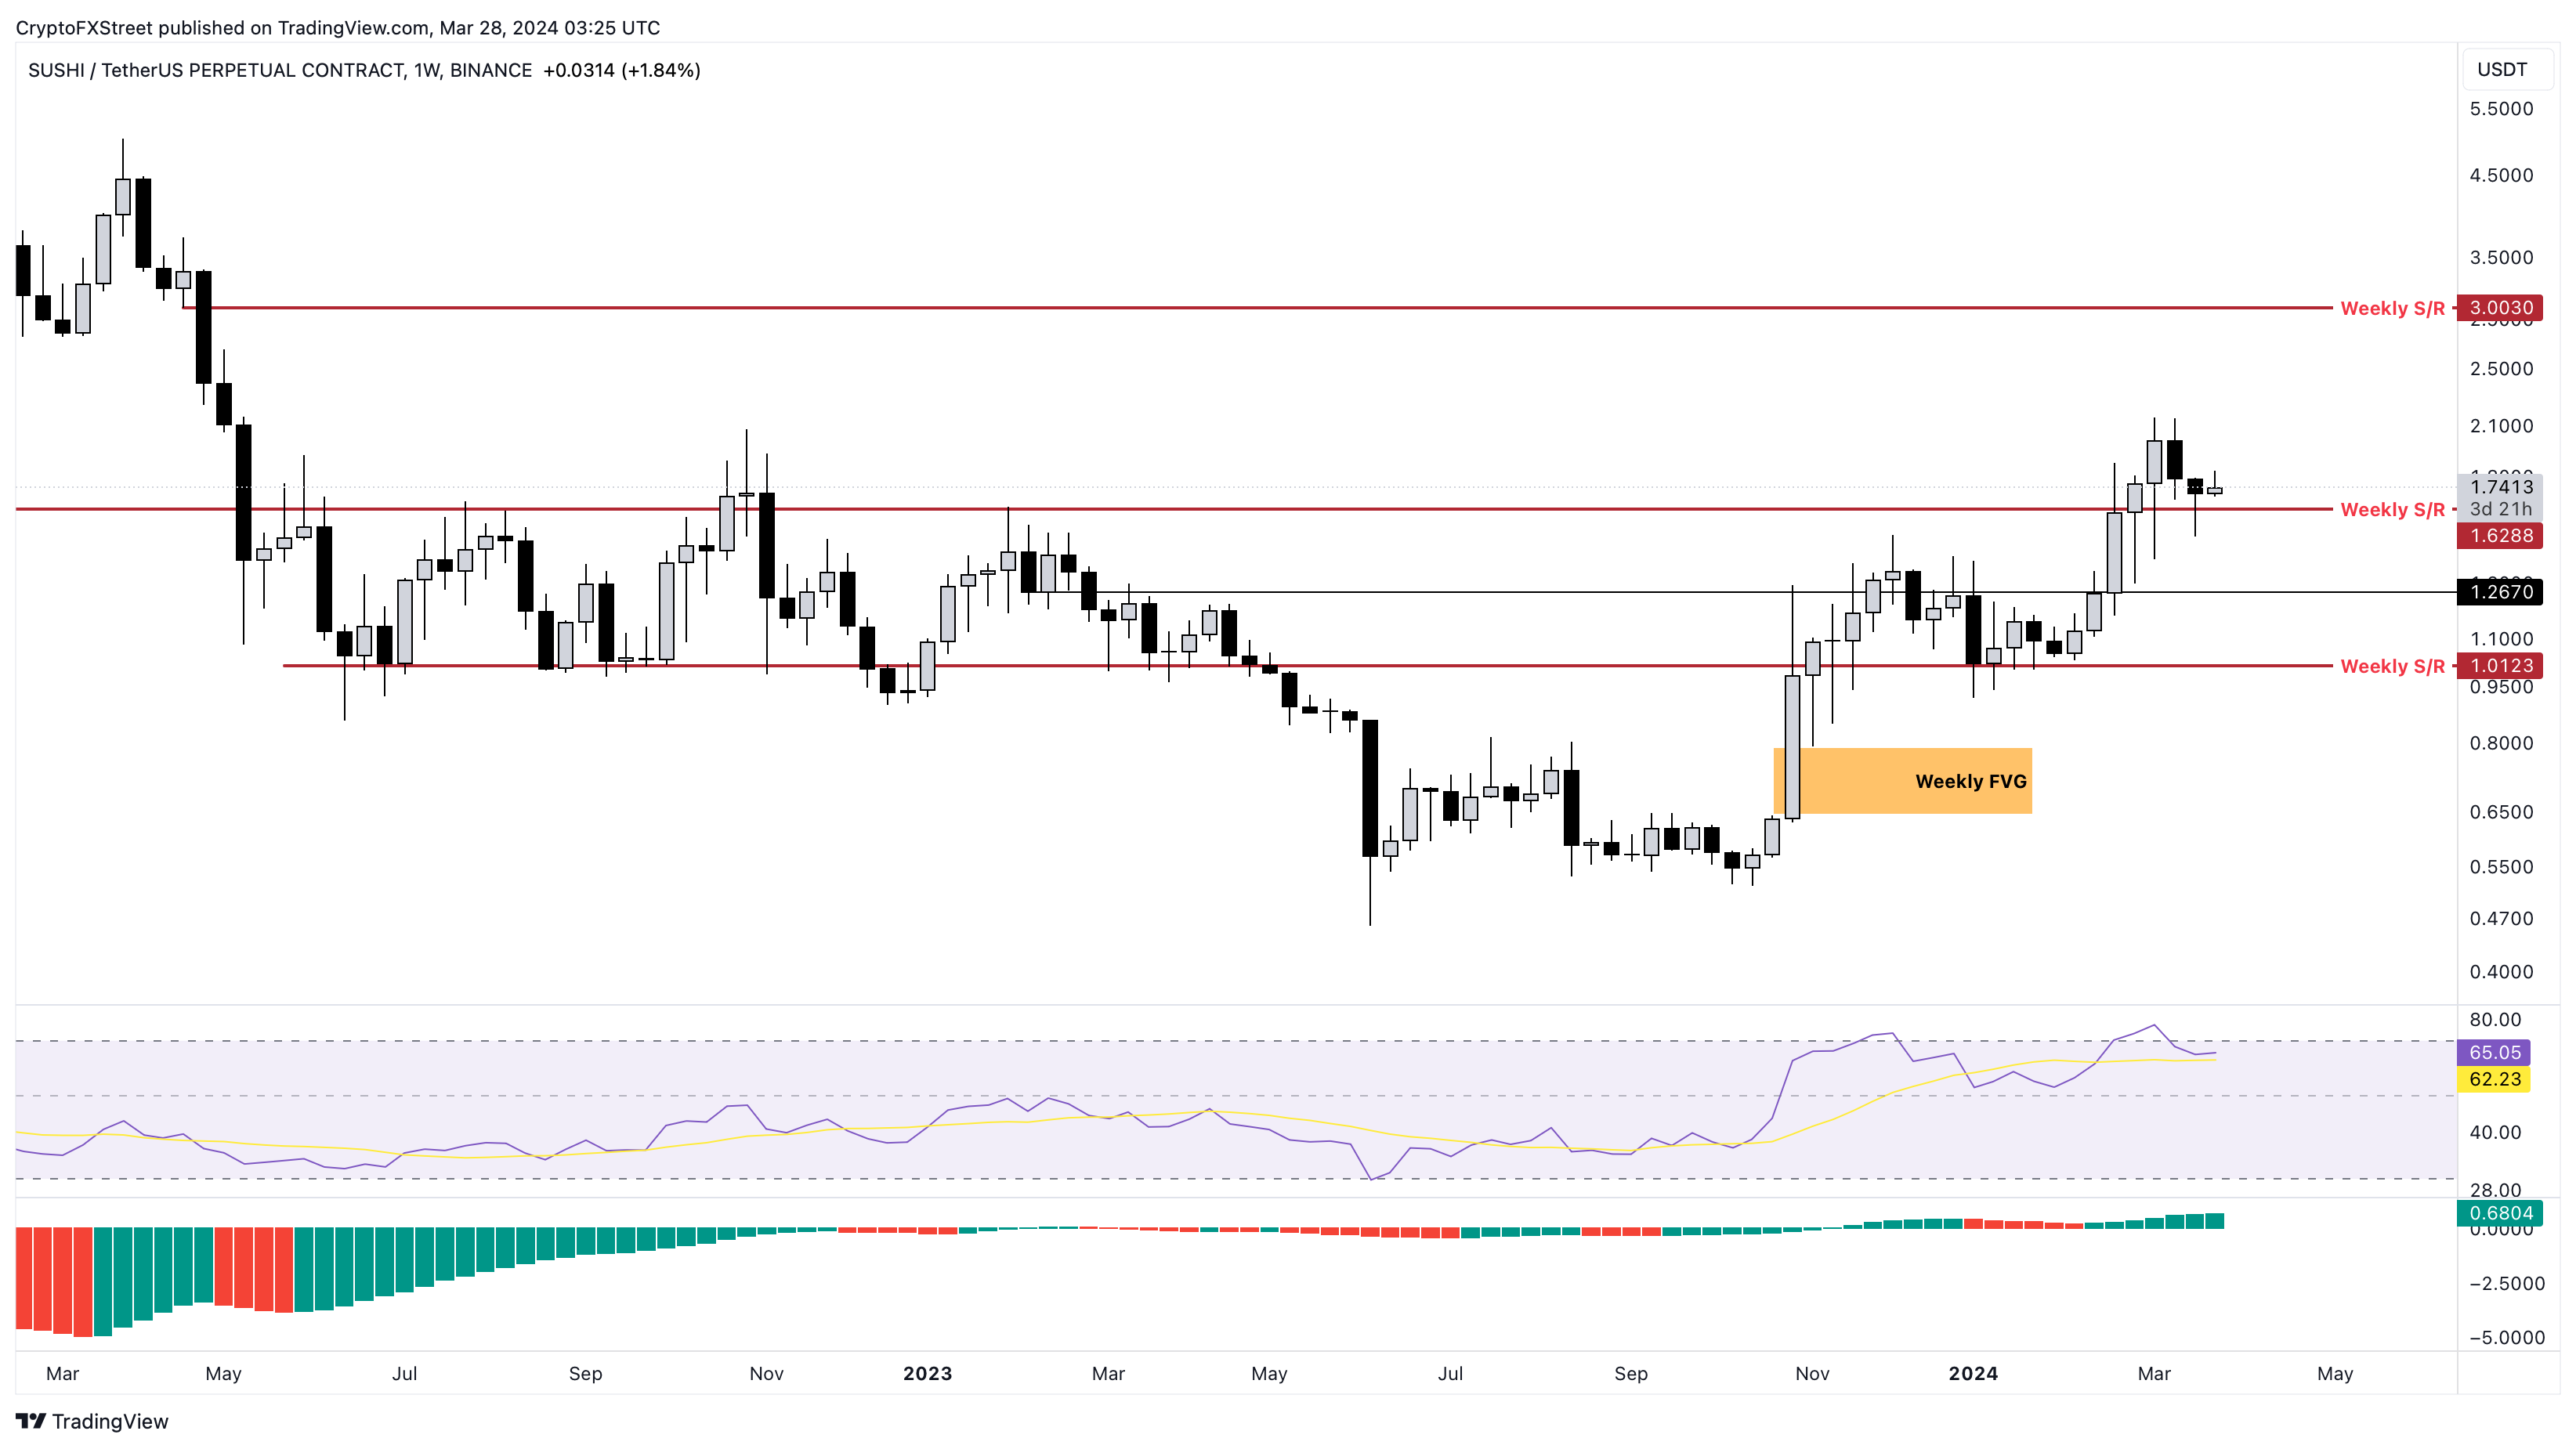
SUSHI/USDT 1-week chart
Santiment’s 30-day Market Value to Realized Value (MVRV) ratio indicator has improved from -11.85% on March 20 to -3.99% as of March 28, noting the number of investors in loss has reduced.
The MVRV indicator is used to determine the average profit/loss of investors who purchased SUSHI in the past month. A negative value means that investors are at a loss, and this is likely where the long-term buyers tend to accumulate. Moreover, as seen in the chart, every time Sushi’s 30-day MVRV dipped beyond -10%, it served as a buying opportunity that propelled the SUSHI price higher.
Additionally, a negative MVRV value suggests that a potential sell-off is unlikely. Therefore, the recovery in 30-day MVRV from -11.85% to near-zero levels indicates that the Sushi price is primed for an uptrend.
 [08.58.32, 28 Mar, 2024]-638471956256554920.png)
SUSHI 30-day MVRV
Lastly, we can see a clear accumulation from whales holding between 100,000 to 1,000,000 SUSHI. The number of tokens held by this cohort has spiked from 55.42 million on March 13 to 59.88 million on March 28. Likewise, the addresses that hold between 10,000 to 100,000 SUSHI have their holdings remain steady at around 14 million tokens after accumulating all the way from nearly 13 million on February 13.
 [09.09.28, 28 Mar, 2024]-638471956552215046.png)
SUSHI Supply Distribution
If SUSHI produces a daily candlestick close below $1.267, it will create a lower low on the daily time frame. This shift in trend favoring bears on a lower time frame would invalidate the bullish thesis and likely attract short-sellers or profit-taking.
In such a case, the Sushi price could revisit the next key weekly support level at $1.012, which is roughly 20% away from $1.267.
(This story was corrected on March 28 at 14:08 GMT to say that a daily candlestick close below $1.267 would shift the trend to favor bears, not bulls.)
Premium
You have reached your limit of 3 free articles for this month.
Start your subscription and get access to all our original articles.
Author

Akash Girimath
FXStreet
Akash Girimath is a Mechanical Engineer interested in the chaos of the financial markets. Trying to make sense of this convoluted yet fascinating space, he switched his engineering job to become a crypto reporter and analyst.


