Stellar Price Prediction: XLM overtakes XRP with $1.5B boost

Stellar (XLM) price climbed 12% to $0.43 on Thursday, adding over $1.5 billion to its market capitalization.
Having often mirrored XRP’s movements, XLM’s market-leading performance on Monday signals intense speculative demand.
Bullish traders hold $13 million in long positions, outpacing the $3 million total active shorts by nearly 70%.
Stellar (XLM) outpaces XRP with a strong market surge
Stellar (XLM) saw an impressive 12% price increase on Thursday, reaching $0.43 and adding over $1.5 billion to its market capitalization.
This surge marks a significant decoupling from XRP, a cryptocurrency with which XLM has historically shared a correlated price movement. XLM’s rally comes amid a broader recovery in the crypto market, with Bitcoin (BTC) reclaiming $105,000 and Ethereum (ETH) trading just shy of the $3,300 mark.
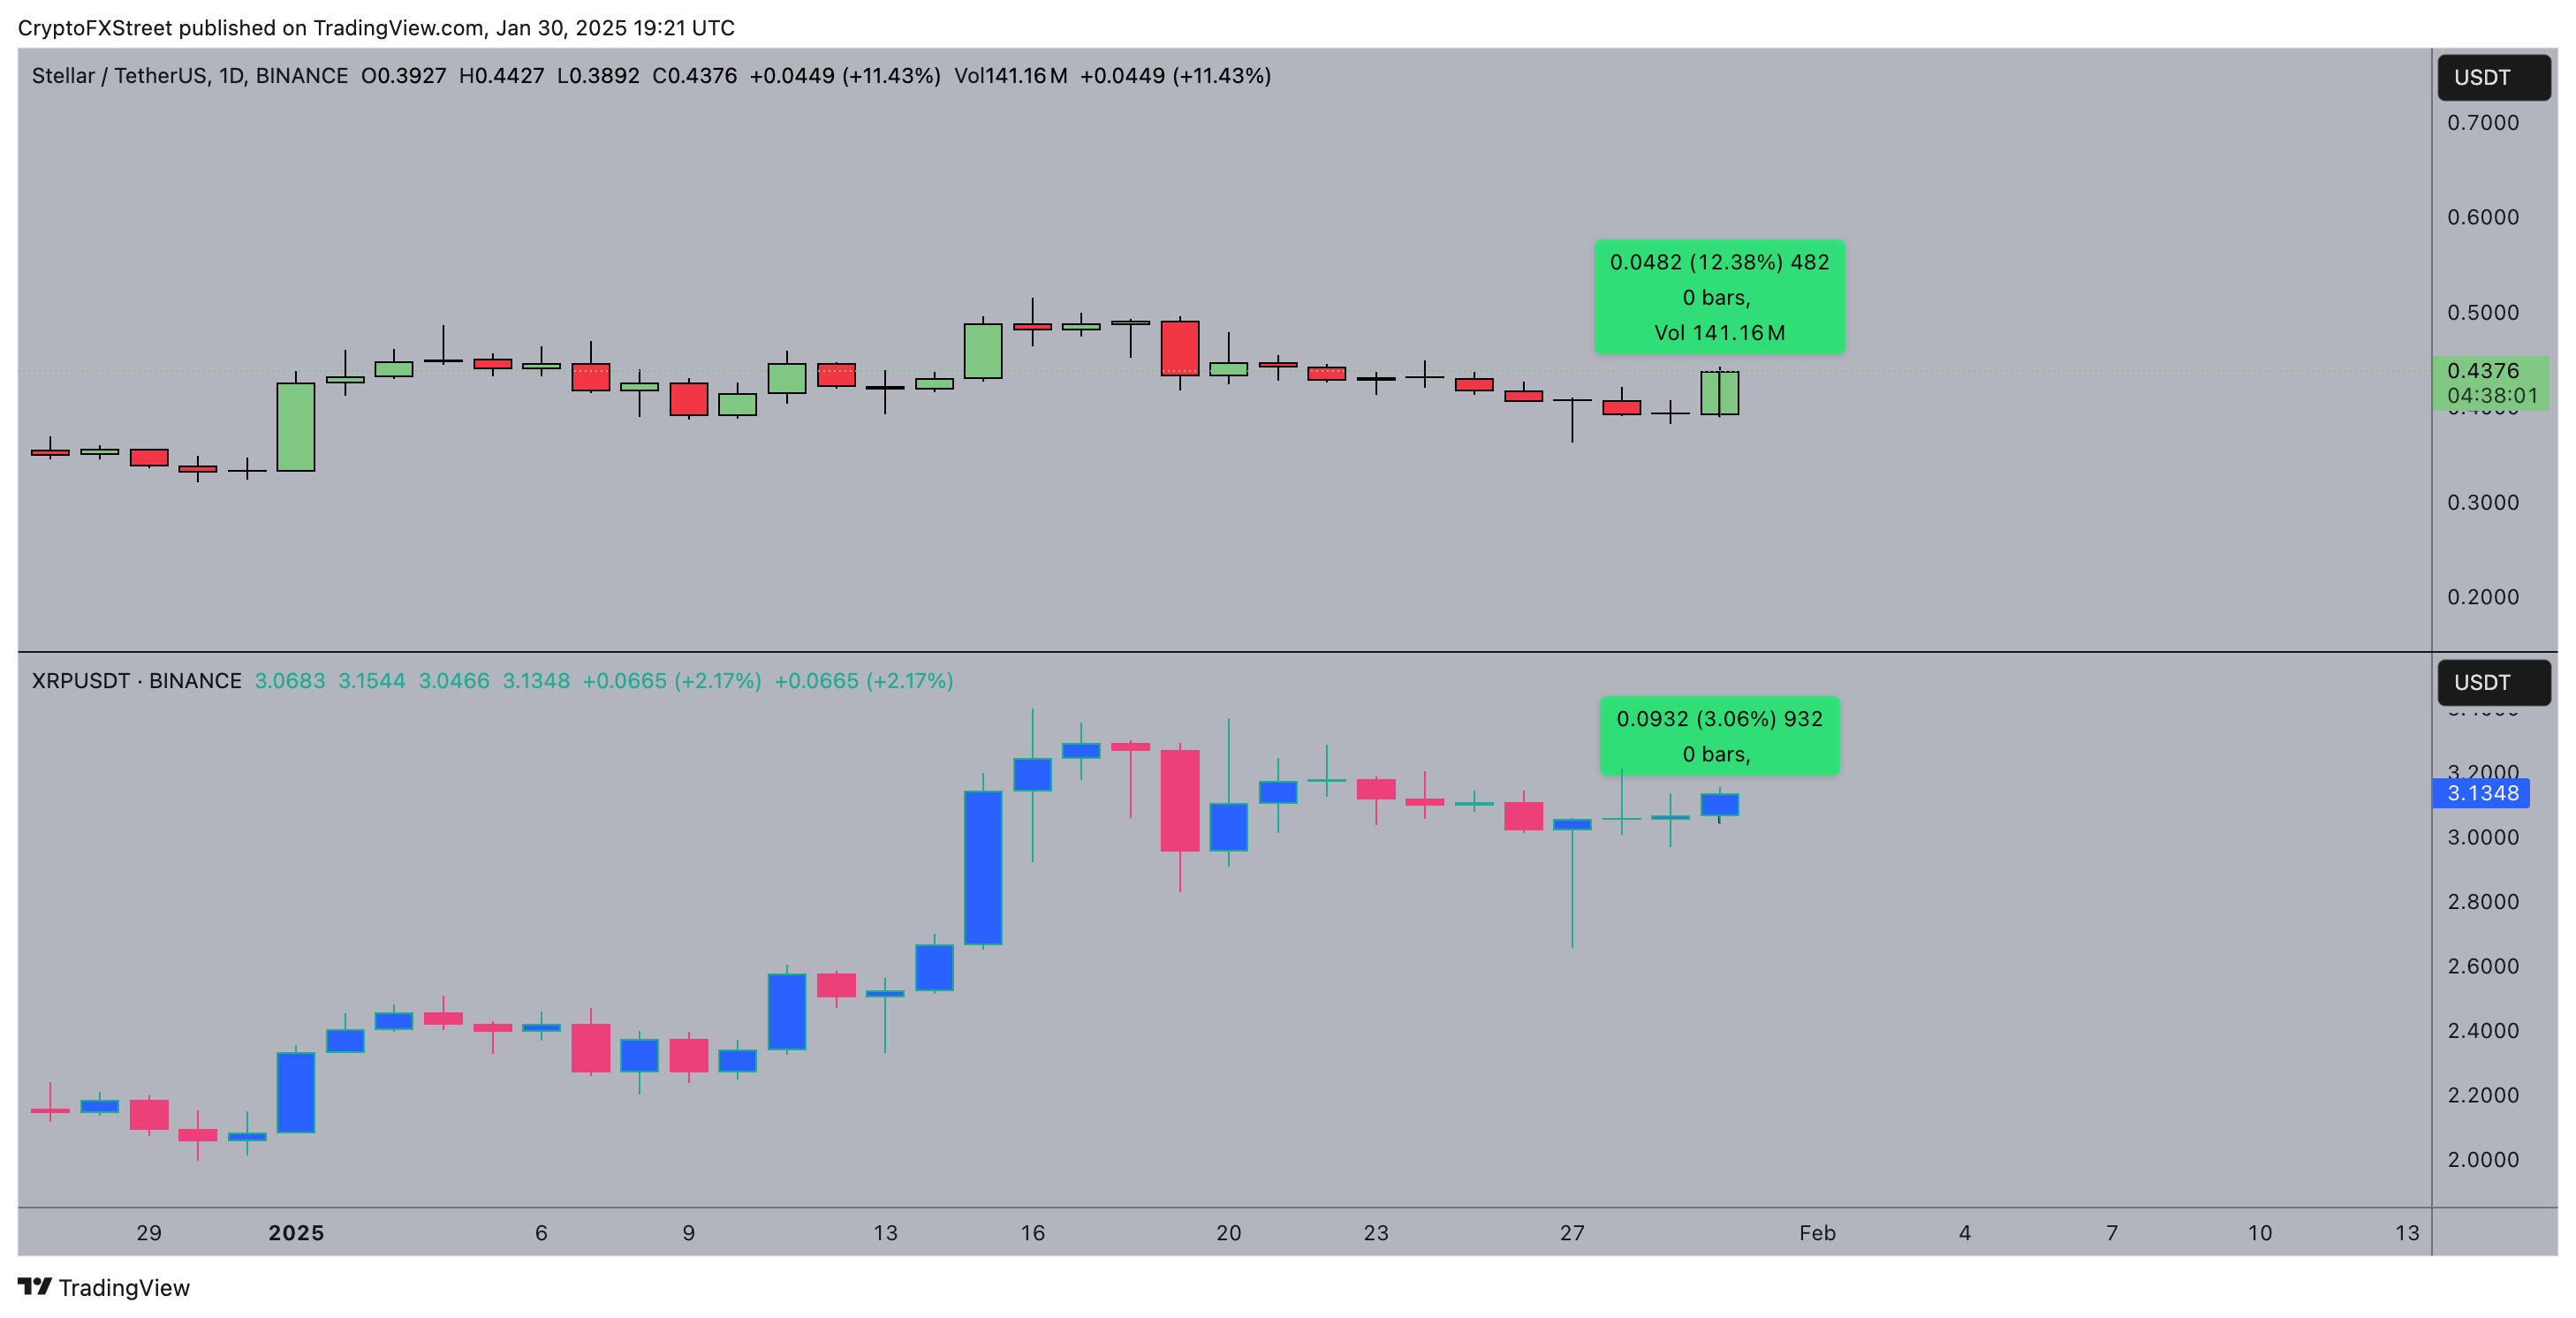
Unlike previous cycles where XLM mirrored XRP’s price action, Stellar raced ahead on Thursday, with its 12.4% gains outpacing XRP’s 3.1% uptick as seen in the chart above.
However, without a significant news event or network update driving growth, XLM’s double-digit rally on Thursday could be linked to growing speculative demand.
Traders selectively place bullish bets anticipating that altcoin ETFs could spark the first major breakout under United States (US) President Donald Trump’s administration.
Bulls deploy $13M leverage after breaking key resistance
Prior to the 12% gains on Thursday, XLM had registered four consecutive daily red candles.
This represents its longest losing streak since XLM was re-listed on Binance in November 2024.
Looking beyond the price chart, trading metrics observed within Stellar derivatives markets affirm that the current price action is considerably influenced by speculative traders’ activity.
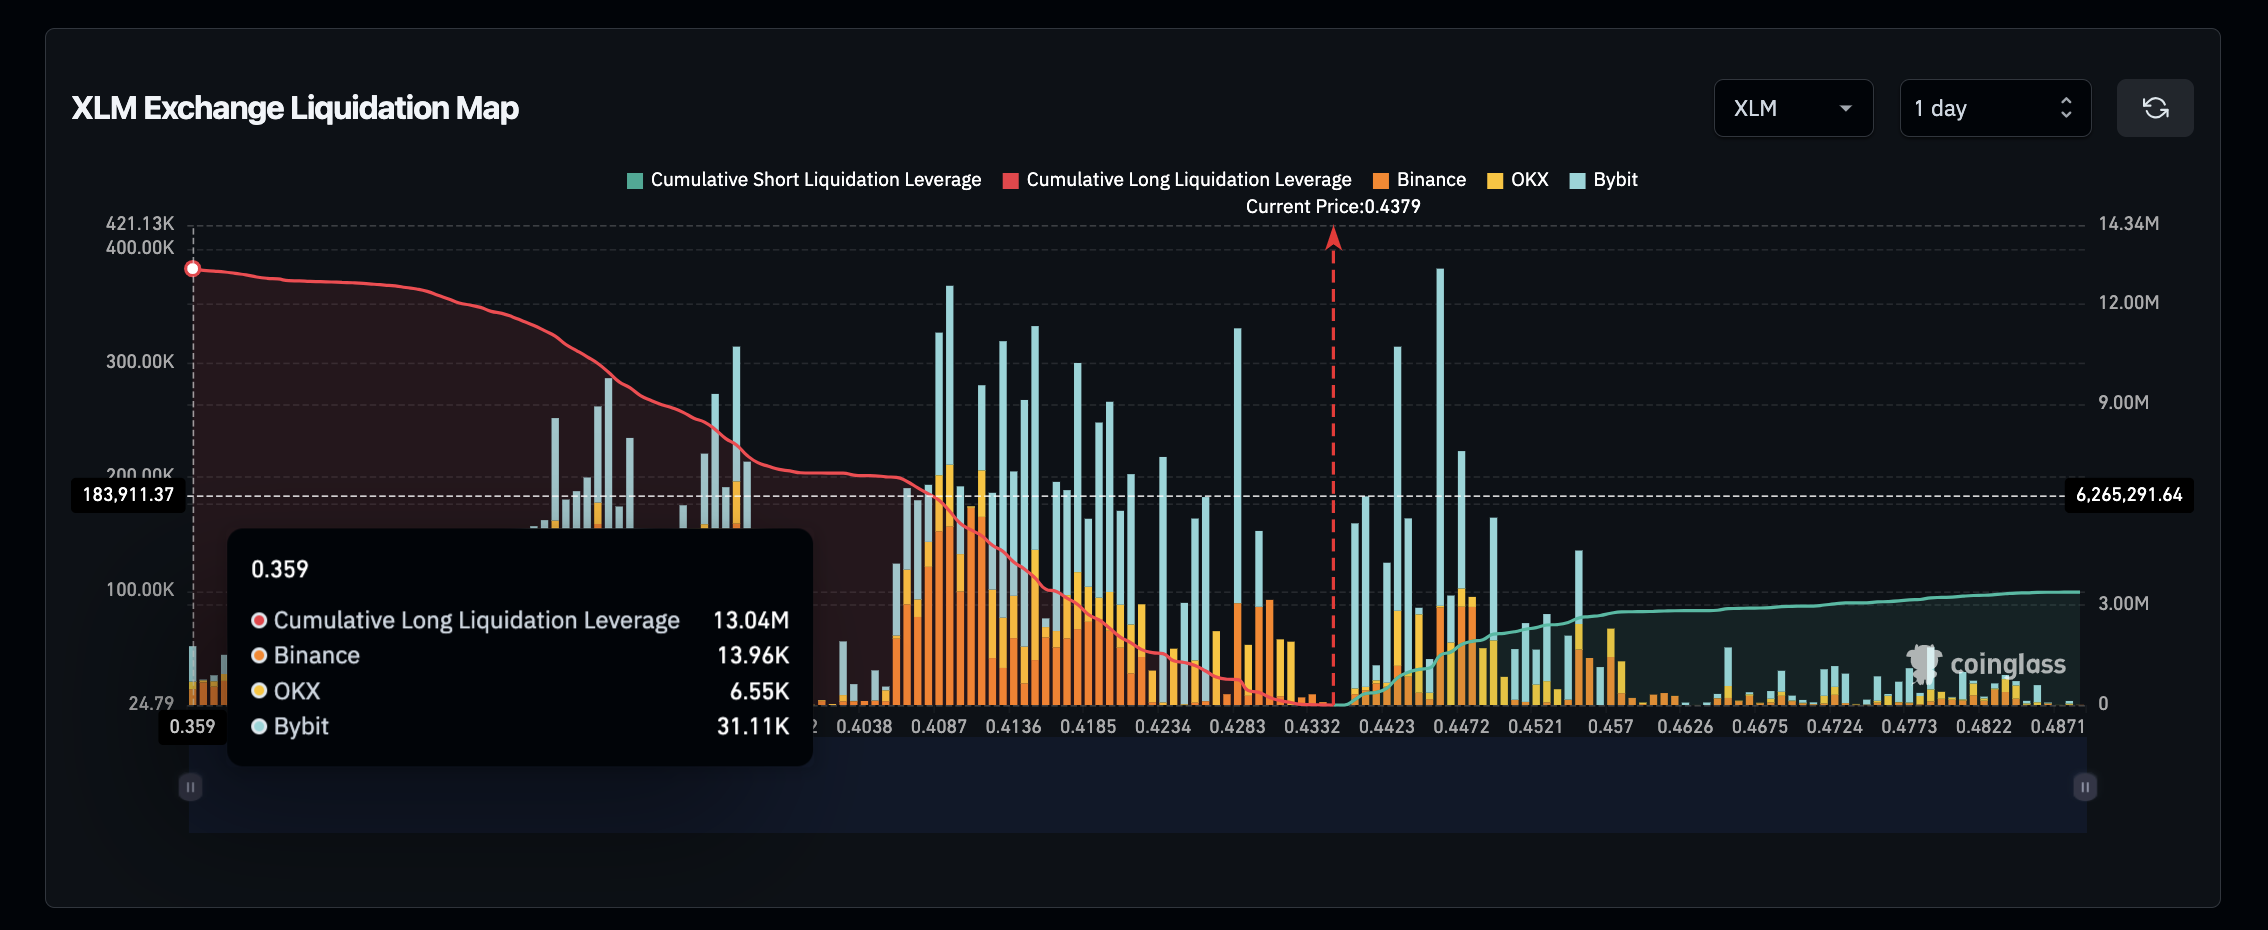
Coinglass Liquidation Map chart above shows bullish traders have aggressively deployed leverage, with long positions totaling $13 million at press time, dwarfing the $3 million in short interest. This 70% imbalance in favor of longs highlights traders’ confidence in continued upside momentum.
Historically, when leveraged longs dominate after a prolonged period of bearish price action, it is often interpreted as a bottom formation signal. Against this backdrop, XLM price is expected to advance further upwards, if market sentiment and liquidity remain at current levels or better.
Stellar Price Forecast: $0.50 could reinforce bullish momentum
Stellar (XLM) price is displaying a positive outlook after breaking out from a falling wedge pattern, after four consecutive losing days to a bullish reversal structure.
The breakout has driven XLM above $0.43, aligning with an increase in trading volume, which suggests growing investor confidence.
The next key resistance lies at $0.50, which, if breached, could fuel further gains toward the projected target near $0.60.

The Bollinger Bands indicate expanding volatility, with the price rebounding off the lower band and now pushing toward the mid-line.
A sustained move above the middle band ($0.44) would confirm bullish control, while a rejection at this level could signal consolidation before another breakout attempt.
The Relative Strength Index (RSI) at 53.80 suggests there is still room for upside before reaching overbought conditions, reinforcing the potential for continued gains.
On the downside, failure to hold above $0.40 could invite bearish pressure, with the lower Bollinger Band at $0.37 acting as key support. If momentum weakens, XLM may retest this
Author

Ibrahim Ajibade
FXStreet
Ibrahim Ajibade is an accomplished Crypto markets Reporter who began his career in commercial banking. He holds a BSc, Economics, from University of Ibadan.



