Solana price poised for a rally after successful retest of descending trendline breakout
- Solana price faces rejection by the weekly resistance at $183.88, but maintains the bullish bias.
- On-chain data shows that SOL's active wallets are increasing, signaling a growing ecosystem and user engagement.
- A daily candlestick close below $133.92 would invalidate the bullish thesis.
Solana (SOL) price encountered resistance at the weekly level of $183.88 and is currently trading 2% lower around $175 on Tuesday. On-chain data indicates a rise in active wallets for SOL, highlighting an expanding ecosystem and heightened user engagement, potentially leading to a rally in the coming days.
Solana price shows potential for a rally
Solana price broke above a descending trendline – drawn from March highs – on July 19, leading to a 9% rally over the following two days. Currently, SOL faces resistance at the weekly level of $183.88 and is undergoing a corrective pullback. At the time of writing, trades down 2.2% at $174.93.
For investors seeking buying opportunities, the $155.22 support level presents a strategic entry point. This level aligns with the 50% price retracement level from the swing low of $121 on July 5 to the swing high of $185.13 on July 21, as well as trendline support and the daily support level. Therefore, $155.22 serves as a critical zone for potential price reversals.
If SOL bounces off the $155.22 level, it could rally 18% to retest its weekly resistance at $183.88.
This potential bounce is supported by indicators like the Relative Strength Index (RSI) and Awesome Oscillator (AO) on the daily chart, both comfortably above their respective mean levels of 50 and 0. These momentum indicators strongly indicate bullish dominance.
If the bulls are aggressive and the US Securities and Exchange Commission (SEC) approves a Solana Spot Exchange Traded Fund (ETF) , then Solana price could extend an additional rally of 11% to retest its daily high of $204.46 from April 1.
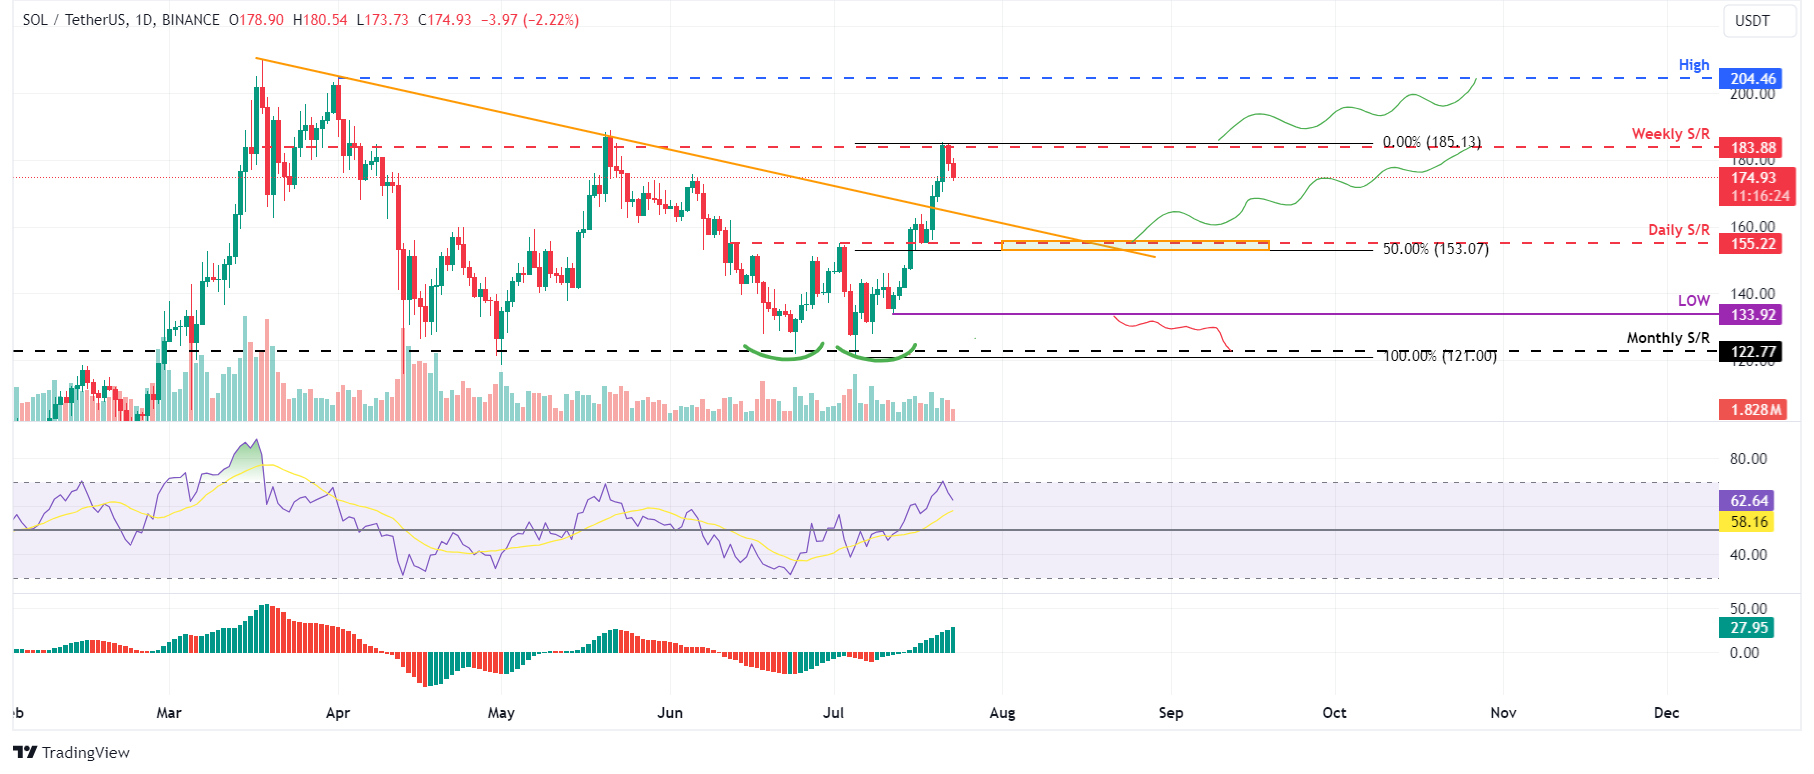
SOL/USDT daily chart
Data from SolScan Active Wallets refer to the number of unique wallet addresses that have engaged in transactions. An increase in active wallets typically indicates growing usage and engagement within a cryptocurrency network.
As in SOL's case, Active Wallets spiked from 1.08 million on July 20 to 1.24 million on July 21, the highest since late March. This increase generally indicates growing usage and engagement within a Solane network.
-638573475642067869.png)
Solana Active Wallets chart
Despite the bullish thesis signaled by both on-chain data and technical analysis, if the SOL's daily candlestick breaks below $133.92, the outlook would shift to bearish. This scenario could lead to a decline of 8.5% to revisit the monthly support level at $122.77.
Author

Manish Chhetri
FXStreet
Manish Chhetri is a crypto specialist with over four years of experience in the cryptocurrency industry.


