|

Solana price is rekt unless this level gets broken

  • SOL price has yet to retrace into a substantial Fibonacci retracement level.
  • Solana price has not printed a candle stick of equal or more value to the May 12 decline.
  • Invalidation of the bearish thesis is a breach above $44.50.

Solana price shows optimism but needs tangible price movement to justify a bullish call.

Solana price needs to retaliate more

Solana price is still suppressed within the $30 region as the 3rd week of June's trading session commences. Over the weekend, the price action traded mostly sideways as neither the bulls nor the  bears could produce a confident rally. The 4-day chart printed an indecision doji candle with significant volume which now suggests an anomalous scenario in play. The overall trend is bearish, thus the thesis will be written from a bearish perspective until more price action validates the idea for a bullish countertrend rally.

Solana price provides confluence of more decline. The Volume Profile indicator has substantially increased without much price movement. Secondly, a Fibonacci retracement tool surrounding the large  decline on May 12, into the new swing low at $25, suggests a 50% retracement level at $44.50 has not been breached. The bears must breach this level first before looking for early entries as previous outlooks forecast that the centralized smart token contract token could fall well below $20. .


tm/eth/6/20/22

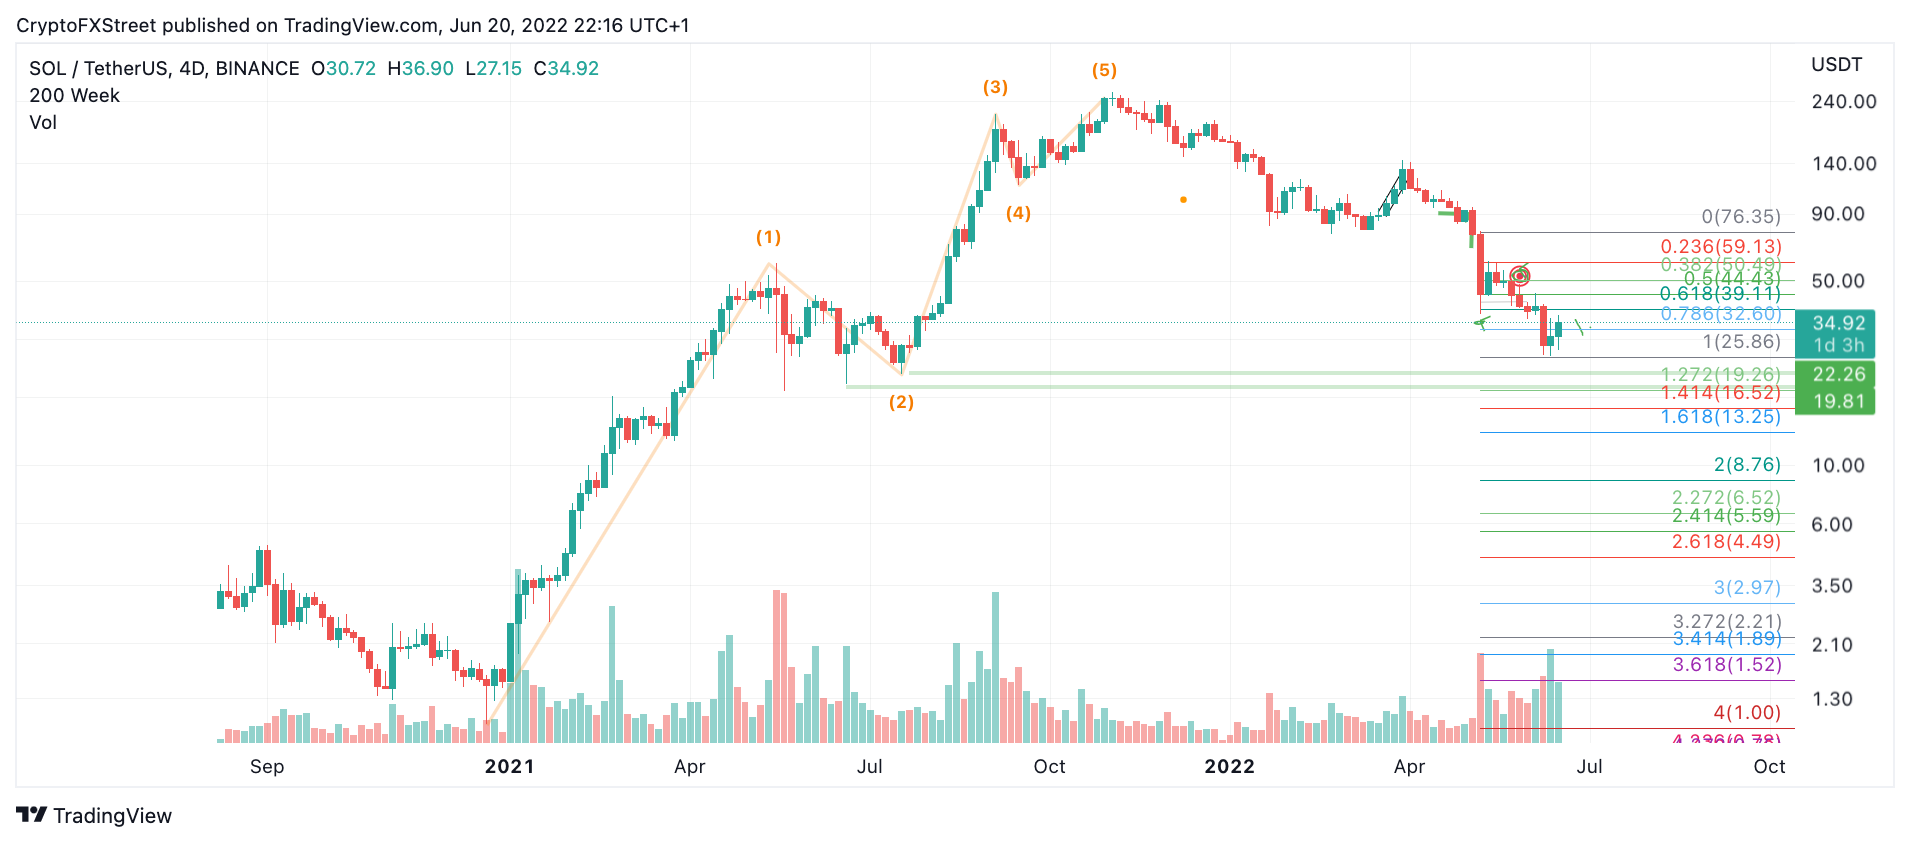
SOL/USDT 4-Day Chart

An invalidation of the bearish onslaught is a breach and close above $44.50 on  the 2-day chart. If the bulls sustained  the price action, they may be able to conquer the 88 dollar threshold, resulting in a 160% increase from the current Solana price.

Author

Tony M.

Tony M.

FXStreet Contributor

Tony Montpeirous began investing in cryptocurrencies in 2017. His trading style incorporates Elliot Wave, Auction Market Theory, Fibonacci and price action as the cornerstone of his technical analysis.

More from Tony M.
Share:

Editor's Picks

Ripple slides as low retail, institutional demand weigh

Ripple edges lower, trading marginally below $1.60 at the time of writing on Tuesday as bulls and bears battle for control. The cross-border remittance token rose to $1.66 on Monday, but profit-taking and risk-off sentiment in the broader crypto market led to the ongoing correction.

Bitcoin recovers slightly amid ETF inflows, Strategy accumulation

Bitcoin price steadies at $78,000 on Tuesday after rising 2.30% the previous day, following last week’s massive correction. US-listed spot ETFs record an inflow of $561.89 million on Monday, while Strategy adds 855 BTC to its reserve.

Crypto Today: Bitcoin, Ethereum, XRP recovery stalls amid mixed ETF flows

Bitcoin holds above $78,000 but struggles to extend its recovery amid ETF inflows. Ethereum trades under pressure below the $2,300 immediate hurdle, undermined by weakening technical structure.

Monero Price Forecast: XMR extends decline amid persistent bearish outlook

Monero remains under intense selling pressure for the third consecutive week, recording a 4% loss at press time on Tuesday. This is consistent with the declining retail interest in privacy coins, which was among the lowest-performing segments over the last week.

Bitcoin Price Annual Forecast: BTC holds long-term bullish structure heading into 2026

Bitcoin (BTC) is wrapping up 2025 as one of its most eventful years, defined by unprecedented institutional participation, major regulatory developments, and extreme price volatility.

Bitcoin: BTC correction deepens as Fed stance, US-Iran risks, mining disruptions weigh

Bitcoin (BTC) price extends correction, trading below $82,000 after sliding more than 5% so far this week. The bearish price action in BTC was fueled by fading institutional demand, as evidenced by spot Exchange-Traded Funds (ETFs), which recorded $978 million in inflows through Thursday.