|

Why Solana price is being removed from traders’ hodl list

  • Solana price has breached a consolidative trend line in an impulsive fashion.
  • An increase in selling volume warrants the idea of more decline.
  • Invalidation of the downtrend is a breach above $43.

Solana price could continue the bearish downtrend as technical indicators show that the bears are not yet ready to release their grip.

Solana price can't say when, but it says how

Solana price displays negative behavior as the bears have suppressed the "centralized Ethereum killer" into a zone unprovoked since July 2021. The bearish decline has been accomplished in a "penny from the Eiffel style" manner as what was once thought as a back-and-forth chop ultimately led to a free-fall frenzy on the daily chart.

Solana price currently trades at $30, now a 88% decrease from the all-time highs at $259.90. The bears have flexed their guns, printing several engulfing candles, which seem unchallenged at the current time. If the bulls do not seek vengeance very soon, the bears could push the price into liquidity levels below $20. The most disturbing signal which confounds the bearish idea is the volume pattern. The bears have significantly shown up with pressure, a well-defined ramping pattern and the influx of transactions as prices descend. Investors seeing these odds are likely to look for better opportunities in the crypto market.

TM/SOL/6/14/20

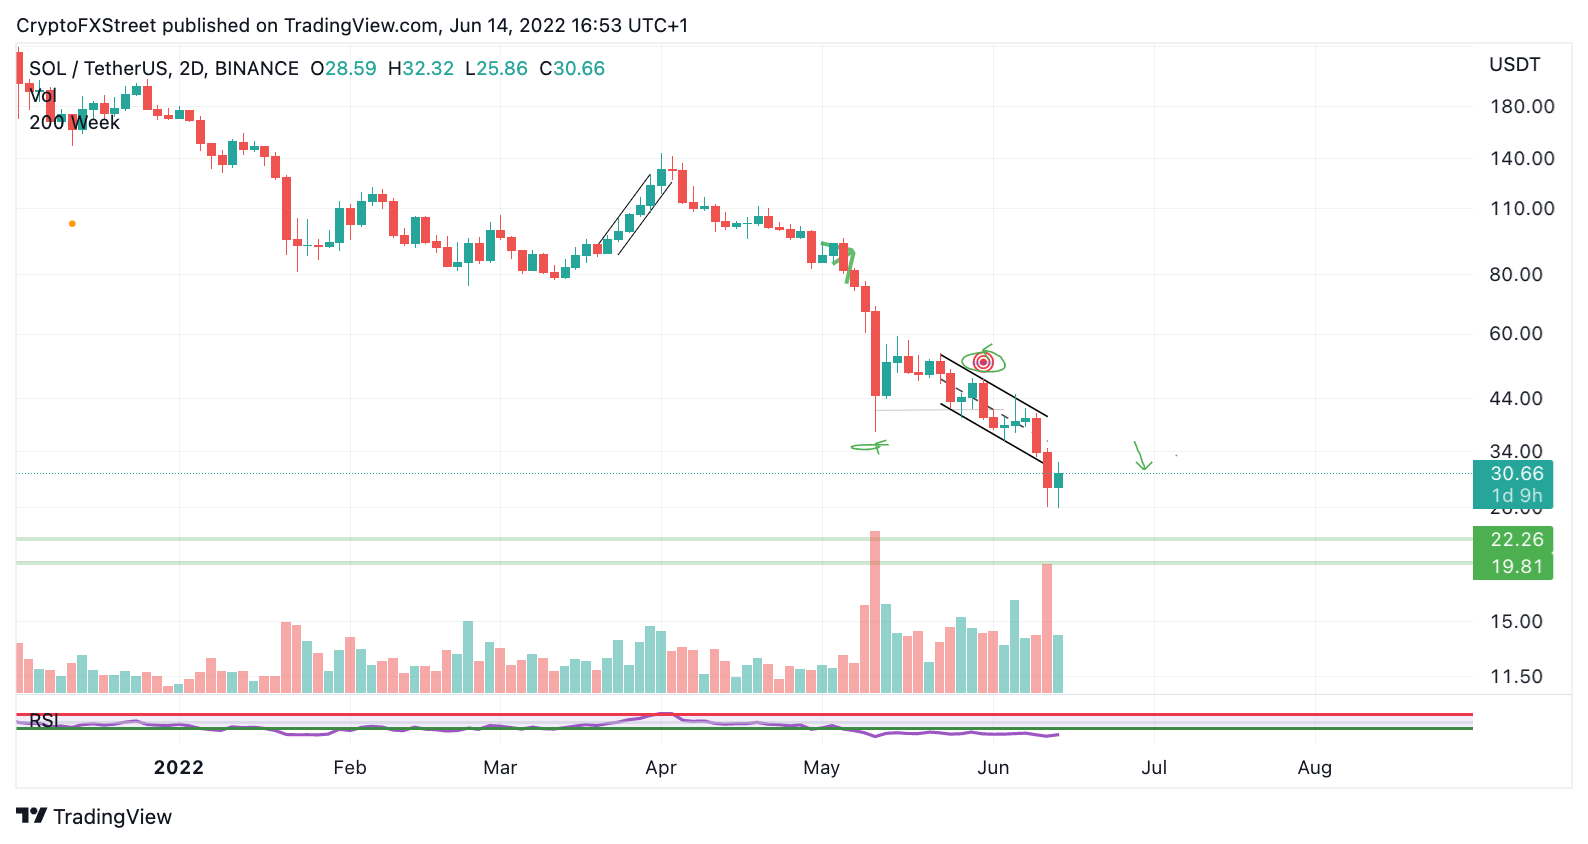
Sol/USDT 2-Day Chart

Invalidation of the downtrend is a breach above the previous wave four degree at $43. A breach at this level could trigger a rally as high as the $60 mark, resulting in a 100% increase from the current Solana price

Author

Tony M.

Tony M.

FXStreet Contributor

Tony Montpeirous began investing in cryptocurrencies in 2017. His trading style incorporates Elliot Wave, Auction Market Theory, Fibonacci and price action as the cornerstone of his technical analysis.

More from Tony M.
Share:

Editor's Picks

Ripple slides as low retail, institutional demand weigh

Ripple edges lower, trading marginally below $1.60 at the time of writing on Tuesday as bulls and bears battle for control. The cross-border remittance token rose to $1.66 on Monday, but profit-taking and risk-off sentiment in the broader crypto market led to the ongoing correction.

Bitcoin recovers slightly amid ETF inflows, Strategy accumulation

Bitcoin price steadies at $78,000 on Tuesday after rising 2.30% the previous day, following last week’s massive correction. US-listed spot ETFs record an inflow of $561.89 million on Monday, while Strategy adds 855 BTC to its reserve.

Crypto Today: Bitcoin, Ethereum, XRP recovery stalls amid mixed ETF flows

Bitcoin holds above $78,000 but struggles to extend its recovery amid ETF inflows. Ethereum trades under pressure below the $2,300 immediate hurdle, undermined by weakening technical structure.

Monero Price Forecast: XMR extends decline amid persistent bearish outlook

Monero remains under intense selling pressure for the third consecutive week, recording a 4% loss at press time on Tuesday. This is consistent with the declining retail interest in privacy coins, which was among the lowest-performing segments over the last week.

Bitcoin Price Annual Forecast: BTC holds long-term bullish structure heading into 2026

Bitcoin (BTC) is wrapping up 2025 as one of its most eventful years, defined by unprecedented institutional participation, major regulatory developments, and extreme price volatility.

Bitcoin: BTC correction deepens as Fed stance, US-Iran risks, mining disruptions weigh

Bitcoin (BTC) price extends correction, trading below $82,000 after sliding more than 5% so far this week. The bearish price action in BTC was fueled by fading institutional demand, as evidenced by spot Exchange-Traded Funds (ETFs), which recorded $978 million in inflows through Thursday.